

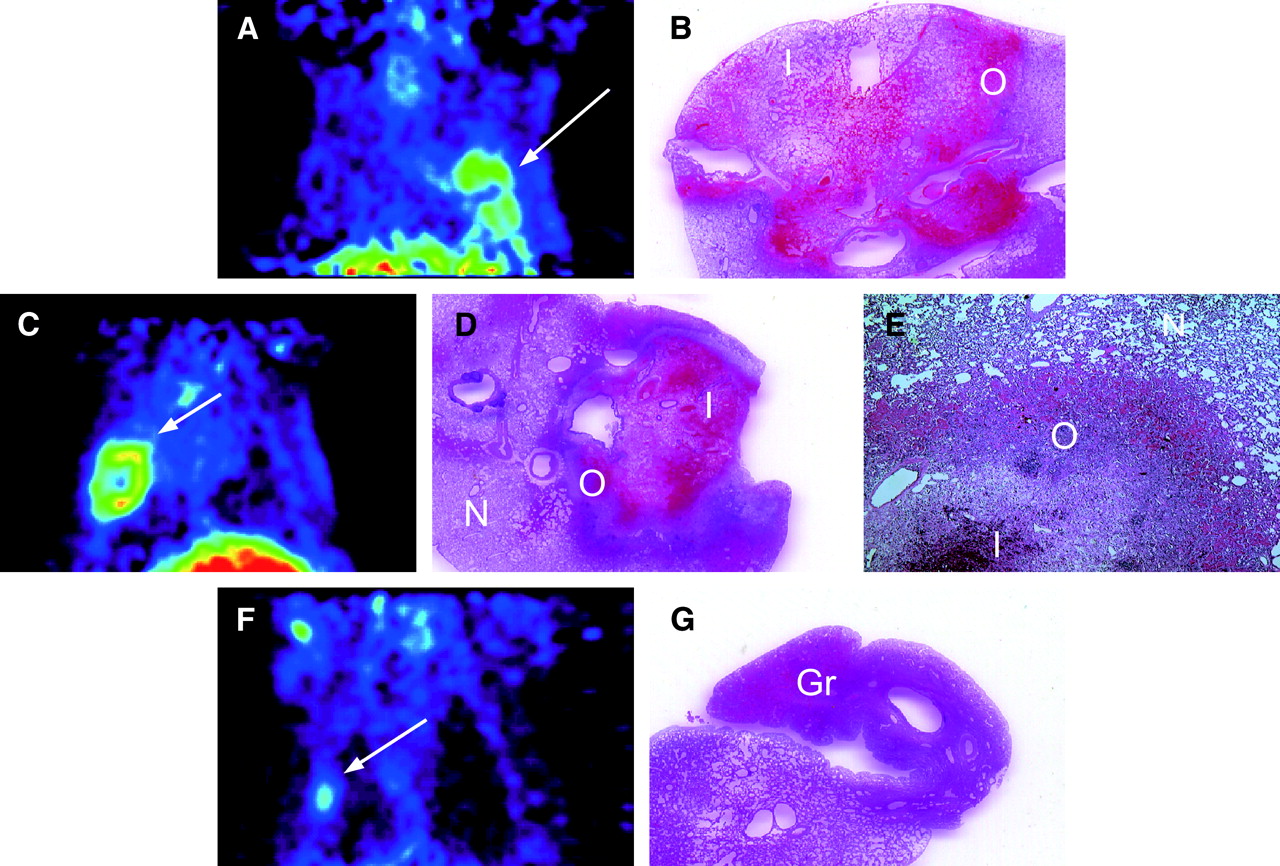
FIGURE 2.

(A and B) In normal lung 1 d after RFA, coronal PET image (A) shows ring-shaped accumulation of 18F-FDG (arrow) at site of RFA, and histopathologic specimen (B) shows coagulative necrosis in inner zone, relatively fewer morphologic changes in mid zone, congestion and inflammatory cell infiltration in outer zone, and an area of normal lung tissue. Region of 18F-FDG accumulation on PET correlates with outer layer of inflammatory cell infiltration. (C–E) One week after RFA, coronal PET image (C) shows an accumulation similar to but higher than that at 1 d, and histopathologic specimens (normal view [D] and magnified view [×40, E]) show increasing inflammatory cell infiltration and granulomatous changes in outer and inner zones and an area of normal lung tissue. (F and G) Four weeks after RFA, coronal PET image (F) shows reduced 18F-FDG uptake, and histopathologic specimen (G) shows granulomatous tissues, fibrosis, and inner necrotic regions reduced in size. Gr = granulomatous tissues; I = inner zone; N = normal tissue; O = outer zone.
In this issue


Related Articles
Cited By...
- Immediate Postablation 18F-FDG Injection and Corresponding SUV Are Surrogate Biomarkers of Local Tumor Progression After Thermal Ablation of Colorectal Carcinoma Liver Metastases
- 18F-FDG PET/CT Is an Immediate Imaging Biomarker of Treatment Success After Liver Metastasis Ablation
- 18F-FDG PET After Radiofrequency Ablation: Is Timing Everything?