


Abstract
Currently, 2 types of phantoms (physical and computer generated) are used for testing and comparing tomographic reconstruction methods. Data from physical phantoms include all physical effects associated with the detection of radiation. However, with physical phantoms it is difficult to control the number of detected counts, simulate the dynamics of uptake and washout, or create multiple noise realizations of an acquisition. Computer-generated phantoms can overcome some of the disadvantages of physical phantoms, but simulation of all factors affecting the detection of radiation is extremely complex and in some cases impossible. To overcome the problems with both types of phantoms, we developed a physical and computer-generated hybrid phantom that allows the creation of multiple noise realizations of tomographic datasets of the dynamic uptake governed by kinetic models. Methods: The method is phantom and camera specific. We applied it to an anthropomorphic torso phantom with a cardiac insert, using a SPECT system with attenuation correction. First, real data were acquired. For each compartment (heart, blood pool, liver, and background) of the physical phantom, large numbers of short tomographic projections were acquired separately for each angle. Sinograms were built from a database of projections by summing the projections of each compartment of the phantom. The amount of activity in each phantom compartment was regulated by the number of added projections. Sinograms corresponding to various projection times, configurations and numbers of detector heads, numbers of noise realizations, numbers of phantom compartments, and compartment-specific time–activity curves in MBq/cm3 were assembled from the database. Results: The acquisition produced a database of 120 projection angles ranging over 360°. For each angle, 300 projections of 0.5 s each were stored in 128 × 128 matrices for easy access. The acquired database was successful in the generation of static and dynamic sinograms for which the myocardial uptake and washout was governed by a compartment kinetic model. Conclusion: A method has been developed that allows creation of sinograms of physical phantoms with the capacity to control the number of noise realizations, the level of noise, the dynamics of uptake in the phantom compartments, and the acquisition parameters and acquisition modes.
The determination of appropriate reconstruction methods in SPECT is important for obtaining high-quality tomographic images. This purpose has generated a significant amount of research in the design of reconstruction methods for improving performance and generating better-quality images. An important part of this research is evaluating new reconstruction methods and new data analysis techniques, such as the processing of dynamically acquired data. These evaluations can require lengthy data acquisitions, of which the time and number can be reduced with appropriately generated databases.
Both subjective and objective approaches are used for the evaluation of reconstruction methods. The subjective methods rely on the judgment of the operator in determining the superiority or inferiority of a particular reconstruction or processing method. This type of image evaluation is, of course, completely dependent on an operator. However, these types of methods are important because, ultimately, clinical evaluation is done by an operator. With an objective or task-based assessment of image quality, a reconstructed image is evaluated by comparison with a known truth using some objective quantitative figure of merit based on a particular task (1).
The objective methods can be divided into 2 main categories (Fig. 1): experimental methods that rely on the use of physical phantoms and experimental methods that rely on numeric phantoms and Monte Carlo simulations. One of the most popular physical phantoms for evaluation of cardiac imaging is the Jaszczak Torso Phantom with Cardiac Insert (Data Spectrum). This phantom consists of several compartments, each corresponding to a physiologically different component, such as myocardium, left ventricular blood pool, lungs, liver, and background. In the objective experimental method (Fig. 1), physical phantoms with phantom compartments are loaded with specific levels of radioactivity, and the data are collected using a SPECT scanner. The main advantage of using physical phantoms is that the data are collected using an actual scanner, so all physical effects of radiation detection are “included” in the data. Collected data are reconstructed next, and the reconstructed images are then compared with the truth. The main disadvantage of this approach is the difficulty of using the physical phantoms to simulate activity changes as a function of time. Also, with this approach it is difficult to exactly repeat any particular experiment. On the other hand, with numeric phantoms and Monte Carlo simulations it is easy to control noise, repeat the experiment, and simulate dynamic uptake in different compartments of the numeric phantom. These types of methods are denoted as objective numeric methods in Figure 1. However, accurate simulation of the physics of radiation detection is complex with this type of approach.
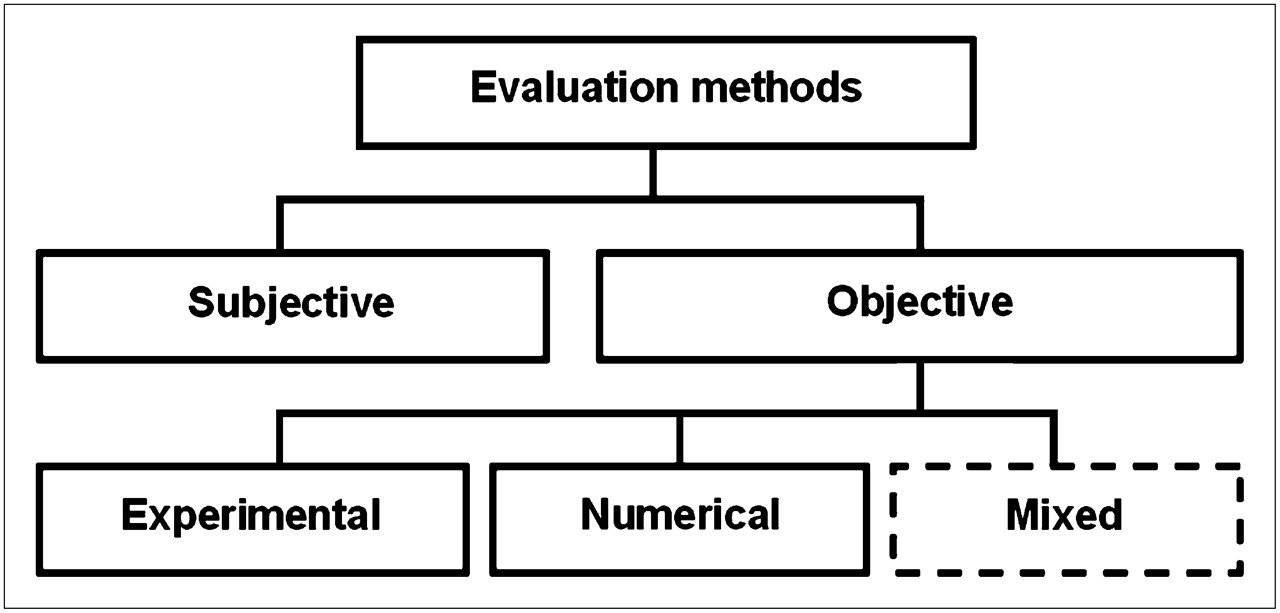
Flowchart representing methods used for evaluation of reconstruction techniques. Dashed box corresponds to approach described in this paper.
In this paper, we propose a mixed objective approach (Fig. 1) that combines the advantages of physical phantoms and the advantages of numeric phantoms. The method is specific and valid only for a given physical phantom and a given scanner and consists of 2 steps: data acquisition and sinogram generation. In data acquisition, a database is created consisting of short, experimentally acquired projections of single phantom compartments. Next, in the sinogram generation phase, sinograms are assembled from the database.
The idea behind this approach is that once the database is created, sinograms that correspond to different acquisition parameters can be created from the database without a need for repeated acquisitions. In our approach, the acquisition parameters for sinograms to be created from the database can be specified as follows: numbers and configurations of detector heads (e.g., a camera with 3 heads can be modeled with data acquired by only 1 head), numbers of angular samples, matrix sizes, acquisition speeds, numbers and time–activity curves of phantom organ compartments (e.g., the time–activity curves can be governed by kinetic models), and numbers of noise realizations. These sinogram parameters are used to select an appropriate subset of projections in the database, and these projections are added to form a sinogram that corresponds to the specifications. This approach is correct under the assumption of a low counting rate, when the sensitivity and efficiency of the SPECT camera are approximately constant (dead-time effects are negligible). The method gives tremendous flexibility and convenience because after the initial creation of the database (40–60 h of acquisitions), acquisitions with different parameters can be created from the database and, ideally, acquisition of the data for the particular phantom will never again be necessary. Samal and Bergmann (2) used a similar idea for the creation of synthetic data for a static renal planar study.
In this study, we implemented our method using the Jaszczak Torso Phantom with Cardiac Insert on a Millennium VG3 camera with Hawkeye attenuation correction (GE Healthcare). Sample sinograms that correspond to static and dynamic uptake in the myocardium were created from the database and are presented in this report. A simple example of the application of our method to evaluate a maximum-likelihood expectation maximization (MLEM) (3) reconstruction in 2 dimensions is also presented.
MATERIALS AND METHODS
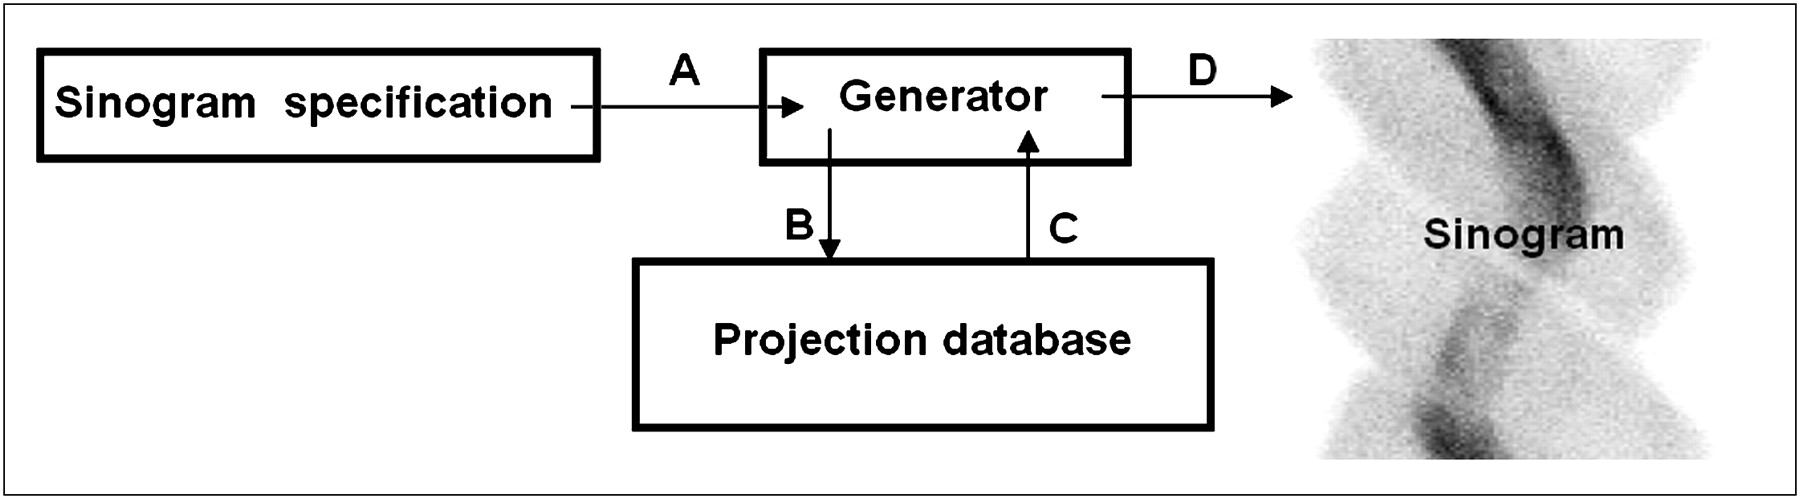
The method consists of 2 parts. In the experimental part, the experimental data are acquired as a series of short projections for each detector stop and for each compartment of the phantom. Although we used the Jaszczak Torso Phantom, any phantom could be used. In the sinogram generator part, a computer program selects appropriate projections in the database and adds them to form a sinogram that corresponds to the user specifications (Fig. 2).

Workflow for sinogram generation. First, parameters of sinogram that is to be created are passed to generator (A). Next, generator requests appropriate projections from database (B). Projections are sent back to generator (C), which adds them together, creating sinogram (D).
After emission acquisition, the CT portion of the dual-modality GE camera was used to acquire high-resolution images of the phantom. The CT images serve as attenuation maps for attenuation correction when reconstructing emission images. The CT images, after segmentation and replacement of compartments with simulated activities, could also be used as a true standard when reconstruction methods are evaluated.
Experimental Data Acquisition and Database Creation
The experimental part of the method consists of acquiring data from a physical phantom using a SPECT scanner. Each physical phantom consists of several compartments that correspond to different physiologic regions. The projection data are acquired for each phantom compartment separately; that is, activity is present in only 1 compartment for each scan. Later, the projections corresponding to different compartments are simply scaled and summed, giving projections of the phantom with activity in all compartments.
Angular sampling during creation of the database needs to be specified when the data are acquired. The finer the sampling, the more acquisition configurations will be available when the sinograms are later extracted by the generator. However, finer sampling also means that more projections need to be acquired, increasing the time needed for the creation of the database. We decided to use 3° of separation between projections, because this amount would provide up to 120 projections per 360° scan, which is comparable with the angular sampling used in clinics.
We used 1 camera rotation, and a large number of short projections were acquired at each stop of the detector. The larger the number of projections is for each angle, the greater is the number of independent noise realizations that will be available in the database. Again, a compromise is needed between the flexibility of the resulting database and practical issues, such as the size of the database or the time needed for the data acquisition.
Because the acquisition takes a long time, information about the amount of physical decay for each projection, in addition to the initial activities in the compartments, needs to be stored in the database. The information about the amount of the physical decay is later used by the sinogram generator. The activities that were loaded in the compartments at the beginning of the scan were similar to or lower than those suggested by the phantom manufacturer.
The phantom had to be moved between scanning of its different compartments to remove activity from one compartment and add it to another but had to be positioned identically when scanning of each compartment began. Maintaining the same axial position was straightforward—we simply marked the position on the scanner bed. To maintain the same tilt, we attached a laser level (Strait-Line) to the bed.
After the data had been acquired, a simple database was constructed using the following fields: scanner head number, phantom compartment number, angle (projection number), activity in compartment, number of projections, name of data file, flag indicating whether data were compressed, size of matrix, and data format (e.g., integer, real, big-endian or little-endian).
In this study, the projection database was created using 2 detector heads positioned 180° apart. Data were acquired for 4 compartments of the phantom, using an energy window positioned at 140 keV with a width of 20%. The following 99mTc activity concentrations and total activities were put into the compartments at the beginning of each scan: 0.700, 1.036, 0.087, and 0.573 MBq/cm3 (46, 125, 835, and 699 mBq) for left ventricular blood pool, left ventricle, background, and liver, respectively. The total scanning time for each compartment varied from 8 to 14 h.
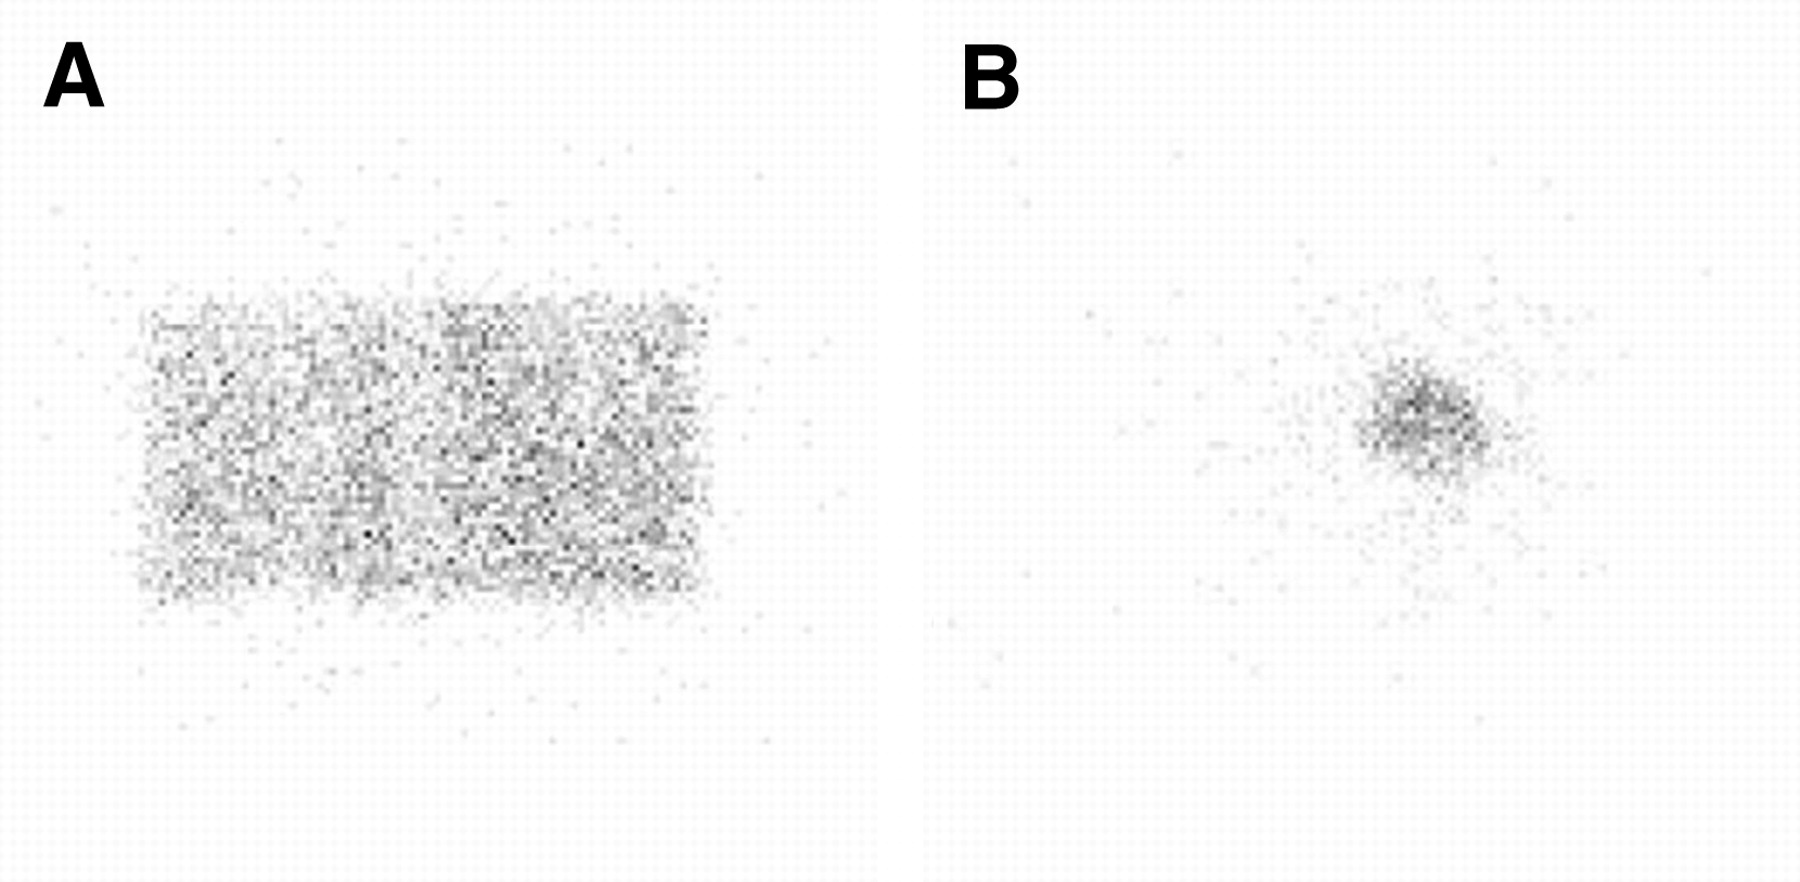
For each compartment, we used 1 camera rotation and acquired data at 120 angles (360° range). At each camera stop, 300 projections of 0.5 s each were obtained for each head and saved in 128 × 128 matrices. The number of projections acquired per angle per head was limited to 300 because of gantry memory limitations. Figure 3 is an example of 1 projection of a background and myocardial compartment. The low count, corresponding to only a 0.5-s acquisition, in these projections can clearly be seen. After the SPECT scan, a CT scan was obtained and saved in a 256 × 256 matrix. Examples of images obtained by CT are presented in Figure 4.

Examples of single 128 × 128 projections. (A) Projection of phantom background in which counts total 7,409, with most (66%) nonzero pixels having 1 or 2 counts. (B) Projection of myocardium in which counts total 1,192, with 72% of nonzero pixels having 1 or 2 counts.

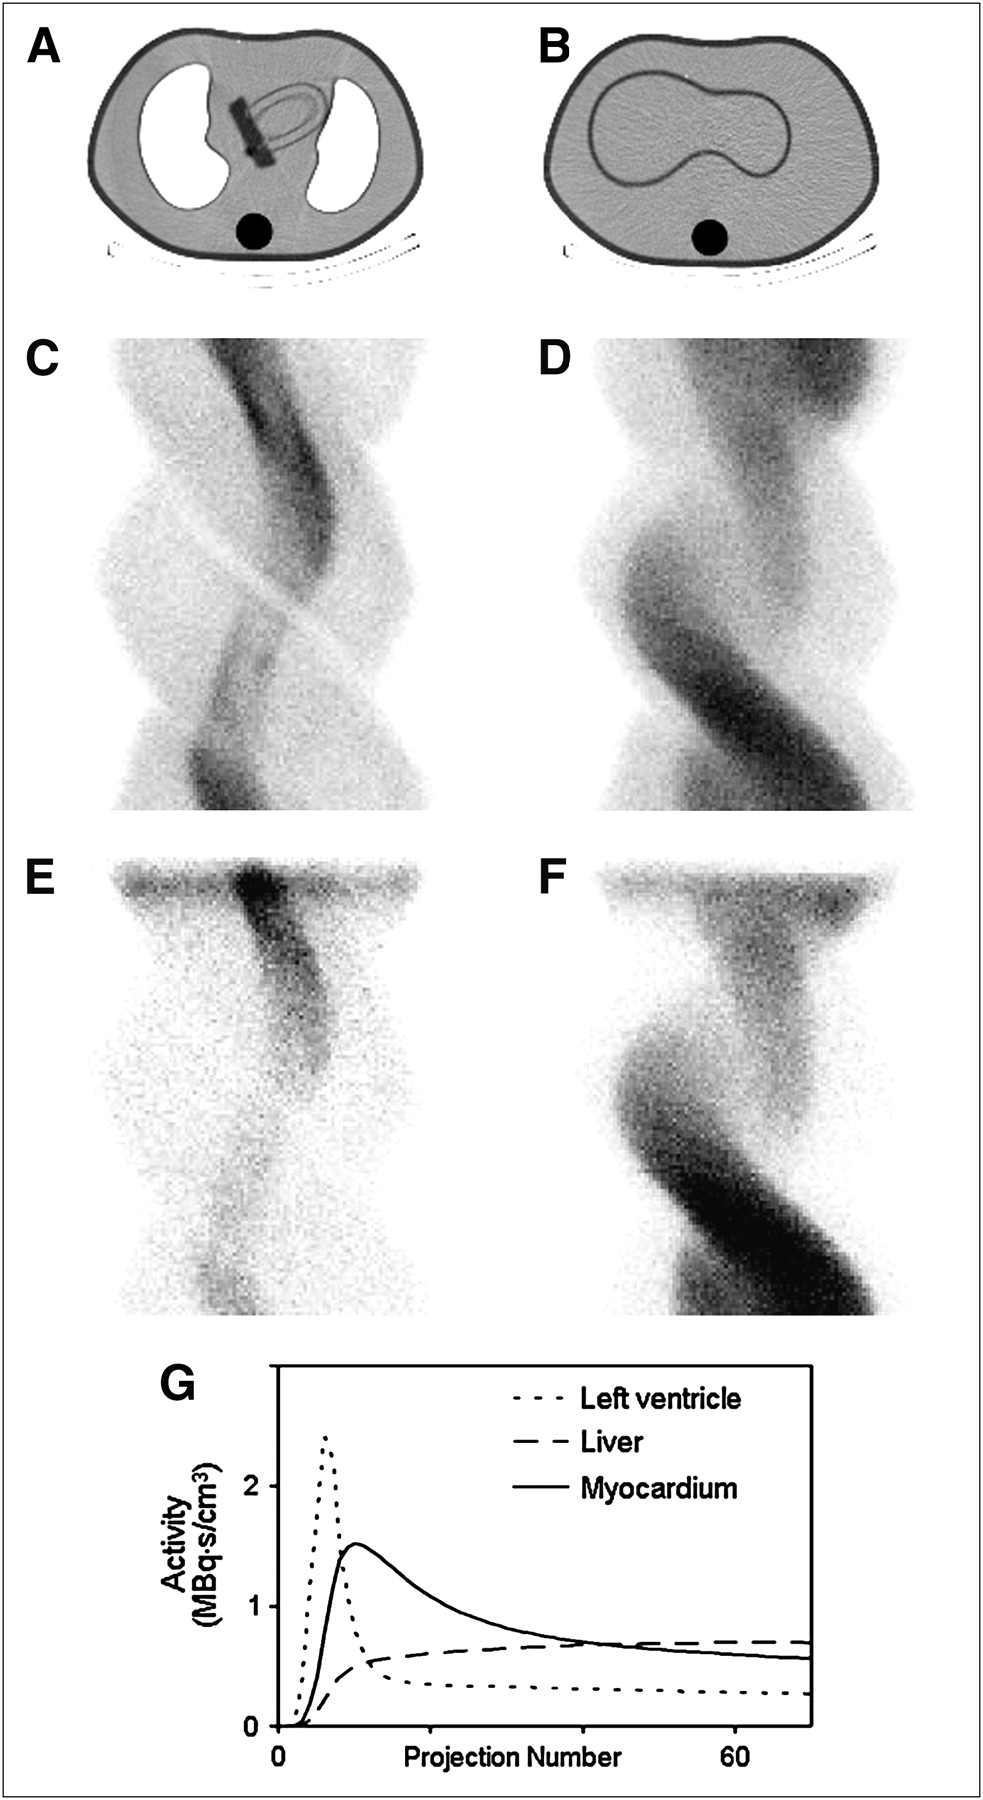
(A) CT slice through heart region of phantom. Phantom insert can clearly be seen because of higher attenuation of acrylic walls of insert. (B) CT slice through liver region of phantom. Liver insert can clearly be differentiated. (C and D) Sinograms created from data corresponding to heart and liver slices in A and B, showing 120 projections over 360° and corresponding to static activities of 0.74, 7.4, 0.37, and 3.3 MBq·s/cm3 for blood pool, myocardium, background, and liver, respectively (activities in phantom compartments do not change with projections). (E and F) Dynamic sinograms corresponding to heart and liver slices in A and B. (G) Time curve from which dynamics were prescribed.
Sinogram Specification and Sinogram Generator
The next step in creating a custom sinogram of the phantom is to choose the sinogram specifications (Fig. 2) that will be sent to the generator. These describe the sinogram to be created from the data. The number and configuration (relative position, starting angle, angular sampling, matrix size, number of projections, and scan range) of the detector heads must be specified. Also, the required activity in the compartments and the time per projection have to be specified in units of MBq·s/cm3—the number of disintegrations per cubic centimeter. The activity must be specified for each projection. If the activity is the same for each projection, a static acquisition will be generated. If dynamic curves describing changes in radioactivity over time are available, dynamic uptake and washout during scanning can be simulated. Curves describing the dynamic changes can be generated analytically by application of a kinetic model or by other means. Finally, several noise realizations of a given sinogram can also be specified.
The generator is a computer program that communicates with the database and assembles requested sinograms from projections stored in the database (Fig. 2). If, for example, the sinogram that corresponds to the 180° acquisition is specified to start at 270°, the generator searches the angle field of the database for the record that corresponds to 270° and starts to assemble the sinogram at that record, wrapping around to 0° when necessary.
The important thing is to achieve a projection that corresponds to a specified activity. For example, the specifications (Fig. 2) for some projection k might require creating a projection of the ith compartment of the phantom for 2.5 MBq·s/cm3 in the ith compartment. Suppose that the projections stored in the database were acquired during the acquisition step with an initial activity of 0.6 MBq·s/cm3 loaded into the compartment and that projection k was acquired 6 h after the start of the acquisition. When k was acquired, the actual activity in the compartment was reduced by half because of physical decay (6-h half-life for 99mTc) and equaled 0.3 MBq·s/cm3. Therefore, to create a projection that corresponds to 2.5 MBq·s/cm3, the generator must sum 2.5/0.3 = 8.333 projections. This is done by randomly selecting 9 projections (without repetition) and adding them with a weight of 1.0, excepting 1 projection that is added with a weight of 0.333. If another noise realization of this projection is needed, another 9 projections are selected randomly without summing the projections that had already been chosen in the current or previous selections. Thus, for this example, only n/9 independent noise realizations can be created (n is the number of projections available for a given camera head and angle). This also means that for the above example, the maximum specified activity in the compartment cannot exceed 0.3n MBq·s/cm3.
Investigation of Dead-Time Effect
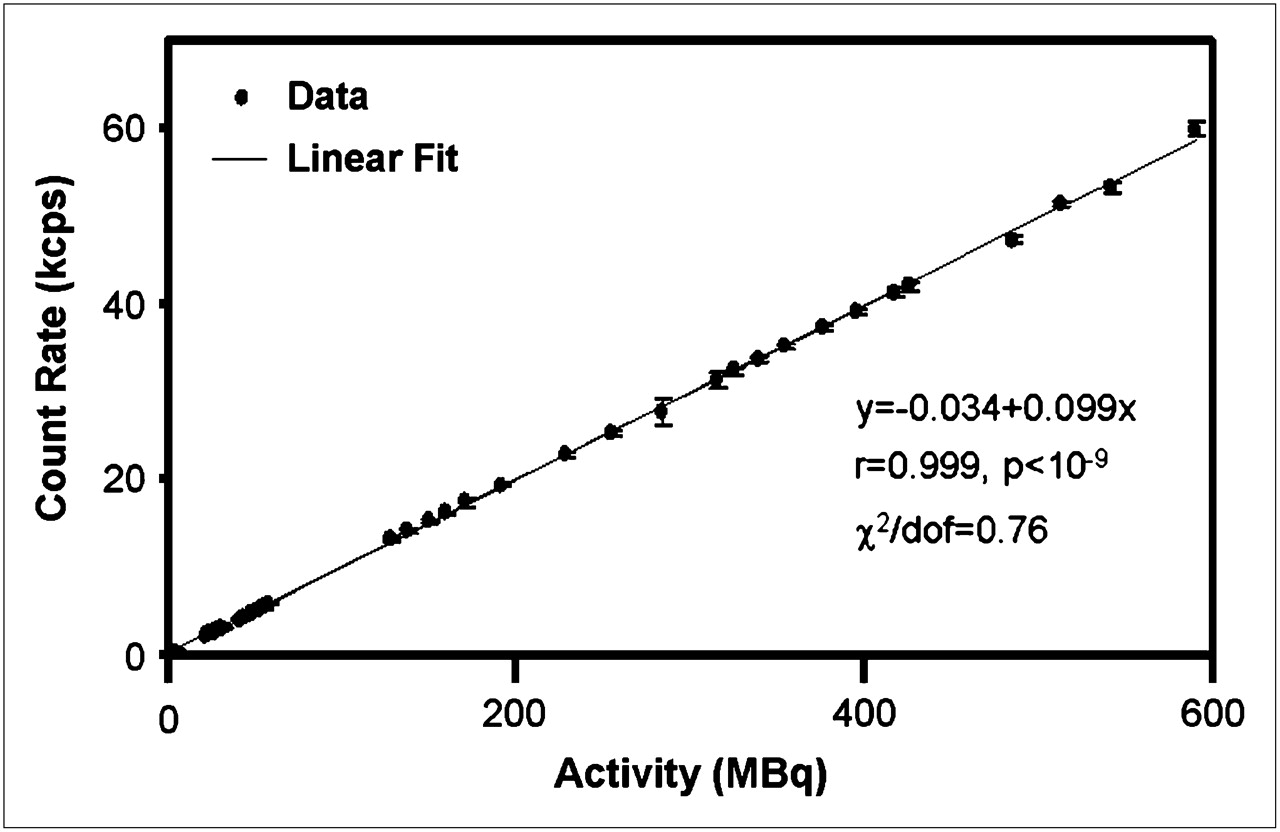
To investigate the effect of dead time on the counting rate, we loaded 780 MBq of 99mTc into a 1.5-L plastic bottle and placed it in the camera. The counting rate versus the total activity in the phantom was measured 35 times over 3 d. For every measurement, the total activity in the phantom was calculated on the basis of the half-life of 99mTc. The range of activities and counting rates was the same as in the database for the Jaszczak Torso Phantom. For every measurement, the counting rate was measured 14 times to reduce statistical fluctuations. Average and sample SDs were calculated and plotted.
Examples of Applications
Static and Dynamic Sinograms.
A static sinogram (the same activity was in each compartment during acquisition) was generated with 0.74, 7.4, 0.37, and 3.3 MBq·s/cm3 for blood pool, myocardium, background, and liver, respectively.
A dynamic sinogram was generated by varying the activities in the compartments with time. First, the time–activity curves corresponding to a 1-compartment kinetic model for the myocardium and liver were generated (Fig. 4G). Next, these curves were used as input to the sinogram generator, which assembled projections corresponding to dynamic changes described by the curves.
Reconstruction of Generated Sinograms.
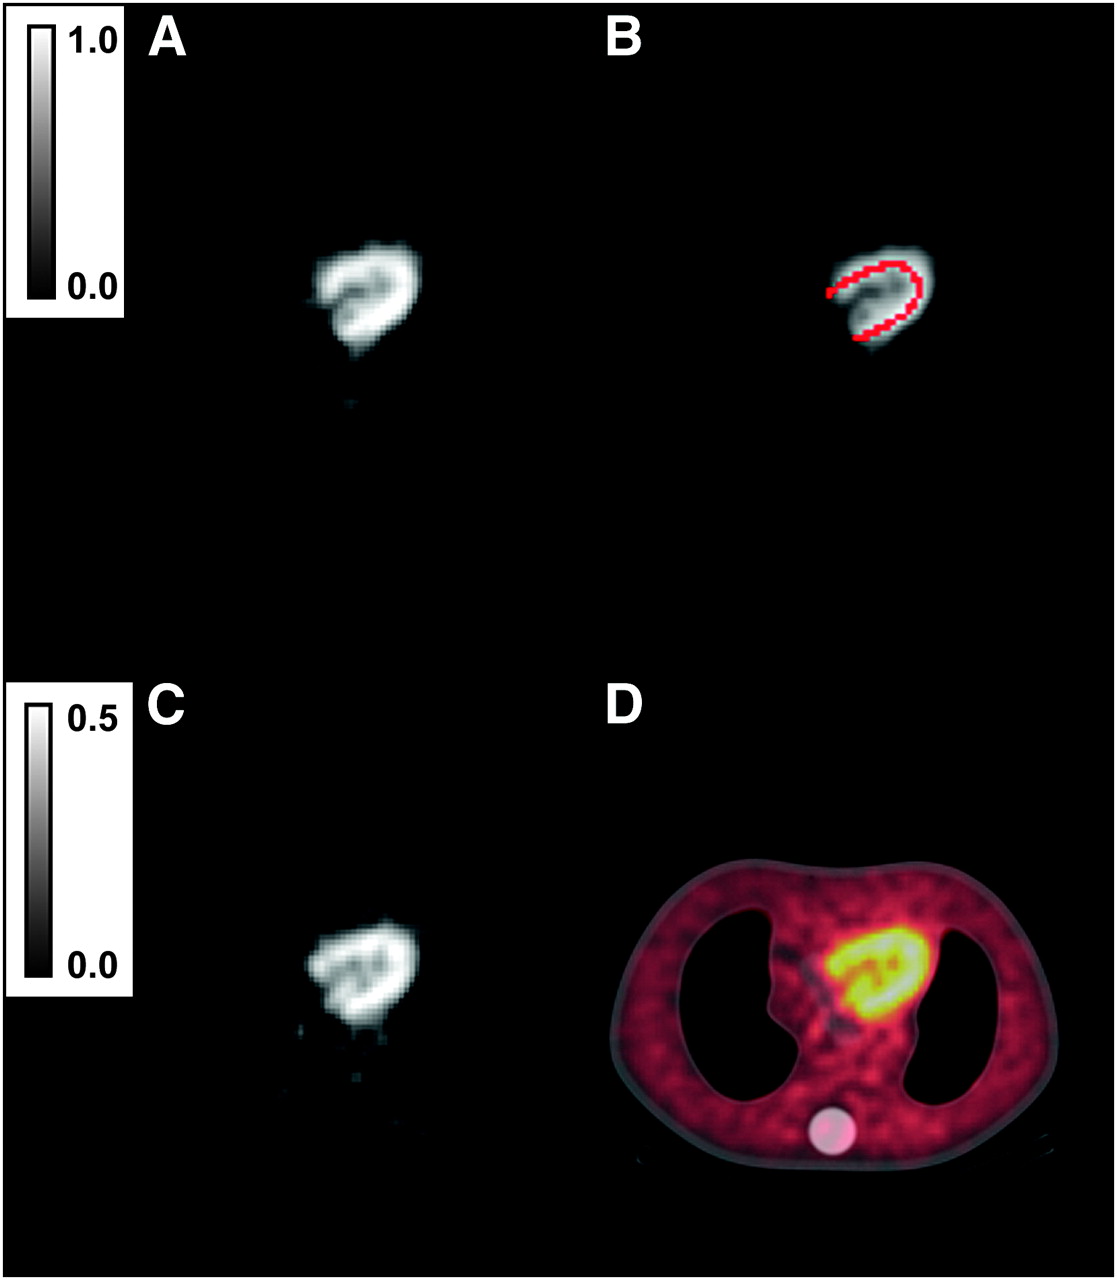
To demonstrate the application of our phantom, we performed a simple study on the influence of noise levels on the accuracy and precision of the tomographic reconstruction. Twenty noise realizations of the sinogram were created, each corresponding to 1 slice through the heart region of the phantom. The high-noise sinogram had 120 projections over 360° and corresponded to the following static activities: 1.14, 0.228, and 0.114 MBq·s/cm3 for myocardium, blood pool, and background, respectively. Also, 20 low-noise sinograms that corresponded to compartment activities 2 times higher were created. The sinograms were reconstructed in 2 dimensions using 1,000 iterations of the MLEM algorithm with attenuation correction. Reconstructed images were smoothed using a Gaussian filter of 4 pixels in full width at half maximum.
To quantitatively assess the reconstruction accuracy, we had to calibrate the reconstructions; that is, we had to determine the relationship between a pixel value in the reconstructed image and the true activity in that pixel. We made that determination by reconstructing a low-noise (41 MBq·s/cm3 activity in the compartment, 830,000 counts in the sinogram) 2-dimensional sinogram of the liver compartment and determining the average pixel value over the reconstructed liver compartment volume. This value, divided by the activity in the liver compartment for which the sinogram was created, served as a calibration constant, C. To convert any reconstructed pixel value to its true activity, the pixel value was divided by C. The limitations of this calibration method are described in the “Discussion.”
The myocardial region of interest (ROI) comprised 45 pixels in the investigated slice and was based on the CT image of the phantom. The ROI is presented in Figure 5. For each reconstruction, the average value of the reconstructed activity in this ROI was AROI. From the 20 noise realizations, we also obtained a sample average,  , and its SD, SROI, calculated over these noise realizations. Thus, 2 figures of merit were used: relative error, E (100%
 ), and coefficient of variation, D (100% SROI/A), where A is the true activity in the myocardium.

(A) Low-noise slice reconstructed with attenuation correction using 1,000 iterations of MLEM followed by application of a Gaussian filter of 4 pixels in full width at half maximum. (B) Same reconstructed image with ROI marked in red. (C) Attenuation-corrected reconstruction of high-noise sinogram. (D) Fusion of that image with corresponding CT slice of phantom (also used as attenuation map). Color bars are calibrated in MBq·s/cm3.
RESULTS
The results are illustrated in Figures 4–6⇑. Figure 4 presents CT scans and the corresponding static and dynamic sinograms for 2 slices of the phantom: 1 in the heart region and 1 in the liver region.

Relationship between total activity in phantom and observed total counting rate summed for both detectors. Each point is plotted with error bars corresponding to SD. No dead-time effects can be seen for this range of counting rates.
Figure 5 presents images reconstructed using MLEM from sinograms extracted from the database. We obtained values of E = 38.89% and 41.07% with D = 4.44% and 6.10% for low and high noise, respectively. The relative error was high—40%—probably because of finite resolution effects resulting in underestimation of myocardial activity.
Figure 6 presents the plot of counting rate versus activity in the phantom. We found a good linear relationship justifying freedom to add projections, without concern about effects due to dead time, in counting rates of less than 60,000 counts per second.
DISCUSSION
There are several aspects of this work that we would like to discuss and emphasize. First, we believe that our approach will be useful for many researchers. It may save time for those who want to test research concepts and need data acquired from physical phantoms. Certainly, acquisition of phantom data is a time- and resource-consuming task. With the use of standard phantoms, scans must be performed every time data are needed for different acquisition parameters. In our approach, one needs to acquire the database only once and then can create from that database subsequent sinograms that correspond to different acquisition parameters, including numbers and configurations of detector heads, numbers of projections, matrix sizes, acquisition speeds, numbers and activity levels of phantom compartments, and numbers of noise realizations. A slight disadvantage to our approach is the lengthy time needed to acquire the database. About 1 full day is required for acquisition of each phantom compartment. However, considering that once the database is created one will not need to use the phantom again, we believe that the long acquisition time is a minor disadvantage. Also, sharing of the phantom database between researchers is a possibility.
Besides the convenience of our approach, it can simulate dynamic uptake and washout—a capability that commercially available physical phantoms lack. The custom-built dynamic physical phantom described by Celler at al. (4) involved a complex hardware design and assembly and could simulate limited dynamics in 3 nonphysiologic compartments. In our approach, sinograms that correspond to dynamic uptake specified by time–activity curves can be generated, and the user has the freedom to specify the dynamics for the activity in the compartments. In particular, dynamics that correspond to compartmental modeling of the uptake and washout can easily be used. The ability to create phantom data with dynamic changes during the acquisition is important for evaluating tomographic reconstruction methods of inconsistent projection data (5,6). This ability is also helpful for testing reconstruction methods that estimate kinematic parameters from projections (7).
The method can be applied to research the difficult problem of SPECT quantitation. For example, in this work we found quantitative error to be about 40% in reconstructions of activity in the myocardium. This error was likely due to a lack of resolution recovery in the reconstruction algorithm. Using our phantom, the improvement in quantitation could easily be studied by incorporating resolution recovery into the MLEM algorithm. The significant advantage of our method for absolute quantitation is the availability of CT, which provides high-resolution images of the structure of the phantom. By assigning known activities to different compartments seen in a CT image, one can obtain a high-resolution image of the true activity.
The relationship between a reconstructed pixel value and the corresponding activity, in MBq·s/cm3, of this pixel is important where quantitation is concerned. In the example presented in this paper, we found this relationship by taking the simple approach of reconstructing a uniform object with known activity. This known activity divided by the average reconstructed pixel value was used as a scaling constant, C, to convert pixel values to activity. This approach is limited because Compton scatter strongly influences the accuracy of estimations of C, and the spatial distribution of Compton scatter in the reconstructed images would be different for every compartment. In the example presented here, C was calculated using just a liver compartment but was applied to the scaling of the entire image. Another limitation of estimating C is that, for the purpose of the estimation, C is assumed to have the same value for the entire reconstructed volume, which it does not. Other approaches need to be investigated. For example, C may have to be estimated separately for every compartment. We plan to investigate these issues in future work.
In our current implementation, we did not include the possibility of creating sinograms that correspond to lesions in the myocardium. However, this will be an important application of the phantom. Simply by replacing the myocardial compartments with 2 new compartments that correspond to healthy cardiac tissue and a lesion, one can use our phantom to study lesion detectability versus noise, reconstruction, contrast between lesion and tissue, and different dynamics in the lesion and myocardium. We plan to add these features to the database and make the phantom available to the public. The interested reader is encouraged to visit http://cfi.lbl.gov/∼asitek/phantom to register.
Although in this work we used a database of short projections, a similar approach can be taken with each compartment acquired in list mode. This work concentrated on SPECT; however, a similar approach can be used in PET. For example, different compartments of a phantom can be separately acquired in list mode and then combined in a manner similar to that presented in this work for SPECT. For PET, however, the amount of random coincidences in the data when compartments are acquired separately and then added will be different from that when compartments are acquired together. The effect of this difference on accuracy needs to be investigated in order to use this approach for PET.
CONCLUSION
We developed a method of generating SPECT physical phantom data from a database of short projections physically acquired on a scanner. Multiple realizations of static and dynamic sinograms that correspond to various acquisition parameters can be created from the database without the need for a separate acquisition for each set of parameters.
Acknowledgments
We thank Sean Webb for editing the manuscript. This work was supported in part by grants R01HL50663, R01EB00121, and R01HL71253 from the National Institutes of Health (NIH) and by the U.S. Department of Energy (DOE) under contract DE-AC02-05CH11231. The contents of this paper are solely the responsibility of the authors and do not represent the official views of the NIH or the DOE.
Footnotes
-
COPYRIGHT © 2006 by the Society of Nuclear Medicine, Inc.
References
- Received for publication October 5, 2005.
- Accepted for publication March 14, 2006.


Jump to section
Related Articles
Cited By...
- No citing articles found.