


Abstract
The objective of the work reported here was to develop and test automated methods to calculate biodistribution of PET tracers using small-animal PET images. Methods: After developing software that uses visually distinguishable organs and other landmarks on a scan to semiautomatically coregister a digital mouse phantom with a small-animal PET scan, we elastically transformed the phantom to conform to those landmarks in 9 simulated scans and in 18 actual PET scans acquired of 9 mice. Tracer concentrations were automatically calculated in 22 regions of interest (ROIs) reflecting the whole body and 21 individual organs. To assess the accuracy of this approach, we compared the software-measured activities in the ROIs of simulated PET scans with the known activities, and we compared the software-measured activities in the ROIs of real PET scans both with manually established ROI activities in original scan data and with actual radioactivity content in immediately harvested tissues of imaged animals. Results: PET/atlas coregistrations were successfully generated with minimal end-user input, allowing rapid quantification of 22 separate tissue ROIs. The simulated scan analysis found the method to be robust with respect to the overall size and shape of individual animal scans, with average activity values for all organs tested falling within the range of 98% ± 3% of the organ activity measured in the unstretched phantom scan. Standardized uptake values (SUVs) measured from actual PET scans using this semiautomated method correlated reasonably well with radioactivity content measured in harvested organs (median r = 0.94) and compared favorably with conventional SUV correlations with harvested organ data (median r = 0.825). Conclusion: A semiautomated analytic approach involving coregistration of scan-derived images with atlas-type images can be used in small-animal whole-body radiotracer studies to estimate radioactivity concentrations in organs. This approach is rapid and less labor intensive than are traditional methods, without diminishing overall accuracy. Such techniques have the possibility of saving time, effort, and the number of animals needed for such assessments.
The main goal of the work reported here was to develop and test semiautomated methods to estimate rodent radiotracer biodistribution from PET scans. The methods involve image coregistration between actual small-animal PET scans and a predefined digital mouse phantom (digital atlas) morphed to match designated features in the scans.
Software image-registration methods are currently used for various purposes in medical imaging (1,2). Combining images from modalities such as MRI, CT, PET, or SPECT can aid in assessing physiologic function and anatomic boundaries (3) and can be used for planning therapy such as surgical procedures or radiation delivery (4,5). Methods of fusing patient-specific image data with a standard anatomic atlas have so far largely been focused on brain images (6,7). The present work was aimed at the further development and testing of methods for fusing actual PET scans with voxelized phantoms requiring minimal end-user input. Such methods have the potential to be helpful in a wide variety of applications, including facilitation of radiation dosimetry measurements, pharmacokinetic compartmental modeling, and implementation of certain image-processing techniques.
By coregistering a digital mouse phantom with a small-animal PET image of a mouse, one can couple general anatomic information with animal-specific information in assessing biodistribution of tracer activity concentrations. Using a variation of Shepard's inverse-distance–weighted method for scattered data interpolations (8), we developed an elastic, feature-based algorithm for aligning corresponding anatomic landmarks, using radioactivity-quantifying data from the PET scan and geometric data from the digital phantom. The methods for scan analysis were evaluated by comparing algorithm-calculated activity values with the true values in simulated PET acquisitions of multishaped digitized phantoms. The algorithm-calculated values were also compared with activity distributions determined by analyzing manual regions of interest (ROIs) on animal PET images and with activity distributions determined by measuring the radioactivity content of tissues harvested from these animals immediately after imaging.
MATERIALS AND METHODS
A program was developed on a PC-based platform to allow rapid calculation of tracer activity biodistribution after fusion of a 3-dimensional MOBY digital mouse phantom developed by William P. Segars (Johns Hopkins Medical Institutions) (9) with small-animal PET mouse volumes (Fig. 1). In operating the program, the end user is initially asked to semiautomatically define as many organs as possible on the small-animal PET scan, using a method in which the user selects threshold intensities and scan-smoothing values for each otherwise-automated ROI rendering. This whole process takes a few seconds for each organ. When each organ is defined, it is overlaid with a characterizing 3-dimensional grid (Fig. 1) based on an explicit dimensional-integration center-of-mass weighting method we developed (Fig. 2). These points act as landmarks within the small-animal PET scan and correspond to similar predefined landmarks in the digital phantom. The 2 images are essentially “pinned together” at these common points. Although it is possible to use more grid points to define each organ, in initial pilot runs of the program a grid of 15 points was sufficient for delineating the general size and shape of most organs and represented a practical compromise to avoid unduly slowing the algorithm.

Digitized mouse models illustrating image fusion process. (A) PET volume (left) and digital phantom volume (right) to be fused together (as 2-dimensional projectional views). Overlaid on images are points delineating organ volume grids for several organs (in 2-dimensional view, only 9 of 15 points used per organ are visible). Points in these grids define parameters used in transformation of the phantom matrix when fusing it to PET scan. Organs are defined by user, whereas a set of points is automatically defined at tip of head (shown in orange) at the most rostral boundary of whole-body ROI, to ensure proper rostral-caudal stretching. (B) Spatial warping applied to grid in phantom space (right) when fused to PET space (left) for a given slice. (C) Fusion of stretched phantom coregistered with PET scan.

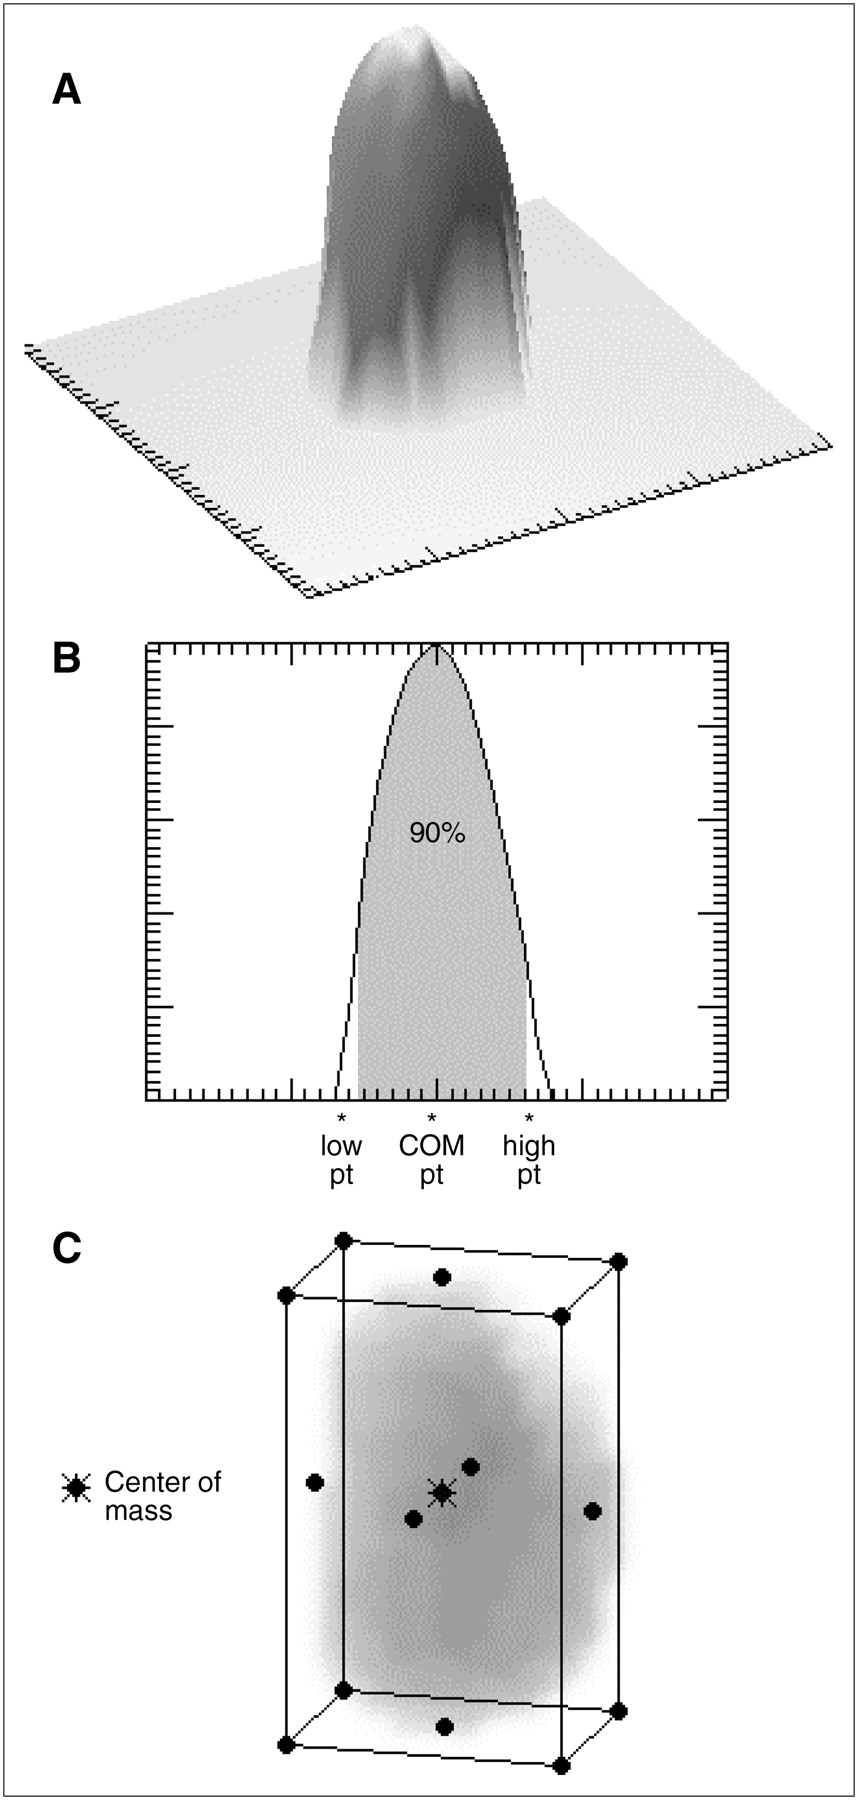
Methods of defining landmark points for representing an ROI. Three-dimensional object (for this example, kidney) is first spatially integrated over 1 dimension (A) and then integrated a second time over a second dimension, yielding 1-dimensional volume distribution (B). Center of mass point is defined at center of this distribution. Dimensional high and low points are defined at each end of distribution so as to leave 5% of volume outside these bounds on each side. These 3 points represent volume in 1 dimension. This process is repeated for each of 3 spatial dimensions. From these points, an overlying grid encasing the ROI is constructed (C). Corners of grid are defined by dimensional high–low boundaries, and additional landmark points are placed at center of mass and its orthogonal projections on each face of rectangular grid. COM = center of mass; pt = point.
A representation of these points of definition can be seen in Figure 1A. The actual fusion process consists of 2 further steps. First, the phantom is stretched in the anterior–posterior and left–right directions to best match the dimensions of the actual PET scan. No explicit rostral–caudal stretching is introduced because of complications arising from variations in the extent to which the animal is inside the scanning field of view. However, stretching in this dimension occurs implicitly when landmark points are defined at the rostral and caudal ends of the scan (e.g., the head and the kidneys, respectively). Second, 2 sets of n landmark points pi and qi (where p represents the defined points on the phantom, q represents the defined points on the scan, and i = 1,…,n) are generated in two 3-dimensional image representations. The 2 sets can be used to make a new set of n landmark shift vectors r, representing the shifts necessary to apply to the phantom landmark points to map them on top of the scan:
The algorithm will then iterate through all the points ck in the phantom (where k = 1,…,m; m = number of voxels in phantom) and calculate a displacement vector dk for each point. The displacement vector for each point is created as a combination of all n landmark shift vectors, with the shift vectors that are nearer point ck influencing its displacement vector more: where
where  is the weighting factor controlling the influence of each landmark shift vector for a particular point ck and is based on the distance between the 3-dimensional point coordinates (ckx, cky, ckz) and the coordinates of the phantom landmark points (pix, piy, piz). The
  values are calculated as
Displacement vectors are rounded to integer values for each dimension, thus originating and terminating at the center of a voxel (rounding error is assumed negligible because voxel dimensions are less than the resolution of the scanner). Once the displacement vectors are calculated, every voxel can be translated from the phantom space to the PET space by its displacement vector. Figure 1B illustrates a grid being stretched and warped in the phantom space by this method. Completing this process will create a transformation map between the PET space and the phantom space. All the tissue- and organ-specific voxels in the phantom space are then projected into the PET space and assigned a tissue type in the PET volume at each voxel. A relatively small number of voxels not assigned a tissue type in the PET space because of undersampling along the most stretched portions of the warped phantom are assigned the values of the tissue type most representative among the immediately adjacent voxels.
From the fused PET/phantom images, corresponding PET information is assigned to each phantom organ. The software also allows the user to visually inspect the image coregistration as a quality control measure. Figure 1C provides a graphic representation of the fused volumes.
To explore the accuracy of this image coregistration approach, we examined the PET activity measurements it generated using, first, simulated PET acquisitions of digital mice of different shapes and sizes and, second, biodistributions determined through traditional analysis of 9 actual small-animal PET scans, as well as data acquired from the immediate harvesting of mouse organs after the scans and the direct measurement of radiotracer content in a well counter.
For the first comparison, we evaluated how accurately the approach could be used to calculate activity distributions in digital phantoms of varying dimensions with predetermined biodistributions. Using the MOBY phantom software (9), we generated several such phantoms. We measured the lengths, in each of 3 dimensions, of the 9 mice that were later scanned with small-animal PET. We then determined the average lengths and their SDs and generated 9 phantoms within a range of body dimensions representing these average dimension lengths ± 2 SDs (Table 1). Once the phantoms were generated, 2-dimensional PET acquisitions were simulated from each. Axial slices were forward projected into sinograms, convolved with a 1.8-mm blurring kernel, adjusted to model the effects of Poisson noise (total image counts scaled to 1.2 × 10⁷ trues), and then reconstructed using filtered backprojection and a ramp filter. Attenuation was considered corrected for and not modeled.
Radioactivity Concentration Measurements for 9 Simulated Small-Animal PET Acquisitions
This process was performed for the 9 generated digital phantoms of varying sizes, plus once more for the unstretched phantom used as the digital atlas. After repeating this simulation process for the digital atlas (which was initially assigned the same uniform radioactivity concentrations per tissue type as for the set of 9 digital phantoms), we were able to measure the degree of lost accuracy that was due solely to the blurring and noise introduced in the simulation of the PET acquisition and not to the fusion process, because no elastic transformation step was required in conjunction with that simulation.
Second, we looked at 9 actual small-animal PET scans and compared the standardized uptake values (SUVs, quantifying tracer concentration in each organ) based on ROIs defined by the software program (sSUV) with the SUVs based on manually defined ROIs (mSUV). In both cases, SUVs were calculated relative to measured whole-body tracer concentrations as follows: sSUV = radioactivity concentration in software-defined organ ROI/radioactivity concentration whole-body volume; mSUV = radioactivity concentration in manually defined organ ROI/radioactivity concentration whole-body volume. SUV ratios were used as the unit of comparison because this has been the most common ratio unit used in published PET studies.
As a criterion standard, the SUVs derived from these images were compared with an analogous unit (hSUV) derived by using a well counter to measure the actual radioactivity content of organs harvested from animals immediately on completion of imaging (hSUV, or radioactivity concentration measured in harvested organ/average radioactivity concentration in all harvested tissues), as previously described (10). For these studies, 9 mice that had not been kept fasting were imaged twice in a small-animal PET scanner from the tip of the nose to the caudal extent of the pelvis, as described previously (10): once with 18F-FDG (10–15 MBq) and once with 18F-fluorocyclophosphamide (15 MBq synthesized as recently described (11)). The 2 scans were acquired within 1 wk of each other using radiotracers having different routes of excretion, in order to identify as many organs as possible. The actual radioactivity concentrations reported here are those associated with the 18F-fluorocyclophosphamide tracer.
RESULTS
As a first test of the coregistration implemented in our PET biodistribution software program, we studied 9 simulated PET acquisitions of mice of varying dimensions. Tables 1 and 2 represent the data from the calculated organ activities measured for the 9 simulated mouse scans, and their variance, along with the activity measured in the simulated scan of the atlas phantom. The data in Table 1 are represented as ratio of organ activity measured in each simulated scan to organ activity measured in the simulated atlas phantom scan. The average activity for each organ fell within the range 0.98 ± 0.03. The known organ activities (i.e., before application of the blurring kernel and reconstruction algorithms), in arbitrary units, were set proportional to those found in typical mouse 18F-FDG scans, with activities in relatively low-concentrating organs set to 100.0. A generally close correspondence existed between the values measured in the simulated scan set and those measured in the simulated atlas phantom scan, with comparable activity losses occurring in both (before application of any recovery coefficient factor), relative to the known activities.
Activity Concentrations Measured by Software Program for Simulated Scans of 9 Digital Mouse Phantoms and Original Atlas Phantom
The next test involved calculating organ SUVs in actual mouse scans. Table 3 provides Pearson correlation coefficients and associated P values for each of the SUV definition methods relative to the values obtained from harvesting of organs (heart, brain, lungs, liver, spleen, large intestines, and kidneys). Correlation coefficients for the sSUV versus hSUV measurements were higher in 7 of the 9 mice (median r = 0.943, with a range of 0.483–0.999) than were those for the mSUV versus hSUV measurements (median r = 0.825, with a range of 0.083–0.992), indicating that data generated with the semiautomated program for calculating mouse organ activities from small-animal PET correlated well with harvested data and compared favorably with data generated by manual ROI analysis of the same images. We also evaluated how well the image-based SUVs correlated with hSUVs across the mouse scans on an organ-by-organ basis, as shown in Figure 3 and Table 4. Some organs (e.g., lungs and liver) contributed to the improved correlation more than others did (e.g., brain and kidneys). Overall, the correlation coefficients were higher for sSUV versus hSUV measurements than for mSUV versus hSUV measurements for 6 of the 7 organs examined. The spleen correlation with hSUV values was poor using either image-based method (possibly because of its relatively high blood content in images, lost with harvesting) but was worse for sSUVs.
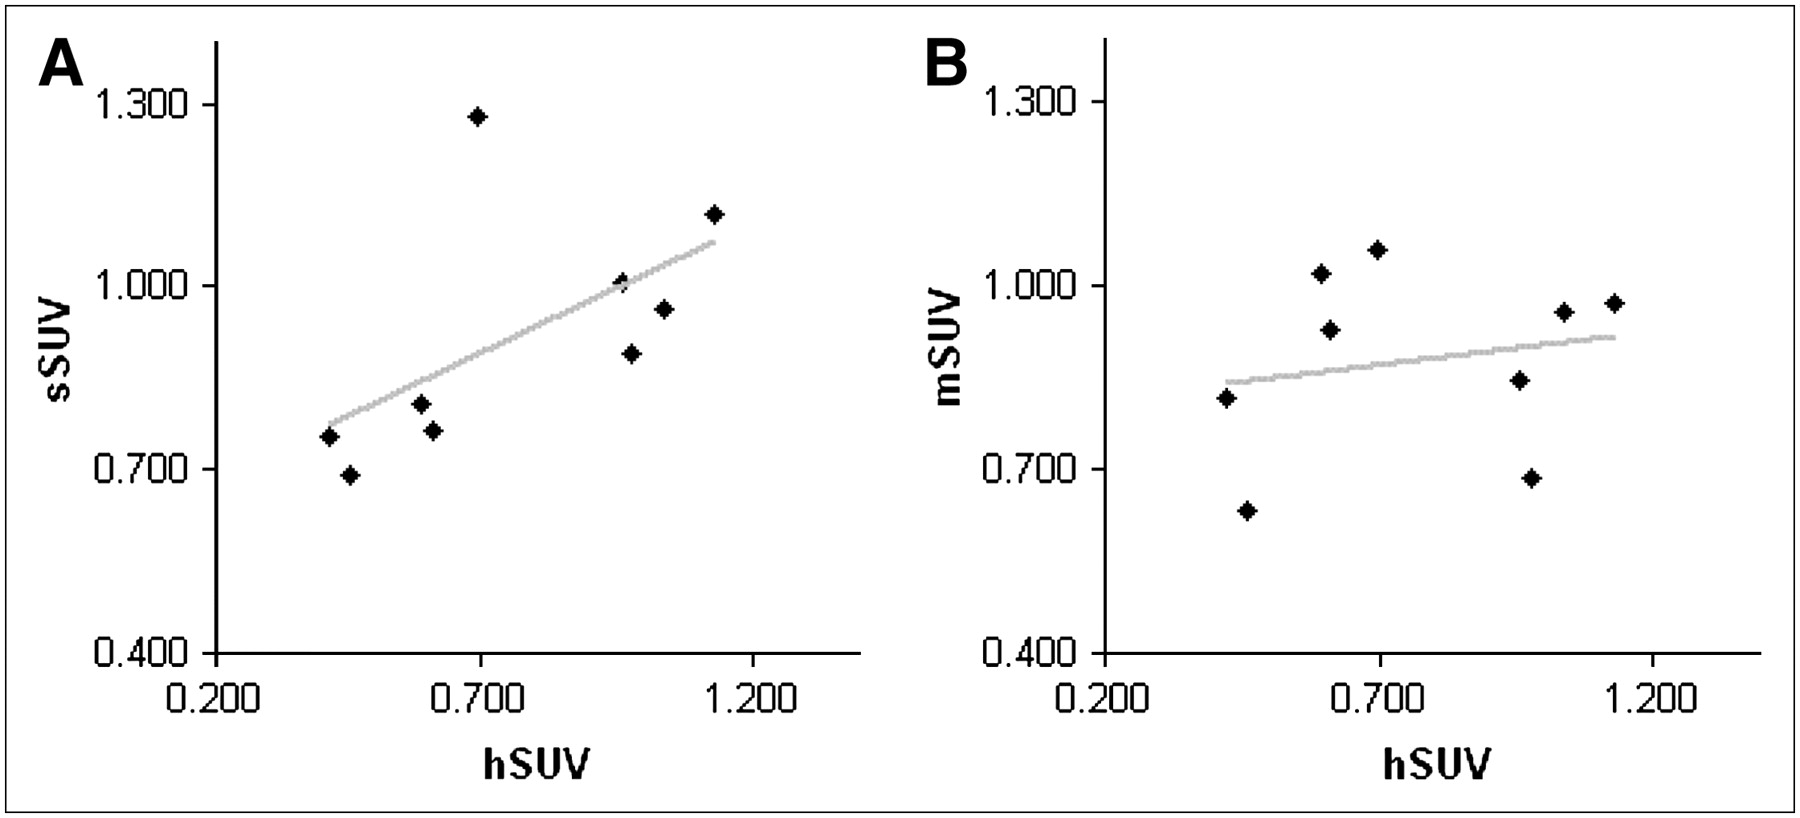
Comparison of SUV measurement methods for liver in the 9 mice. sSUV (A) and mSUV (B) measurements are shown relative to hSUV measurements (considered the criterion standard). Regression lines are shown in gray.
Correlation Coefficients and Associated P Values for sSUV or mSUV vs. hSUV
Correlation Coefficients for Comparison of SUV Methods with Harvested Organ Data Across All Mice
DISCUSSION
We approached the analysis of PET data through using a coregistered digital mouse atlas phantom applied to small-animal PET mouse scans, generating predefined ROIs to be overlaid on the actual images. After image coregistration, a complete set of 22 organ ROIs could rapidly be defined, including those that were not manually definable on the original PET image. This semiautomated approach requires 2–5 min of human interaction (for organ definition) and 4–6 min for computer processing (using a 3.4-GHz Pentium 4 processor; Intel Corp.). Thus, a researcher, in about 10 min, can evaluate a small-animal PET mouse scan and obtain biodistribution and time–activity data for 22 organs in each animal.
In assessing the robustness of the image coregistration method per se, we compared activity measurements from 9 simulated PET scans of mice of varying x, y, and z dimensions with measurements from a simulated scan of a (nonstretched) atlas. These data, displayed in ratio form in Table 1, are quite close to unity (mean, 0.99; SD, 0.02), indicating that the program performs well over a typically varying range of mouse dimensions.
Compared with the criterion standard of harvested organ data derived from 9 mice, sSUV data correlated favorably relative to mSUV data (Tables 3 and 4; Fig. 3). The scans associated with the most affected datasets (e.g., of mouse 1 and mouse 6) tended to be of relatively lower image quality, likely making accurate ROI definitions especially difficult manually. Because the sSUV method was less perturbed by this tendency, it permitted reasonably accurate ROI measurements for those scans. This reflects the fact that, with the image fusion process of the sSUV method, every pixel mapped on the small-animal PET scan is influenced by many other points of information and that the definition of the individual organ ROIs with this method is thus less critically affected by individual organ uptake levels. A potential advantage of this approach, then, is that it allows a reasonable estimation of organ radioactivity contents even for images in which scan quality or target-to-background ratios are not conducive to precise manual definition of organ ROIs.
The image transformation and coregistration aspects of this work used a method adapted from Shepard's inverse-distance–weighted interpolation function (8). In our implementation, the tissue values from the digital phantom were projected into the PET space. Alternatively, the projections could have been calculated from the PET space into the phantom space. That approach has the advantage of avoiding the lack of an initial atlas-based tissue assignment for some PET pixels due to the undersampling effect described in the “Materials and Methods.” When we tested that approach, however, the processing time increased, and both approaches yielded similar measurements, affecting less than 1% of the pixels in each scan.
Many alternative methods of achieving generalized image coregistration have been published and can be explored in future work. Projectional (12) and bilinear mapping (13) algorithms, spline-based algorithms (14–16), and mutual information–based algorithms (17) are a few such methods. Algorithms have been compared in several studies (18–21), which generally concluded (not surprisingly) that different methods perform better under different circumstances. Our work used a landmark-based function because PET is a relatively low-resolution imaging modality, particularly for features having a minimal accumulation of tracer above background level, and thus is well suited to a distance-weighted-interpolation-function approach that maximizes the use of the most well-defined regions in each scan.
The establishment of procedures to facilitate analysis of small-animal PET, as well as human PET, could prove useful in many areas. The assignment of voxels within a PET scan to specific tissue types provides a platform for dosimetric calculations and, potentially, for achieving rapid, patient-specific dosimetry. Better scan analysis techniques can also play a role in new radiotracer development, with the possibility of taking advantage of image-based measurements in animals to replace some of the invasive measurements currently performed, thus speeding up initial testing and reducing the number of animals needed for such purposes.
CONCLUSION
The main goal of this work was to develop and test semiautomated methods of coregistering a digital mouse phantom image with a small-animal PET image to be used in the calculation of activity distributions in PET mouse scans. Using these methods, we have been able to calculate radioactivity distributions that are at least as accurate as those obtained using conventional ROI analyses, with minimal end-user input. The coregistration of images not only helps with PET activity calculations but also provides a 3-dimensional voxelized tissue-based model of the individual animal. Such data have the potential to aid in many applications of image analysis, including radiation dosimetry calculations, new tracer development, compartmental modeling, attenuation correction, and image deconvolution.
Footnotes
-
Guest Editor: Sanjiv Gambhir
-
COPYRIGHT © 2006 by the Society of Nuclear Medicine, Inc.
References
- Received for publication August 2, 2005.
- Accepted for publication March 27, 2006.


Jump to section
Related Articles
Cited By...
- No citing articles found.