


Abstract
Our objective was to develop and evaluate 3 semiautomatic computer-aided diagnostic (CAD) schemes for distinguishing between benign and malignant pulmonary nodules by use of features extracted from CT, 18F-FDG PET, and both CT and 18F-FDG PET. Methods: We retrospectively collected 92 consecutive cases of pulmonary nodules (<3 cm) in patients who underwent both thoracic CT and whole-body PET/CT. Forty-two of the nodules were malignant and 50 benign, as confirmed by pathologic examination and clinical follow-up. The interval between CT and PET was less than 1 mo. Four clinical parameters, including patient age, sex, smoking status, and history of previous malignancy, were used for the CAD schemes. Sixteen CT features based on size, shape, margin, and internal structure of nodules were independently rated subjectively by 2 chest radiologists. Four PET features were viewed on a PET/CT workstation. CAD schemes based on clinical parameters together with CT features, PET features, and both CT and PET features were then used to differentiate benign from malignant nodules. Finally, the output from the CAD schemes was evaluated by use of receiver-operating-characteristic analysis. Results: When we used clinical parameters and CT features as input units (CAD scheme 1), the area under the receiver-operating-characteristic curve (Az value) of the CAD scheme was 0.83. When we used clinical parameters and PET features as input units (CAD scheme 2), the Az value for the computer output was 0.91. However, when we used all data as input units (CAD scheme 3), the Az value for the computer output was 0.95. The performance of CAD scheme 3 was better than that of CAD scheme 1 or 2. A statistically significant difference existed between the Az values of CAD schemes 3 and 2 (P = 0.037) and between those of CAD schemes 3 and 1 (P = 0.015). Conclusion: Our CAD scheme based on both PET and CT was better able to differentiate benign from malignant pulmonary nodules than were the CAD schemes based on PET alone and CT alone.
The diagnosis of small pulmonary nodules remains a difficult task for radiologists despite rapid advancement in the development of various diagnostic imaging modalities. CT and 18F-FDG PET are 2 major noninvasive methods used for examining pulmonary nodules (1). Thoracic CT, which is the most commonly used imaging modality for evaluating pulmonary nodules, has a sensitivity ranging from 95% to 100% and a specificity ranging from 56% to 93% (1,2). PET can generate functional images of tumor tissues based on the increased glucose metabolism of tumor cells. Numerous studies have shown that PET is effective for differentiating between benign and malignant pulmonary nodules, and several reports have suggested that examination with PET can reduce the number of patients with indeterminate nodules who undergo unnecessary thoracotomy (2–5). Unfortunately, PET alone is not specific in all cases, nor is it sensitive in all cases, particularly if a nodule is small or is a low-grade tumor (6–9). We expected that the diagnostic accuracy for pulmonary nodules could be improved by use of information obtained from both CT and PET.
The artificial neural network (ANN) is a powerful tool for decision making when there is a large amount of information. ANNs have been used extensively in recent years in the field of computer-aided diagnosis (CAD) of pulmonary nodules, interstitial lung disease in chest radiography and CT, and breast cancer in mammography (10–14). The performance of an ANN in differentiating between benign and malignant nodules, by taking into account clinical parameters and radiologic findings on high-resolution CT, has been reported to be superior to that of radiologists (14). However, to our knowledge, no reports have been published on the use of ANNs for differentiating between benign and malignant pulmonary nodules on the basis of information from both CT and PET. Our purpose in this study was to develop and evaluate 3 CAD schemes based on an ANN for distinguishing between benign and malignant pulmonary nodules by use of clinical information and image features extracted from CT alone, 18F-FDG PET alone, and both CT and PET.
MATERIALS AND METHODS
Case Selection
We collected 92 consecutive cases of solitary pulmonary nodules in patients who—for categorization of the malignant potential of the nodule—underwent PET/CT and chest CT between January 2004 and May 2005. The interval between CT and PET/CT was less than 1 mo. Our institutional review board, which waived the requirement for patient consent, approved the study. As shown in Table 1, there were 42 malignant and 50 benign nodules. All malignant nodules were confirmed by pathologic examination (17 adenocarcinomas, 12 squamous cell carcinomas, 9 non–small cell lung carcinomas [nonspecific], 2 metastatic lung tumors, 1 bronchoalveolar carcinoma, and 1 adenosquamous carcinoma). Among the 50 benign nodules, 9 were confirmed by pathologic examination (6 noncaseating granulomas, 2 cases of organizing pneumonia, and 1 hamartoma), and 41 were confirmed by either a decrease in size or lack of growth over a 2-y period on serial prior chest CT examinations. Nodules showing benign calcification patterns (central, laminated, diffuse, popcorn) or obvious fat on CT were excluded from this study.
Clinical Information and Pulmonary Nodule Characteristics for Database Used in This Study
CT images were obtained on either a 40-slice (Philips) or 16-slice (GE Healthcare) scanner. Routine scanning of the whole lung (120 kVp, 150 mA) was performed by use of the helical mode with a 3- or 5-mm-thick reconstruction. Images were reconstructed with a standard algorithm and a lung algorithm. All scans were obtained with the patients supine and at end inspiration. The images were transferred from the PACS and were reviewed with DicomWorks software on liquid-crystal display monitors.
The PET images were obtained with a PET/CT scanner (Reveal HD; CTI) that included high-resolution bismuth germanate detectors and a dual-slice CT scanner. The patients fasted for at least 4 h before intravenous administration of 370−555 MBq of 18F-FDG. In addition, all patients' serum glucose levels were tested via finger stick sampling before injection and found to be less than 200 mg/dL. Whole-body unenhanced CT was performed first for PET attenuation correction. Then, a whole-body static PET scan was acquired 60 min after injection of 18F-FDG for about 30 min, starting at the thighs and proceeding to the head. PET scans were obtained with an acquisition time of 5 min per cradle position, with a slice overlap at the borders of the field of view to avoid artifacts. PET images were reconstructed using ordered-subsets expectation maximization iterative algorithms with 8 subsets, 2 iterations, and 128 × 128 pixels. The slice thickness was 5 mm, with gaussian smoothing after reconstruction. We used 3-dimensional imaging mode with Fourier rebinning and analytic scatter correction for attenuation correction. The PET camera has a 14.6-cm axial field of view.
Feature Extraction
We recorded each patient's clinical information and CT and PET findings. The clinical parameters for each patient included age, sex, smoking status, and history of previous malignancy as determined from medical records. Subjective ratings for 16 CT findings were provided independently by 2 chest radiologists with 12 y and 18 y of experience in chest radiology who were unaware of the final diagnosis. They indicated a score of between 0 and 10 on a sheet for each CT finding, as shown in Table 2 (14). The nodule size was calculated by use of the mean of the long- and short-axis diameters at the lung window settings in the largest plane. Table 2 also gives an example of a radiologist's subjective rating for a malignant lung nodule.
Definition of Rating Scores and Radiologist's Subjective Rating Scores for the Lung Nodule Shown in Figure 4
The PET features included the maximum standardized uptake value (SUV) of the nodule, pleural effusion, hypermetabolic lymphadenopathy, and hypermetabolic extrathoracic malignancy as shown in Table 2. The nodule SUVs were measured on PET images on a PET/CT Mirada workstation (CTI) by 1 radiologist.
CAD Scheme
A CAD scheme is an automatic or semiautomatic computer system that computes diagnostic information as a second opinion to assist radiologists in the diagnosis of some abnormalities. Our CAD scheme was based on a 3-layer, feed-forward ANN with a back-propagation algorithm developed at the University of Chicago (15,16). We devised 3 CAD schemes by use of features extracted from CT alone, PET alone, and both CT and PET, with the addition of clinical information for all 3 schemes. The CAD scheme for CT was designed with 20 input units (4 clinical parameters and 16 CT findings) and 10 hidden units; the CAD scheme for PET included 8 input units (4 clinical parameters and 4 PET findings) and 4 hidden units; and the CAD scheme for PET and CT included 21 input units (4 clinical parameters, 16 CT findings, and 1 PET finding for nodule SUV) and 10 hidden units. Each of the CAD schemes had 1 output unit indicating the likelihood of malignancy.
Input data obtained from clinical parameters and subjective ratings for CT findings were normalized to the range of 0 to 1. A round-robin (leave-one-out) method was applied for training and testing of the ANN. In this method, all but 1 case in a database were used for training the ANN, and the single case that was left out was then used for testing the trained ANN. This procedure was repeated so that each case in the database was used once as a test case. Output values ranging from 0 to 1 indicated the likelihood of malignancy in each case (0 = definitely benign, 1 = definitely malignant).
Data Analysis
The performance of the CAD schemes for CT, for PET, and for PET and CT was evaluated by receiver-operating-characteristic (ROC) analysis. Binormal ROC curves for distinguishing benign from malignant nodules were estimated by use of the LABROC5 algorithm contained in the ROCKIT software of the University of Chicago (http://xray.bsd.uchicago.edu/cgi-bin/roc_software.cgi). We used LABROC5 to obtain maximum-likelihood estimates of binormal ROC curves from the continuous ordinal-scale rating data (17,18). Areas under the ROC curve (Az values) were calculated to indicate performance in distinguishing benign from malignant nodules. The statistical significance of the difference between Az values was determined by application of a 2-tailed paired t test.
RESULTS
Table 3 shows the median value and interquartile range (i.e., the difference between the 25th and 75th percentiles) for the value of each of 16 features from the CT images. Also shown are the Az values for distinguishing between benign and malignant pulmonary nodules by the use of each feature. Only 2 patients had extrathoracic malignant lesions; therefore, the median value and interquartile range have a value of 0, which is useless and is indicated by “not applicable” in the table.
Median Values, Interquartile Ranges, and Az Values for Distinction Between Benign and Malignant Pulmonary Nodules for 16 CT Features
When we used as input units the 4 clinical parameters and 16 subjective radiologic features extracted from CT alone, the Az value of the CAD scheme (CAD scheme 1) was 0.83. When we used as input units the 4 clinical parameters and 4 PET features, the Az value of the computer output (CAD scheme 2) was 0.91. However, when we used as input units all data, including clinical parameters and radiologic features from CT and PET, the Az value of the computer output (CAD scheme 3) was 0.95. Figure 1 displays the ROC curves obtained with the CAD schemes. The performance of CAD scheme 3 was better than that of CAD scheme 1 or 2. A statistically significant difference existed between the Az values of CAD schemes 3 and 2 (P = 0.037) and between those of CAD schemes 3 and 1 (P = 0.015).
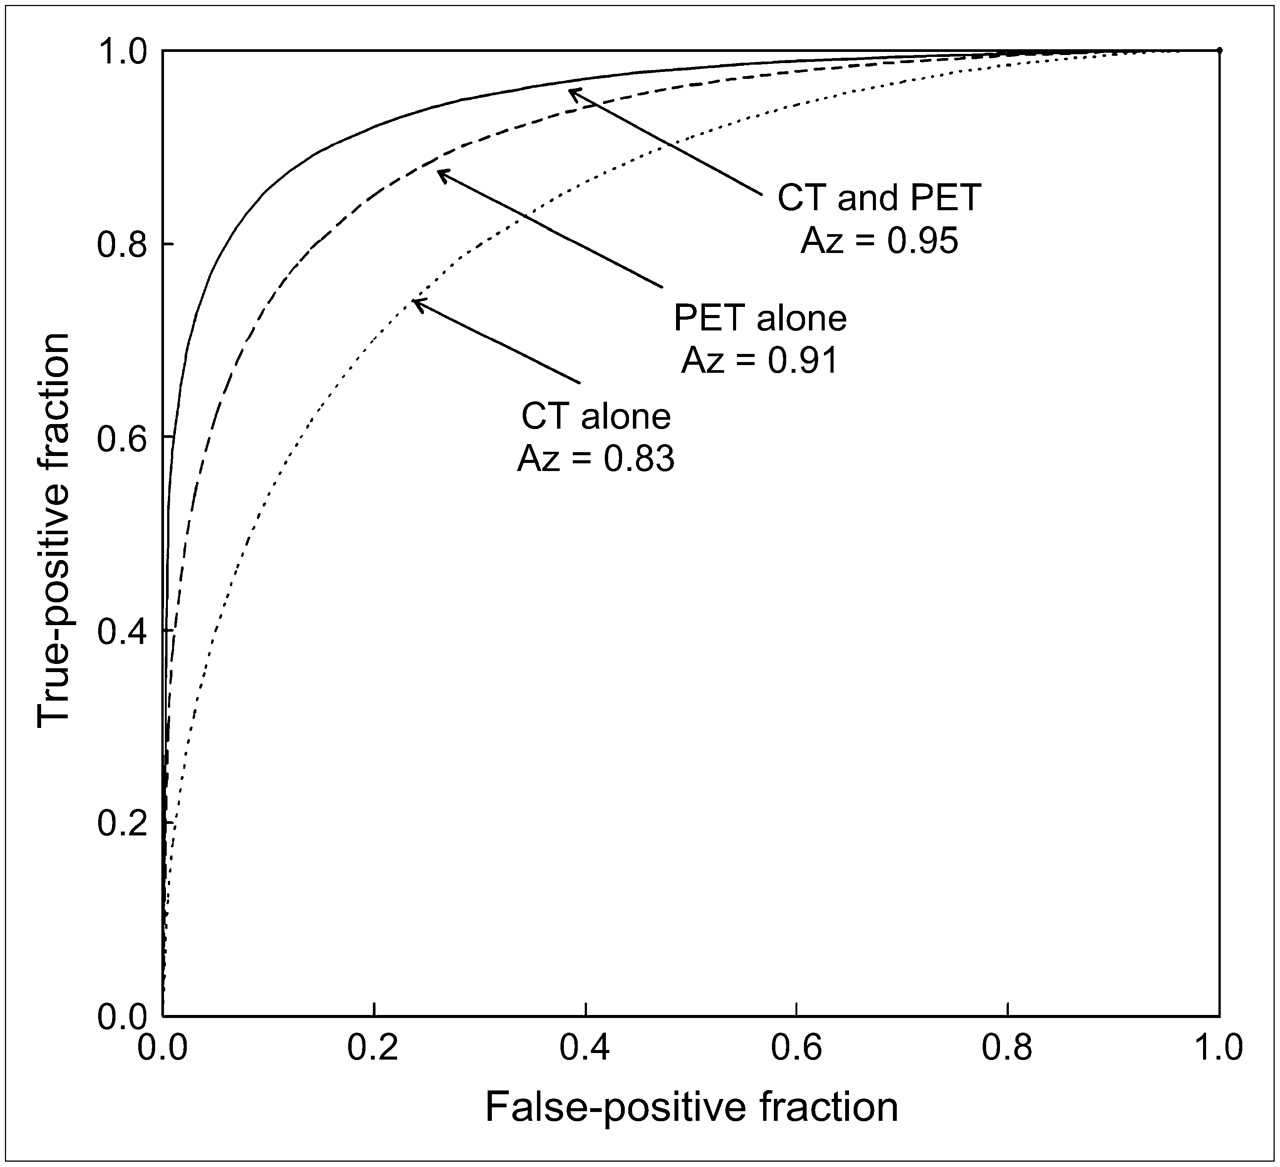
ROC curves for performance of computer outputs based on PET features alone, CT features alone, and both PET and CT features. Statistically significant difference exists between computer output based on both PET and CT and that based on PET alone (P = 0.037) or CT alone (P = 0.015).
We classified all cases into 4 groups according to the magnitude of the change in computer output between CAD schemes 3 and 2. The range of output from the CAD scheme was between 0 and 1. When the change in output values was larger than 0.1, we considered CT features to have had a potential effect on the CAD scheme based on PET alone. As shown in Figure 2, 40 cases (43%) had a potentially beneficial effect and 15 cases (16%) had a potentially detrimental effect from the use of additional CT. The number of cases with a potentially beneficial effect from the additional input of CT features was larger than the number with a potentially detrimental effect.

Number of cases with potentially beneficial and detrimental effects resulting from use of CT features in addition to PET features. Number of cases with beneficial effect is larger than that with detrimental effect.
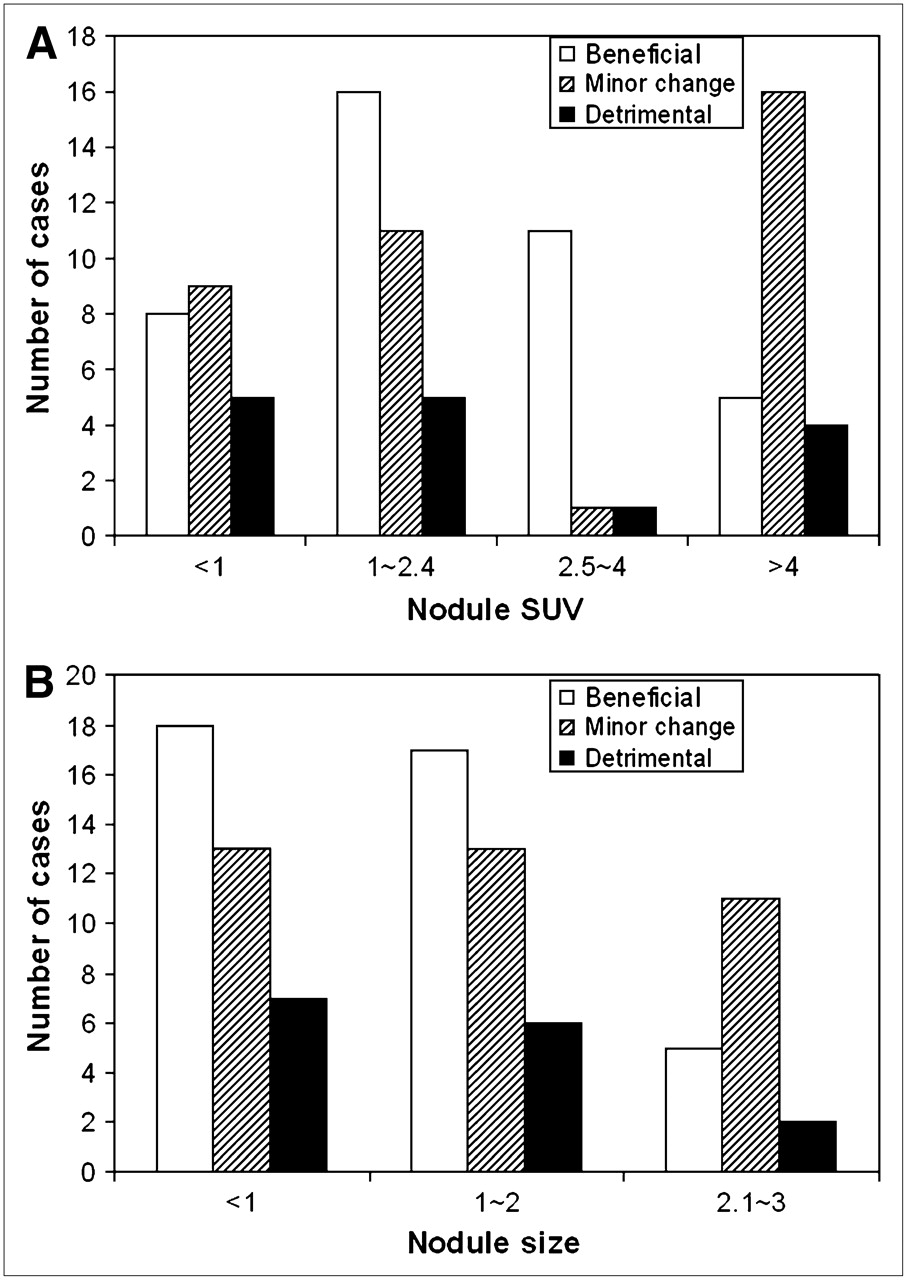
We also classified all nodules into 4 groups according to their SUVs on PET (SUV of ≤1, 1.1–2.4, 2.5–4, or >4). Figure 3A compares the output values of CAD schemes 3 and 2 in these groups. Of the 47 pulmonary nodules with SUVs of less than 1 or more than 4, 25 showed only a minor change between the 2 CAD schemes, indicating that the PET image characteristics played an essential role and that CT contributed relatively little information for the CAD scheme. However, of the 45 nodules with an SUV of between 1 and 4, 27 showed much better performance for CAD scheme 3 than for CAD scheme 2. In only 6 of the 45 were the outputs of CAD scheme 3 worse than those of CAD scheme 2. These facts indicate that CT features contributed significantly to PET SUV in distinguishing between benign and malignant nodules when SUV alone was not effective (between 1 and 4).

Number of cases with potentially beneficial and detrimental changes (>0.1) and with minor changes (<0.1) in computer output resulting from use of PET and additional CT features for 4 groups of nodules by SUV (A) and 3 groups of nodules by size (B). Number of cases with beneficial effects resulting from use of additional CT features was larger than that with detrimental effects, especially when nodule SUV was between 1 and 4 or nodule was smaller than 2 cm.
As shown in Figure 3B, changes in computer output between the 2 CAD schemes were also analyzed for 3 groups classified according to the size of the pulmonary nodules. When a nodule was smaller than 2 cm, the number of cases that showed a potentially beneficial effect with additional CT features was larger than the number that showed a potentially detrimental effect. However, in most cases with a nodule larger than 2 cm, changes were only minor.
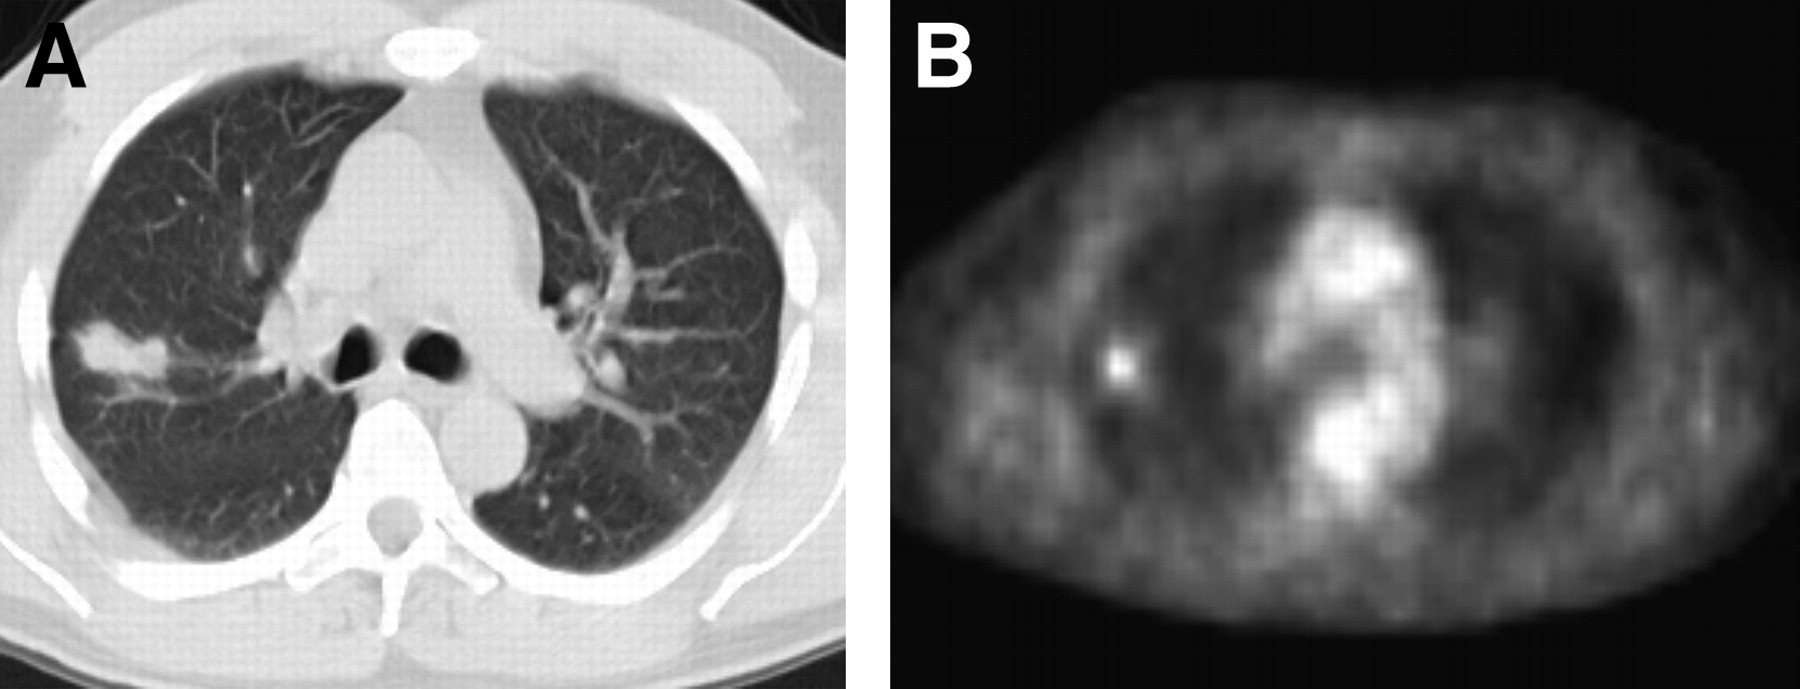
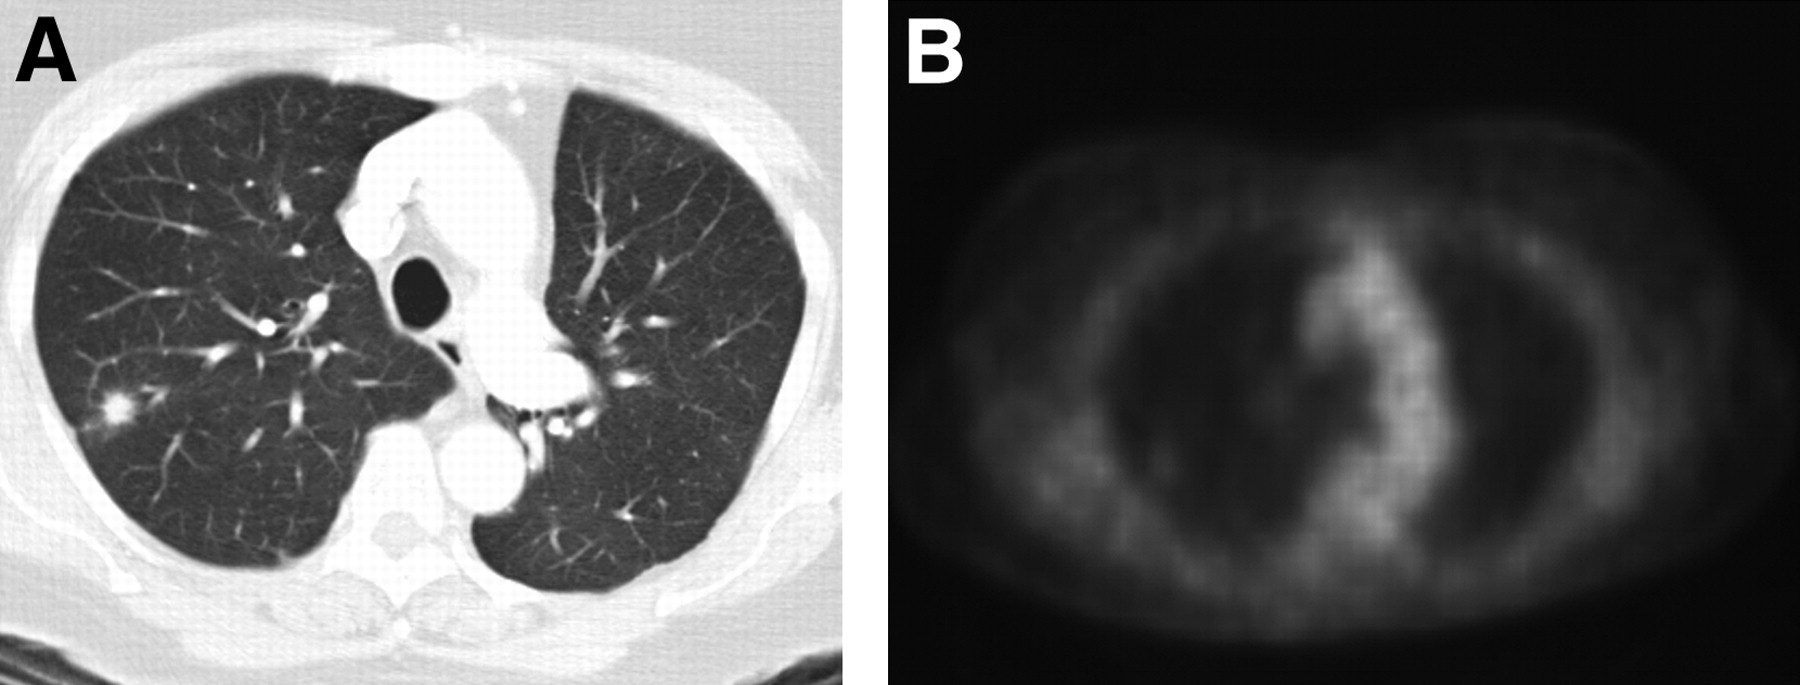
Figure 4 shows a case of a small lung tumor with a characteristic malignant pattern on CT but with a negative result on PET. The output value of the CAD scheme for PET was low and indicated a false-negative finding. When the CT features were used, the output of the CAD scheme for PET and CT obviously improved. Similarly, Figure 5 shows a case with a benign lung nodule that had a high uptake value. The output of the CAD scheme improved when CT features were used in addition to PET features.

69-y-old woman with adenocarcinoma. (A) Axial CT scan shows 0.6-cm spiculated nodule in right upper lobe. (B) Nodule SUV was 1.2 on PET scan. Computer outputs based on CT features alone, PET features alone, and both PET and CT features were 0.96, 0.27, and 0.84, respectively. Use of CT features improved (increased) estimated likelihood of malignancy based on PET.
51-y-old man with benign nodule that resolved after antibiotic therapy. (A) Axial CT scan shows 2.0-cm nodule in right upper lobe. (B) Nodule SUV was 2.5 on PET scan. Computer outputs based on CT features alone, PET features alone, and both PET and CT features were 0.29, 0.78, and 0.41, respectively. Use of CT features improved (decreased) estimated likelihood of malignancy based on PET.
DISCUSSION
When multiple diagnostic tests are performed on an individual, they sometimes yield conflicting results. Some methods, such as binary regression, linear and nonlinear discriminate analysis, decision trees, a Bayesian classifier, and neural networks, can be used for combining the information from the multiple modalities and thus improve diagnostic accuracy (19). We developed CAD schemes that use an ANN to combine clinical information with imaging features from CT alone, PET alone, and both PET and CT. Our study demonstrated that the performance of the CAD scheme based on both PET and CT was better than the performance of those based on CT alone and on PET alone for distinguishing between malignant and benign pulmonary nodules, when clinical information was included in all 3 computerized schemes. The result indicated that the CAD scheme using ANN could comprehensively combine information from PET and CT and would be a potentially useful tool in distinguishing benign nodules from malignant ones on PET and CT.
The improved performance brought about by combining PET and CT may be explained by the fact that PET and CT demonstrate different characteristics of pulmonary nodules. Theoretically, PET can differentiate malignant from benign pulmonary nodules because PET can measure the metabolic rate in nodules. Tissues with rapid metabolism, such as malignant tumors, take up more 18F-FDG and therefore can be identified by PET (20). A potential problem with PET is that some nonneoplastic tissues with high metabolic activity, such as tissues affected by granulomatous disease, could also show an elevated 18F-FDG uptake (21). Also, PET can yield false-negative results for some low-grade malignancies (such as bronchioloalveolar carcinoma or carcinoid) that have a low glucose metabolism (7,8). For these cases, CT findings such as the presence of coarse spiculation, lobulation, and inhomogeneous central attenuation were observed significantly more often among malignant than benign lesions (22). A CAD scheme that used the feature of nodules on CT was reported to be able to distinguish benign nodules from malignant ones (23).
Many investigators have reported that 18F-FDG PET gave inaccurate results for small nodules. Nomori et al. (9) reported that overall sensitivity and specificity were 0.79 and 0.65, respectively, for nodules of 1–3 cm. These values were lower than the 0.97 sensitivity and 0.78 specificity found in a meta analysis by Gould et al. (6). However, CT features can be useful for characterizing some small nodules. It has also been reported that analyzing multiple CT features could be effective for predicting small, benign pulmonary nodules and obviate follow-up CT and invasive diagnostic procedures for some nodules smaller than 1 cm (24). In the present study, we observed that the CAD scheme based on PET and CT performed better, especially for nodules smaller than 2.0 cm or nodules with a borderline SUV. When the SUV of a nodule was very high or low, PET played a predominant role in the CAD scheme. However, the CT features contributed the most for small nodules. As shown in Figure 4, a malignant nodule on 18F-FDG PET yielded a negative finding but was detected with CAD scheme 3. The computer outputs based on PET and CT were greatly improved, compared with the output for PET alone, indicating that radiologists could benefit from the CAD scheme for some cases that are difficult to diagnose.
The performance of our CAD scheme that included CT features was comparable to the findings of some other researchers. Shah et al. (25) used 31 features as input units, including the attenuation, volumetric shape, and enhancement of the nodule, and used 3 different classifiers, that is, linear, quadratic discriminant analysis, and logistic regression. The Az values ranged from 0.69 to 0.92. Matsuki et al. (14) used an ANN with 23 input units for 7 clinical parameters and 16 radiologic findings from high-resolution CT. Their Az value (0.95) was higher than our Az value (0.83) for the CAD scheme based on CT alone. The discrepancies in performance may be due to differences in patient populations and in imaging techniques. Most of our patients had undergone both CT and PET for the diagnosis of indeterminate solitary pulmonary nodules that were relatively difficult to diagnose by CT. Nodules with obvious benign features, such as central, laminated, diffuse, and popcorn calcifications or obvious fat, were excluded from this study.
We recognize several potential limitations of our study. First, this study was retrospective, and the chest CT slices that were preserved in our hospital PACS were 5 mm thick, possibly limiting the demonstration of nodules smaller than 5 mm because of the partial-averaging effect. However, the likelihood of malignancy for a nodule smaller than 5 mm is less than 1% in patients who have no history of cancer (26). Second, the sample size for our study was relatively small, because the number of patients was limited to those seen at our hospital during a period of only a year and a half. In the future, the results may be improved by use of thin-slice CT on a much larger number of cases.
CONCLUSION
Our CAD scheme based on PET and CT better differentiated benign from malignant pulmonary nodules than did the scheme based on PET alone or the scheme based on CT alone.
Acknowledgments
We thank Dr. Bill O'Brien Penney for providing technical support, Anthony Defily for acquiring PET/CT data, and Elisabeth Lanzl for improving the manuscript. This work was partly supported by USPHS grant CA62625. Kunio Doi is a shareholder of R2 Technology, Inc., Los Altos, CA, and Deus Technology, Inc., Rockville, MD. CAD technologies developed in the Kurt Rossmann Laboratories have been licensed to several companies, including R2 Technology, Deus Technologies, Riverain Medical Group, Mitsubishi Apace Software Co., Median Technologies, General Electric Corporation, and Toshiba Corporation. It is the policy of the University of Chicago that investigators publicly disclose actual or potential significant financial interests that may appear to be affected by research activities.
Footnotes
-
COPYRIGHT © 2006 by the Society of Nuclear Medicine, Inc.
References
- Received for publication December 31, 2005.
- Accepted for publication March 16, 2006.


