

FIGURE 1.
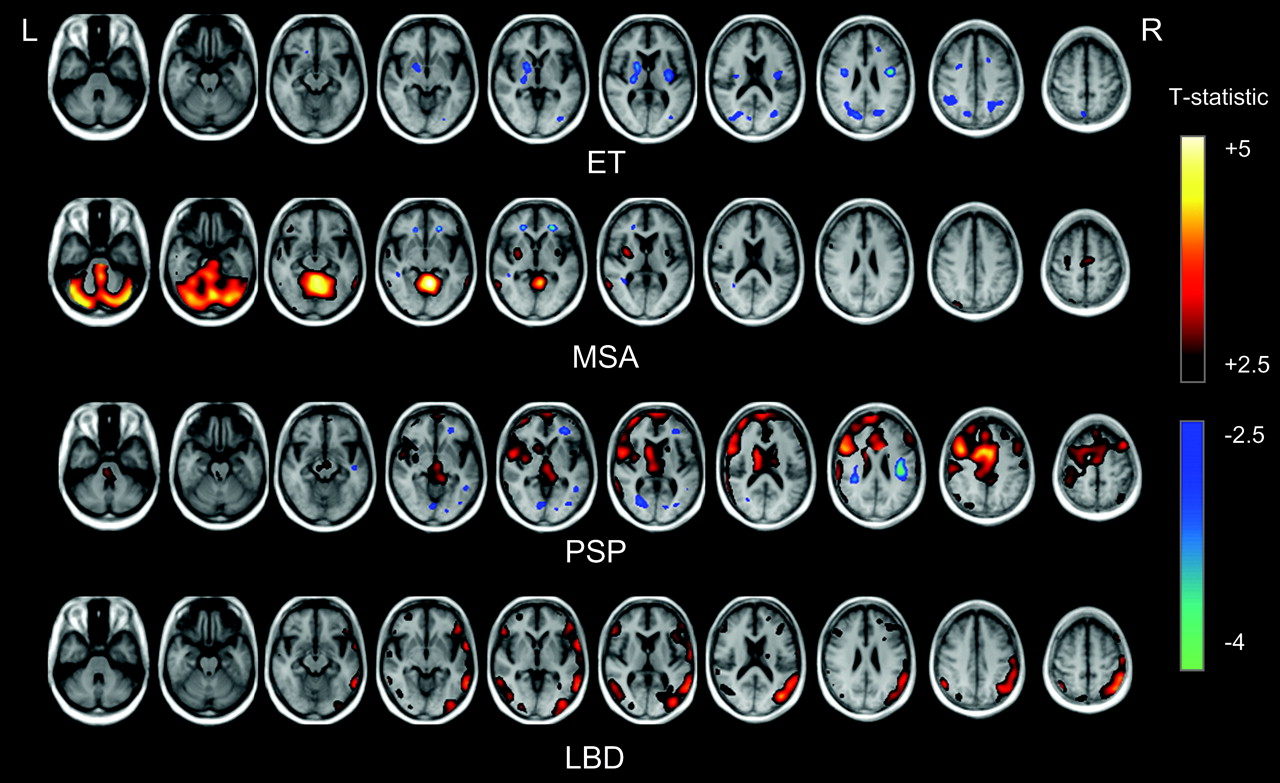
FIGURE 1.
Perfusion SPM t-maps with respect to IPD of atypical parkinsonism and ET. In hot scale reductions in relative 99mTc-ECD uptake are given, in winter colors the increases with respect to IPD (extent threshold kE = 50; cutoff T statistic as indicated; t = 2.5 corresponds to a voxel intensity P value of 0.007).
In this issue


Related Articles
Cited By...
- Analysis of Extrastriatal 123I-FP-CIT Binding Contributes to the Differential Diagnosis of Parkinsonian Diseases
- Is ioflupane I123 injection diagnostically effective in patients with movement disorders and dementia? Pooled analysis of four clinical trials
- Whole-Body Biodistribution and Radiation Dosimetry of 18F-FP-(+)-DTBZ (18F-AV-133): A Novel Vesicular Monoamine Transporter 2 Imaging Agent
- Combined Striatal Binding and Cerebral Influx Analysis of Dynamic 11C-Raclopride PET Improves Early Differentiation Between Multiple-System Atrophy and Parkinson Disease
- Quantification of Striatal Dopamine Transporters with 123I-FP-CIT SPECT Is Influenced by the Selective Serotonin Reuptake Inhibitor Paroxetine: A Double-Blind, Placebo-Controlled, Crossover Study in Healthy Control Subjects