


Abstract
Our goal was to noninvasively measure chemotherapy-induced changes in the expression of critical tumor growth genes. To achieve this goal, we used radionuclide and optical methods to measure changes in human telomerase reverse transcriptase (hTERT) gene expression in tumor cells before and after 5-fluorouracil treatment. Methods: A fusion reporter construct, containing humanized Renilla luciferase (hrl, for bioluminescent imaging), monomeric red fluorescence protein 1 (mrfp1, for fluorescent imaging), and a truncated thymidine kinase (ttk, for imaging of radiolabeled acycloguanosines), was placed under the control of hTERT promoter fragments. These constructs were introduced into tumor cell lines with and without hTERT expression. Transfected cells were treated with 5-fluorouracil, a chemotherapeutic that decreases hTERT gene expression, and treatment-induced changes in hTERT promoter activity were imaged. Results: When the fusion construct is introduced into cell lines that express hTERT, all 3 reporter systems are highly expressed and hTERT promoter activity can be visualized. Cell lines lacking hTERT transcription show no significant reporter expression. Decreases in hTERT gene expression caused by 5-fluorouracil treatment could be visualized in living 293T cells by both fluorescent microscopy and bioluminescent imaging. Conclusion: hTERT promoter activity can be monitored by 1 radionuclide and 2 optical reporter systems using a single reporter construct. This in vitro study provides evidence that our multimodality reporter construct can be used to study the expression of a critical tumor growth gene in living subjects.
Telomeres, the ends of linear chromosomes, shorten each time a cell divides (1). Critical telomere shortening leads to cell death (2). Human cancers must activate a mechanism to prevent critical telomere erosion to replicate and grow indefinitely (2).
The vast majority of human tumors (>85%) prevent telomere erosion by producing the telomerase enzyme (1). The telomerase enzyme is minimally composed of the telomerase RNA (hTR) (3) and the telomerase reverse transcriptase (hTERT) protein (4). Whether hTERT is transcribed is the key factor in whether telomerase is active (5); thus, hTERT expression is a critical regulator of cancer growth.
Measurement of hTERT expression in cancer cells may be clinically significant. The presence of hTERT has prognostic value in several types of cancer (6). hTERT expression and telomerase reactivation enhances the chemoresistance of cancer cells (7). Furthermore, effective radiotherapy and chemotherapy are associated with decreased expression of hTERT (8).
Despite its potential clinical significance, the measurement of hTERT expression has predominantly been by reverse transcription polymerase chain reaction (RT-PCR) of hTERT messenger RNA (mRNA), a method requiring the destruction of the cells examined. Newer approaches are needed that can be used noninvasively in intact cells. Such techniques would allow real-time analyses, providing a dynamic picture of hTERT expression in a variety of experimental settings. One such example using radionuclide imaging of hTERT promoter activity was recently published (9).
Reporter genes have recently provided new methods for noninvasive imaging, combining molecular biology with techniques such as fluorescent imaging, bioluminescent imaging, and radionuclide imaging (10). In fluorescent imaging, light is absorbed by a fluorophore, which subsequently emits light of a longer wavelength. For example, the red light emitted by mRFP1 allows imaging of individual cells in culture. In bioluminescent imaging, expression of an enzyme allows conversion of a substrate into a light-emitting product. For example, synthetic Renilla luciferase (hRL) converts coelenterazine into light-emitting coelenteramide. Compared with fluorescent and bioluminescent imaging, radionuclide imaging has limited resolution but allows for imaging in large animals. The expression of herpes simplex virus type 1 thymidine kinase (TK) in specific cells, resulting in trapping of radiolabeled acycloguanosine analogs, is a model for reporter gene imaging with radionuclides.
We used reporter genes to nondestructively measure hTERT promoter activity. A fusion reporter gene, containing humanized Renilla luciferase (hrl), monomeric red fluorescent protein 1 (mrfp1), and a truncated herpes simplex virus type 1 thymidine kinase (ttk), was placed downstream of several newly created hTERT promoter fragments. These constructs were then introduced into cell lines either expressing or lacking hTERT. We demonstrate that all 3 reporter signals are seen only in cell lines expressing hTERT. We also demonstrate that hTERT repression due to 5-fluorouracil (5-FU) chemotherapy can be imaged noninvasively by fluorescence microscopy and bioluminescent imaging.
MATERIALS AND METHODS
Cell Lines
U-2 OS, 293T, and MCF7 cell lines were obtained from the American Type Culture Collection. The cell line Saos was a generous gift from Dr. Richard Gorlick (Memorial-Sloan Kettering Cancer Center, New York, NY). 293T is an embryonal kidney tumor cell line. MCF7 is a mammary epithelial tumor cell line. U-2 OS and Saos are osteosarcoma cell lines. All cell lines were grown in Dulbecco's modified Eagle medium supplemented by 10% fetal bovine serum and 1% antibiotic/antimycotic.
RT-PCR of hTERT and β-Actin
Trireagent (Sigma) was used to extract total RNA from cells. Complementary DNA (cDNA) was synthesized using 0.4 μg of total RNA, random hexamer, and reverse transcriptase (GIBCO BRL). The cDNA samples were amplified, incorporating α-32P–dCTP into PCR products. PCR primers from 5′ to 3′ were:
β-Actin sense CAGGTCATCACCATTGGCAATGAGC
β-Actin antisense CGGATGTCCACGTCACACTTCATGA
hTERT-1784 sense CGGAAGAGTGTCTGGAGCAA
hTERT-1928 antisense GGATGAAGCGGAGTCTGGA
PCR amplification of hTERT cDNA was performed with an initial heating at 95°C for 60 s, followed by 33 cycles of 95°C for 20 s, 68°C for 30 s, and 72°C for 30 s. PCR amplification of β-actin was performed as above, but for only 21 cycles. Amplified products were electrophoresed on a 5% polyacrylamide/urea gel and visualized by use of a PhosphorImager scanner (Molecular Dynamics). Quantitation was performed using ImageQuant software (Molecular Dynamics). Each sample was performed in duplicate with consistent results.
Measurement of Telomerase Activity
Telomere repeat amplification protocol (TRAP assay) was performed as previously described to detect the presence of an active telomerase enzyme in cell lines (11). Each sample was processed with and without a heat pretreatment (95°C for 3 min) that inactivates telomerase. Each experimental condition was assayed in duplicate or triplicate with consistent results. The presence of an active telomerase enzyme is apparent as a ladder of TRAP products after resolution on 5% acrylamide gels.
Telomere Length Measurements in Cell Lines
Total nucleic acid was isolated from tissues using an extraction solution containing 4 mol/L guanidinium thiocyanate, 25 nmol/L sodium citrate, 1% 2-mercaptoethanol, and 0.5% Sarkosyl (Sigma). The homogenate was extracted with phenol/chloroform and then precipitated with 2-propanol. The pellet was washed with ethanol and dissolved in distilled water for restriction endonuclease digestion. Ten micrograms of total nucleic acid from each tissue sample was restriction digested with 12 units of Rsa I and 12 units of Alu I for 6 h at 37°C to produce telomere restriction fragments (TRFs). TRFs were resolved on 0.35% agarose gels. DNA was transferred to nylon membranes by Southern blotting. Membranes were incubated for 20 min at 42°C in Rapid-hyb buffer (Amersham Pharmacia Biotech), hybridized with 5′-end–32P-labeled (TTAGGG)4 for 1 h at 42°C in Rapid-hyb buffer, and then washed for 30 min at 42°C in 4× SSC (0.6 mol/L sodium chloride/0.06 mol/L sodium citrate). TRFs were visualized using a PhosphorImager, compared with radiolabeled DNA molecular weight ladders, and calculated as previously described (11).
Creation of hTERT Promoter/Fusion Report Gene Constructs
pCDNA3.1-CMV-hrl-mrfp1-ttk contains Renilla luciferase (hrl), monomeric red fluorescent protein 1 (mrfp1) and a truncated mutant herpes simplex virus type 1 thymidine kinase (ttk) under the control of the cytomegalovirus (CMV) promoter (12). A pDsRed2-1 vector containing 1.7 kilobases (kb) of sequence upstream of the hTERT transcription start site was a generous gift from Dr. Guoshun Wang (Louisiana State University, New Orleans, LA). The CMV promoter was excised from pCDNA3.1-CMV-hrl-mrfp1-ttk with Bgl II and Nhe I and replaced with the 1.7-kb hTERT promoter excised from pDs-Red2-1, creating pCDNA3.1–1.7-kb hTERT-hrl-mrfp1-ttk.
PCR was used for the creation of truncated hTERT promoters. Upstream primer hTERT-475F-Bgl II (GCAGCCCTGGGTCTCCAGATCTGGCCAGC) and downstream primer hTERT+49R-Nhe I (GGTGGCCGGGGCCAGGGCTAGCCACGTGC) were used to create the 0.5-kb hTERT promoter. Upstream primer hTERT-200F-Mfe I (GGACCGCGCTTCCCAATTGGCGGAGGGACT) and downstream primer hTERT+49R-Nhe I were used to create the 0.2-kb hTERT promoter. Primers are numbered by the number of bases upstream (+) or downstream (−) of the start of hTERT exon 1 (chromosome 5, base 1306027 on human July 2003 genome assembly at http://genome.ucsc.edu) and by the restriction cloning site used. The restriction site is in boldface type in the primer sequence.
The 0.5- and 0.2-kb hTERT promoter fragments were coupled to the fusion reporter as follows: The CMV promoter was excised from pCDNA3.1-CMV-hrl-mrfp1-ttk at Bgl II and Nhe I and replaced with the 0.5-kb hTERT promoter, creating pCDNA3.1–0.5-kb hTERT-hrl-mrfp1-ttk. The CMV promoter was excised from pCDNA3.1-CMV-hrl-mrfp1-ttk at Mfe I and Nhe I and replaced with the 0.2-kb hTERT promoter, creating pCDNA3.1–0.2-kb hTERT-hrl-mrfp1-ttk. Clones were confirmed by sequencing.
Cell Transfections
Transient transfections were performed with the Superfect transfection kit (Qiagen) using manufacturer's protocols.
Renilla and Firefly Luciferase Assays
Cells were lysed in 200 μL of 1× passive lysis buffer (Promega) by placing them in a shaker for 15 min at 25°C. The lysates were collected and centrifuged for 5 min at 10,000 rpm at 25°C. Renilla luciferase activities were assayed by mixing 20 μL of cell lysate, 1 μL of the substrate coelenterazine (1 mg/mL), and 100 μL of 0.05 mol/L sodium phosphate buffer at pH 7.0, followed by photon counting in the luminometer (model no. T 20/20; Turner Designs) for 10 s at 25°C. Firefly luciferase activities were assayed using Promega's luciferase assay kit. The readings were normalized by measuring the concentration of proteins from the cell lysates by using Bradford protein assay reagent from Bio-Rad Laboratories following the manufacturer's suggested procedures and represented as relative light units (RLU) per microgram of protein per minute.
Fluorescence Microscopy
Expression of mRFP1 was observed under a Zeiss Axiovert 200M fluorescence microscope (Carl Zeiss Microimaging Inc.) with DsRed filter setting (λ excitation, 546 nm; λ emission, 605 nm) and the image was acquired with MRGrab 1.0 software (University Imaging Corp.)
Bioluminescent Imaging
The cells transiently transfected and cotransfected with different combinations of vectors mentioned earlier in clear 12-well plates were used for imaging bioluminescence and fluorescence in the Xenogen IVIS optical imaging system (Xenogen Corp.), which contains a cooled charged coupled device camera. The system also contains a warming stage to maintain the cells at 37°C. Renilla luciferase expression was monitored after the addition of coelenterazine (1 μg/well) to phosphate-buffered saline (PBS) before each image acquisition. Bioluminescent signal was acquired for 20 s. Pseudocolor images representing light intensity superimposed on reference images, which is proportional to the amount of Renilla luciferase (RL) present, was calculated for each cell. Regions of interest were drawn over the cell area and RL activity was quantified as photons s−1·cm−2·steradian−1 by using Living Image Software version 2.50 (Xenogen Corp.).
TK Assays
Cells were incubated with [8-3H]penciclovir (28.12 kBq/mL [0.76 μCi/mL]; 1.5 × 10⁻⁵ mg/mL), a substrate for TK, at 37°C for 4 h in 12-well plates. The wells were washed with cold PBS, the cells were harvested, and then media and cell-associated radioactivity were determined with a Beckman LS-9000 liquid scintillation counter with Biosafe II (Research Products International) scintillation fluid, as described previously (13). As an internal positive control for transfection normalization, samples of pCMV-fluc cDNA were cotransfected along with experimental samples and assayed for firefly luciferase activity. Triplicate samples were evaluated for all uptake studies. The same samples were also assayed for determining total protein content, which was used to normalize TK activity. The net activity was represented as (dpm cells/dpm medium)/μg protein.
5-FU Treatments
293T cells were grown for 48 h with and without the presence of 5-FU (Sigma) at concentrations described in the text.
3-(4,5-Dimethylthiazol-2-yl)-2,5-Diphenyltetrazolium Bromide (MTT) Assay
The MTT dye reduction assay (American Type Culture Collection) can be used to measure cell viability. Assays were performed using the manufacturers protocols.
RESULTS
hTERT Expression, Telomerase Activity, and TRF Lengths Define “hTERT-Positive” and “hTERT-Negative” Cell Lines
293T and MCF7 cell lines display features typical of cancer cell lines expressing telomerase activity (Fig. 1). Both contain hTERT message detectable by RT-PCR, express telomerase activity detectable by the TRAP assay, and contain mean telomere lengths in the range of 4–6 kb as demonstrated by TRF Southern blotting. In contrast, U-2 OS and Saos cell lines lack hTERT message, lack telomerase activity, and have mean telomere lengths measuring >15 kb (Fig. 1). U-2OS and Soas cells use a poorly understood mechanism, termed ALT (for alternative lengthening of telomeres), to prevent telomere erosion (14). ALT cells are characterized by long, heterogeneous telomeres, longer than the recognized maximum of 10–15 kb in normal somatic tissues (15). Thus, for further experiments, we used 293T and MCF7 lines as hTERT-positive lines and U-2 OS and Saos lines as hTERT-negative lines.

hTERT expression, telomerase activity, and TRF lengths in cell lines. Results of gene expression analysis by RT-PCR, telomerase activity measurement by TRAP assay, and TRF length measurement by Southern blotting are shown for the 4 cell lines used in this study. RT-PCR: β-Actin is a control for cDNA quality and is present in all cell lines but is absent in the water negative control (Ø). hTERT is expressed in 293T and MCF7 cell lines. TRAP: 293T and MCF7 cell lines express telomerase activity, apparent as a ladder of TRAP products. Telomerase activity is appropriately abolished by heat pretreatment of the sample. TRF lengths: Mean TRF lengths of 293T and MCF7 cells are in the range of 4−6 kb. Mean TRF lengths of U-2 OS and Saos cells extend above 15 kb, characteristic of the ALT phenotype.
Under the Control of hTERT Promoters, 3 Reporter Systems Demonstrate Significant Activity in hTERT-Positive, but not hTERT-Negative, Cell Lines
A trifusion reporter gene, containing humanized Renilla luciferase (hrl), monomeric red fluorescent protein 1 (mrfp1), and a truncated mutant herpes simplex virus type 1 thymidine kinase (ttk), was initially downstream of the CMV promoter. Three new constructs were created in which the CMV promoter was replaced with either the 1.7-, 0.5-, or 0.2-kb hTERT promoter, creating a total of 4 constructs to be used in this study (Figure 2).

Relative expression of the reporter gene constructs in hTERT-positive and hTERT-negative cell lines. The trimodality reporter construct was placed under control of either the constitutively active CMV promoter or 1 of 3 truncated hTERT promoters. These 4 constructs were transfected into 2 hTERT-positive cell lines (293T and MCF7) and 2 hTERT-negative cell lines (U-2 OS and Saos). The relative expression of each of the 3 reporter genes was determined for each promoter construct. hRL and tTK activities are quantified for each cell line as a percentage of the activity expressed from the CMV construct. mRFP1 activity is described for each cell line as high, medium (med), low, or absent (nil), as compared with high activity of the CMV construct.
Plasmid DNA prepared from clones of each of the 4 reporter constructs was transiently transfected into 293T, MCF7, U-2 OS, and Saos cell lines. Mock transfection of each cell line was used as a negative control for reporter gene activity, and the constitutively active CMV promoter construct was used as a positive control for reporter gene expression. The 3 hTERT promoter constructs were used to examine promoter activity in hTERT-positive and hTERT-negative cell lines. Twenty-four to 48 h after transfection, the activity of mRFP1 was observed by fluorescence microscopy, RL enzyme activity was measured by luminometry and bioluminescent imaging, and tTK enzyme activity was measured by conversion of 8-3H–penciclovir to its phosphorylated, intracellularly trapped form. Cotransfection with the CMV-fluc reporter gene was used to normalize transfection efficiency in measurements for RL and tTK enzyme activities.
For all 4 cell lines, the highest reporter activities were always seen in cells transfected with the CMV promoter construct (Fig. 2). For each cell line, we used the reporter activity levels in cells transfected with the CMV construct as a baseline to compare the activity expressed from other constructs. As hRL and tTK activities are quantifiable, we calculated reporter activity from the hTERT constructs as a percentage of the activity seen in cells transfected with the CMV promoter construct. We defined the mRFP1 signal seen in cells transfected with the CMV promoter construct as “high” and then subjectively determined the signal obtained from other constructs to be “high,” “medium,” “low,” or “absent.”
hRL activity was detectable in all 4 cell lines when expressed from the constitutively active CMV promoter. In comparison, in all 4 cell lines, mock transfections resulted in <1% of the RL activity expressed by the CMV promoter. The level of hRL activity expressed from the hTERT constructs depended on whether the constructs were transfected into hTERT-positive or hTERT-negative cells. hTERT-positive 293T cells transfected with hTERT constructs expressed 24%−25% of the activity seen from CMV constructs, and hTERT-positive MCF-7 cells expressed ∼12%−13%. However, in the 2 hTERT-negative cell lines, activity levels were <2% and comparable to that of mock transfection.
mRFP1 activity was also detectable in all 4 cell lines when expressed from the CMV promoter. Mock transfections resulted in absent or nearly absent reporter expression. 293T and MCF-7 cells expressed mRFP1 activity from all 3 hTERT constructs, although at lower levels than from CMV constructs. In Saos and U-2 OS cells, there was no mRFP1 activity observed from any hTERT construct. Examples of mRFP1 activity in MCF7 and Saos cells are shown in Figure 3.

mRFP1 activity in MCF7 (hTERT-positive) and Saos (hTERT-negative) cell lines. (A) RT-PCR and TRAP assays of MCF7 and Saos cells after transfection with 1 of 4 promoter constructs. RT-PCR: β-Actin is a control for cDNA quality and is present in all cell samples but is absent in the water negative controls (Ø). hTERT is expressed in transfected MCF7 cells, but not in Saos cells. TRAP: Telomerase activity, is expressed in transfected MCF7 cells but not Saos cells. (B) Fluorescence microscopy of mRFP1 expression in transfected MCF7 and Saos cells. mRFP1 signal is seen in both MCF7 and Saos cells when expressed from the constitutively active CMV promoter. When expressed from the 3 hTERT promoters, mRFP1 signal is seen only in the hTERT-expressing MCF7 cells. CMV = CMV promoter; 1.7 T = 1.7-kb hTERT promoter; 0.5 T = 0.5-kb hTERT promoter; 0.2 T = 0.2-kb hTERT promoter.
TK activity was detectable in all 4 cell lines when expressed from the CMV promoter. In comparison, mock transfections of all 4 cell lines resulted in 10%−15% of the TK activity expressed by the CMV promoter. This is typical of background measurements in TK assays. The level of TK activity expressed from the hTERT constructs depended on whether the constructs were transfected into hTERT-positive or hTERT-negative cells. hTERT-positive 293T cells transfected with hTERT constructs expressed 55%−68% of the activity seen from CMV constructs, and hTERT-positive MCF-7 cells expressed ∼26%−44%. However, in the 2 hTERT-negative cell lines, activity levels were usually 10%−16%, comparable to that of mock transfection (Fig. 2).
The Decrease in hTERT Expression in 293T Cells After Treatment with 1 μmol/L of 5-FU Can Be Demonstrated by All 3 Reporter Systems and Nondestructively Demonstrated by Fluorescent Microscopy and Bioluminescent Imaging
We investigated the effect of 5-FU, cisplatinin, and tamoxifen on the activity of the hTERT promoter in 293T cells. 5-FU treatment, at a concentration of 1 μmol/L, provided a strong reduction in telomerase promoter activity as compared with untreated 293T cells and was used for further experiments. In transfected 293T cells, 5-FU treatment reduced hTERT message by ∼95%, as measured by RT-PCR (Fig. 4A).
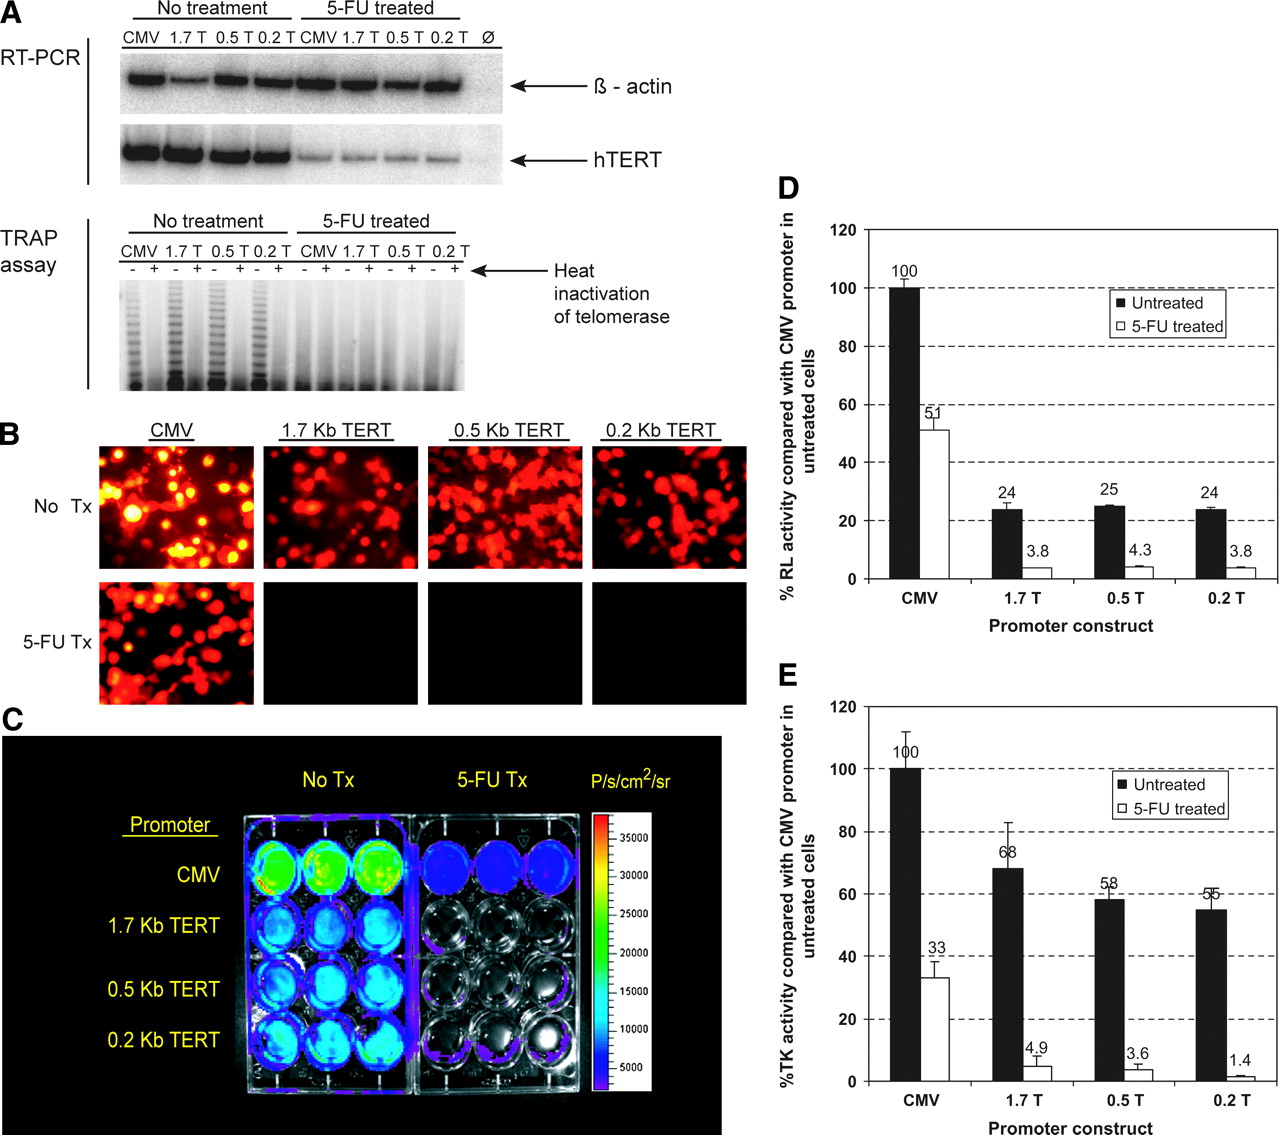
Repression of hTERT expression in 293T cells due to 1 μmol/L of 5-FU can be measured noninvasively by reporter gene activity. (A) RT-PCR and TRAP assays of transfected 293T cells with and without 5-FU treatment. RT-PCR: β-Actin is a control for cDNA quality and is present in all cell samples but is absent in the water negative control (Ø). hTERT is normally highly expressed in 293T cells but, after 5-FU treatment, hTERT expression is reduced ∼95%, as measured by ImageQuant quantification software. TRAP: Telomerase activity is normally expressed in 293T cells but is absent after 5-FU treatment. (B) Fluorescence microscopy of mRFP1 activity in 293T cells with and without 5-FU treatment. High mRFP1 signal is seen in both treated and untreated cells when expressed from the constitutively active CMV promoter. When expressed from the 3 hTERT promoters, high mRFP1 signal is seen in untreated cells but is nearly absent in 5-FU-treated cells. (C) Bioluminescent imaging of RL activity in 293T cells with and without 5-FU treatment. Low-level signal at the edge of some 5-FU-treated sample wells is due to light refraction artifact, not reporter activity. (D) Quantitation of RL activity by luminometry in 293T cells with and without 5-FU treatment. Results for each sample are shown as a percentage of RL activity seen in untreated 293T cells using the CMV promoter. Error bars represent SE. (E) Quantitation of tTK activity by TK assay in 293T cells with and without 5-FU treatment. CMV = CMV promoter; 1.7 T = 1.7-kb hTERT promoter; 0.5 T = 0.5-kb hTERT promoter; 0.2 T = 0.2-kb hTERT promoter; Tx = treatment; P/s/cm2/sr = photons s−1·cm−2·steradian−1.
Corresponding to the RT-PCR results, fluorescence microscopy shows mRFP1 activity is high when expressed from hTERT promoters in untreated 293T cells but is greatly reduced after 5-FU treatment (Fig. 4B). Although 5-FU treatment reduces mRFP1 signal from the control CMV promoter, the level of reduction appears significantly less than that seen from hTERT promoters.
Nondestructive bioluminescent imaging shows hRL activity expressed from hTERT promoters is greatly reduced by 5-FU treatment (Fig. 4C). hRL activity was also quantified for untreated and 5-FU-treated 293T cells by luminometry (Fig. 4D). By luminometry there was a <50% decrease in the level of hRL expression from the CMV promoter construct after 5-FU treatment. However, there was a drastic >85% reduction in hRL expression from the hTERT promoter constructs after 5-FU treatment.
tTK expression was measured by conversion of 8-3H–penciclovir to its phosphorylated form (Fig. 4E). There was a 67% decrease in the level of TK expression from the CMV promoter construct after 5-FU treatment. In comparison, there was a drastic 93%−97% reduction in TK expression from the hTERT promoter constructs after treatment. Thus, once again, the reduction in reporter activity expression in 293T cells after 5-FU treatment was far greater for hTERT constructs than for the control CMV construct.
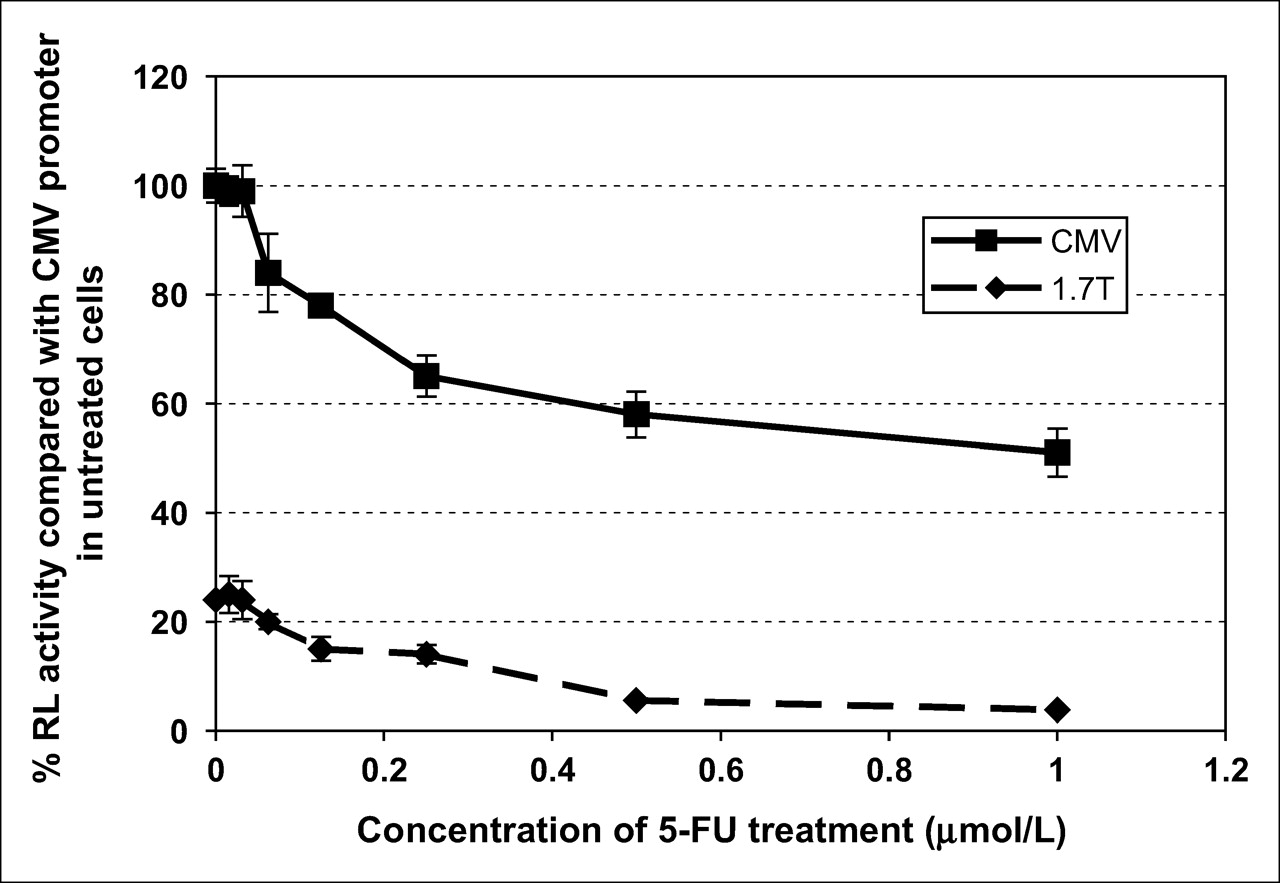
A dose–response curve for 5-FU treatment on hTERT promoter activity was determined by luminometry of hRL expression (Fig. 5). 293T cells containing the reporter construct were treated with 1 μmol/L of 5-FU, 2-fold serial dilutions of this concentration (1:2, 1:4, 1:8, 1:16, 1:32, 1:64 μmol/L), or no 5-FU (Fig. 5). No noticeable effect was seen on reporter expression until ≥1:16 μmol/L concentration of 5-FU. Higher concentrations of 5-FU caused reductions in reporter expression from both the CMV and 1.7-kb hTERT promoters, although the magnitude of reduction was much greater when expression was from the hTERT promoter. A cell viability assay (MTT assay) was performed to determine the toxicity of 5-FU treatment at the concentrations used. No reduction in the cell number or viability was seen with 5-FU concentrations up to 1 μmol/L, as compared with untreated cells.

Dose–response of 5-FU treatment on hRL expression in 293T cells. Cells containing either the reporter construct under control of the CMV promoter or the 1.7-kb hTERT promoter were treated with 1 μmol/L 5-FU, 2-fold serial dilutions of 5-FU (1:2, 1:4, 1:8, 1:16, 1:32, 1:64 μmol/L), or no 5-FU. RL activity was quantified by luminometry. Results for each sample are shown as a percentage of RL activity seen in untreated 293T cells using the CMV promoter. 1.7 T = 1.7-kb hTERT promoter.
DISCUSSION
As telomerase activity has been shown to be a key factor in tumorigenesis, the detection of hTERT promoter activity may be clinically valuable. Until recently, measuring hTERT transcription required the destruction of the cells under investigation, a serious liability. We attempted to develop nondestructive methods of measuring hTERT transcription, using fluorescence, bioluminescence, and radionuclide assays. Fluorescence microscopy and BLI have the advantages of allowing measurements of reporter gene expression without disturbing the cells being examined and allowing for repetitive measurements of reporter gene expression before and after treatment. The HSV1-sr39TK assays performed in this study required the destruction of the cell samples but provide a basis for future noninvasive radionuclide imaging of hTERT promoter activity in xenografts of small and large animals.
We used a construct containing mrfp1, hrl, and ttk under the control of the constitutively active CMV promoter as a positive control for reporter gene expression and under the control of 3 hTERT promoters to determine the expression of reporter genes in cell lines that express hTERT versus those that lack hTERT expression. Mock transfections served as negative controls.
All 3 reporter systems allowed for identification of hTERT promoter activity in telomerase-positive 293T and MCF7 cells, without false-positives from telomerase-negative U-2 OS and Saos cells. Reporter activity was always highest when expressed from the constitutively active CMV promoter. The level of reporter signal from the hTERT promoter constructs depended on the cell line that the construct was expressed in. In 293T cells, hTERT promoter constructs generated reporter signals about one half as strong as the signal seen from CMV promoters. In MCF7 cells, hTERT promoter constructs generated reporter signals about one eight to one fourth as strong as the signal seen from CMV promoters. In telomerase-negative cell lines, hTERT promoters generated very low reporter signals, comparable to mock transfections. For example, RL and mRFP1 signals were nearly absent in both U-2 OS and Saos cells when expressed from hTERT promoter constructs. Although some TK activity was seen in U-2 OS and Saos cells when expressed from hTERT promoter constructs, this level of activity is consistent with background from the TK assay.
The apparent background seen in tTK activity can be explained by the fact that mammalian cells contain their own endogenous TK. Though mammalian TK is not nearly as efficient as viral TK at the phosphorylation of 8-3H–penciclovir, mammalian TK will still catalyze the formation of some phosphorylated 8-3H–penciclovir. Thus, all cells in this study will nonspecifically sequester this reporter substrate, resulting in higher baseline counts during the assay. This results in “background noise” in all cells, including mock-transfected cells. In contradistinction, little if any background noise is seen in bioluminescent imaging of hRL activity. We believe the background noise seen in the tTK assay makes the calculated percentages of tTK activity in experimental cell lines appear higher than the calculated percentages of hRL activity.
We tested several hTERT promoter constructs to determine the optimal promoter for driving reporter gene expression. The optimal promoter should produce the strongest signal in hTERT-positive cells, while retaining its specificity for only hTERT-positive cells. Other investigators have suggested that shorter hTERT promoter fragments produce stronger alkaline phosphatase (16) or luciferase (17) expression. This was not apparent in our study. Despite being of significantly different lengths, the 3 hTERT promoters examined in this study produced similar levels of reporter gene activity. One study suggested that only the 82 base pairs adjacent to the hTERT initiator codon was necessary to retain specificity for hTERT-positive cells (16). Our work agrees with this hypothesis, as the 0.2-kb hTERT promoter was just as specific as the 0.5- and 1.7-kb hTERT promoters. One study identified an E-box that differentially influenced hTERT expression in normal and cancerous cells (18). As our study used only cancerous cell lines, no differences were observed because of the E-box.
One application of these imaging strategies was demonstrated in the imaging of decreased hTERT message after 5-FU treatment of 293T cells. 5-FU is a pyrimidine analog commonly used as a chemotherapeutic. RT-PCR showed that hTERT message expression was reduced by ∼95% after treatment with 1 μmol/L of 5-FU (Fig. 4A). This reduction could be monitored by fluorescence microscopy (Fig. 4B), bioluminescent imaging (Fig. 4C), luminometry (Fig. 4D), and quantitation of tTK activity (Fig. 4E). 5-FU–mediated reductions in reporter signals from hTERT promoter constructs were striking, with 5- to 10-fold reductions being common. Modest 2- to 3-fold reductions were seen in reporter signals from CMV promoter constructs after 5-FU treatment. These modest reductions are likely due to 5-FU–mediated toxicity; however, 5-FU treatments did not cause loss of cell viability in this study, as demonstrated by MTT assay.
Each modality of reporter gene imaging has its own advantages and disadvantages. By using a single construct capable of expressing reporters for 3 different imaging modalities, we can use the advantages of each system without having to change constructs. For example, we should now have the capability to sort cells by hTERT promoter activity using fluorescence-activated cell sorting and to image hTERT promoter activity in small-animal xenografts by BLI or large-animal xenografts by PET.
CONCLUSION
The promoter activity of hTERT, a critical cancer growth regulator, can be measured by 1 radionuclide and 2 optical techniques using a single reporter gene construct.
Acknowledgments
This work was supported by grants from the National Institutes of Health (CA082214-05 and DK07217) and the Medical Research Service of the Department of Veterans Affairs.
References
- Received for publication June 30, 2005.
- Accepted for publication October 18, 2005.


Jump to section
Related Articles
Cited By...
- Imaging Gene Expression in Live Cells and Tissues
- Noninvasive Visualization of RNA Delivery with 99mTc-Radiolabeled Small-Interference RNA in Tumor Xenografts
- An Optimized Telomerase-Specific Lentivirus for Optical Imaging of Tumors
- Noninvasive Imaging of Human Telomerase Reverse Transcriptase (hTERT) Messenger RNA with 99mTc-Radiolabeled Antisense Probes in Malignant Tumors