


Abstract
This article presents the role of nuclear medicine procedures in investigating renal and parenchymal disease, as well as upper urinary tract abnormalities. More specifically, the use of scintigraphy is described in the exploration of urinary tract dilatation and UTIs, vesicoureteric reflux, renovascular hypertension, and renal transplants. With a low radiation burden and the absence of sedation, these nuclear medicine procedures are easy to perform and can provide clinicians with valuable data on renal perfusion and the function of individual kidneys, as well as on urinary tract dynamics. However, knowledge of limitations and technical pitfalls is essential in understanding the role of scintigraphy among contemporary imaging methods and the unique information it supplies in nephrourology.
Nuclear medicine procedures can provide clinicians with valuable data on renal perfusion and the function of individual kidneys, as well as on urinary tract dynamics. These procedures have a low radiation burden, require no sedation, and are easy to perform, but clinicians must be aware of the limitations and technical pitfalls of scintigraphy to understand its role among contemporary imaging methods. This review describes the use of scintigraphy in the exploration of urinary tract dilatation and infections, vesicoureteric reflux (VUR), renovascular hypertension (RVH), and renal transplants.
URINARY TRACT DILATATION
Diuretic renography is an established procedure for the investigation and diagnostic work-up of upper urinary tract dilatation and for the follow-up of patients with hydronephrosis. In routine clinical practice, diuretic renography is the method of choice for differentiating a dilated unobstructed urinary system from a true stenosis and contributes to the management of patients with hydronephrosis by assessing both urinary flow and renal function. Major efforts have been made to standardize the procedure, to avoid technical pitfalls, and to allow comparison of results between institutions (1–4). In radionuclide studies of the kidneys and urinary tract of children, sedation should be avoided if possible, because it may interfere with bladder voiding and therefore with the study of urinary dynamics under physiologic conditions. Increased radiation exposure of the bladder mucosa might be another concern. We generously use topical lidocaine preparations to diminish the stress of venipuncture. Receiving the child with the parents in a dedicated, calm environment; allowing them to become acclimated; and giving them all the necessary information about the purpose and course of the procedure usually makes sedation unnecessary. When it cannot be avoided, local guidelines for sedating pediatric patients should be followed. We use, at the beginning of the study, a short inhalation of an equimolar mixture of nitrous oxide and oxygen for its analgesic and amnesic properties and minor side effects.
Diuretic Renography
Tubular tracers such as 99mTc-mercaptoacetyltriglycine (MAG3) and 123I-orthoiodohippurate (OIH) are generally preferred to the glomerular agent 99mTc-diethylenetriamine-pentaacetate (DTPA) because of their higher renal extraction ratio and rapid plasma clearance, especially in infants and young children and in patients with impaired renal function. Considering the immaturity of nephrons in newborns, the usual recommendation is that diuretic renography be delayed until the age of 4 wk. Before that age, renal tubules may be unable to respond to the effect of furosemide. Renal function matures gradually during the first 2 y of life. Using 99mTc-MAG3 clearance normalized for body surface, Lythgoe et al. found that mature clearance was reached during the first year of life and, in 68%, even before the age of 2 mo (5). Other authors have also emphasized the feasibility and reliability of diuretic renography in neonates (6,7). The guidelines published by the Society of Nuclear Medicine and the European Nuclear Medicine Association recommend the use of furosemide at a dose of 1 mg/kg, up to a maximum of 20 mg in children and 40 mg in adults. We inject 1 mg/kg in infants, 0.5 mg/kg in children, and 40 mg in adults according to the recommendations of the Consensus Committee of the Society of Radionuclides in Nephrourology (4). The validated timing for furosemide administration is either 20 min or more (F+20) after tracer injection, when maximal distension of the renal pelvis or ureter can be visually assessed, or 15 min before tracer injection (F−15), which will then occur when the diuretic response of the kidney is maximal. A more recent proposal has been to inject furosemide at the same time as or just after (F+0) the radiopharmaceutical. This procedure has gained popularity, especially in infants and children, because it avoids repeated venous puncture and shortens the procedure (6–8). Concomitant administration of radiotracer and furosemide does not interfere with the determination of renal function: The diuretic effect begins 1–2 min after injection of the furosemide, and parenchymal extraction of tubular tracers occurs during the first minute after bolus injection, with a normal time to peak of less than 3 min. Up to now, there is no evidence that one timing of diuretic administration is better than another. Diuretic response is evaluated by visual and quantitative interpretation of the dynamic acquisition. Postmicturition images are mandatory because a full bladder may delay urinary flow even in an unobstructed system. The effect of gravity-assisted drainage (a change from the supine position to erect or prone) is recommended in cases of incomplete urinary drainage. The role of bladder catheterization is still debated, but it is not recommended in clinical routine practice. In older children and adults, renography is performed after bladder emptying, whereas in non–toilet-trained children, spontaneous micturition is usually observed during the acquisition. In some particular conditions such as a neurogenic, dysfunctional, or low-capacity bladder, continuous bladder emptying during the examination may be indicated. Adequate functioning of the affected kidney (glomerular filtration rate [GFR] > 15 mL/min) and adequate hydration are major determinants of the response to furosemide. Oral hydration (15 mL/kg during the 30 min before renography) is usually sufficient. Infants will receive bottle or breast feeding before the test. In particular cases, an intravenous saline infusion before and during the study may be preferred. Urinary output, reflecting both the diuretic response and the hydration state of the patient, should be measured during the study. Furthermore, in neonates and infants, renal pelvis compliance is high: An apparently obstructed response pattern may reflect just the volume expansion induced by furosemide (9). Background-corrected time–activity renal curves are used to assess urinary drainage and to calculate differential renal function. An unobstructed system is easily assessed by prompt tracer washout, whereas a rising curve will be highly suggestive of true obstruction. Simple parameters such as time to peak and time to obtain a washout of 50% of tracer from the kidney allow one to quantify the response. Other quantitative parameters that assess drainage relative to renal function (output efficiency, pelvic excretion efficiency, parenchymal transit time index, normalized residual activity) may be used to refine the response evaluation, but none allows unequivocal interpretation of diuretic renography in impaired kidneys. Thus, besides assessing the diuretic response, quantifying renal function is important. Chronic obstruction may cause a loss of renal parenchymal function due to increased pressure in the urinary system (Table 1).
Limitations and Pitfalls in Performing and Assessing Diuretic Renography
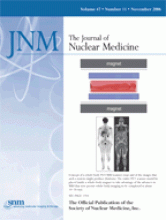
With tubular tracers, the normal time to peak is less than 3 min in a well-hydrated subject, including neonates and young infants studied with the F+0 protocol. Differential renal function should consequently be measured during the extraction phase of the renogram, that is, during the first 2 min (Fig. 1). Differential renal function represents the contribution of each kidney to the sum of the left and right renal activity and normally ranges from 45% to 55% (2). A differential renal function below 40% or a decrease of differential renal function of more than 5% on successive diuretic renography studies is generally considered indicative of renal function deterioration, possibly because of obstructive uropathy, and is used as the threshold for surgery in most institutions. We do not believe that differential renal function alone can reliably be used to assess renal function. The impaired function of one kidney may be compensated for by the contralateral nonaffected kidney. This compensation may induce an apparent fall of differential renal function whereas the absolute function of the affected kidney in fact remains stable. γ-Camera–based methods of determining absolute renal function are not recommended by the experts, and clearance techniques based on blood sampling remain the gold standard. However, we measured the absolute function of individual kidneys using a camera-based method in infants with severe unilateral pelviureteric junction stenosis treated either surgically or conservatively, and we found reliable results even in neonates and young infants (6,10,11). This finding has been confirmed by others, who combined the overall GFR measured with 51Cr-ethylenediamine tetraacetic acid and differential renal function measured during renography to obtain a single-kidney GFR (12). Using differential renal function to assess renal function is also inappropriate in patients with only one functioning kidney, bilateral hydronephrosis, urethral valves, or renal failure. Another important issue is that none of the methods predicts the final outcome for renal function.

Diuretic renography (F+0) in 6-mo-old boy who had febrile UTI by age of 2 mo. Renal sonography and VCUG had normal findings. (A) One-minute posterior views demonstrate normal tracer uptake by both kidneys and rapid washout, with bladder activity visible from third minute after injection and spontaneous micturition occurring at minute 10. (B) Left (red) and right (blue) renal time–activity curves show symmetric relative function (left, 50%; right, 50%) and normal time to peak (<180 s).
Nonradionuclide Imaging
Sonography easily detects hydronephrosis both in infants and in adults and remains the first imaging modality used for the diagnosis and follow-up of hydronephrosis. Intravenous urography was used formerly but has now been replaced by unenhanced spiral CT, which needs no bowel preparation, takes approximately 5 min, and detects other abnormalities including parenchymal thinning, edema, perinephric fluid, and tumors. CT has been used in the diagnosis of urolithiasis and appears to be safe, simple, rapid, and accurate but does not provide functional information and may miss noncalcareous causes of obstruction (13,14). Magnetic resonance urography (MRU) has been found to be efficient in the investigation of a dilated upper urinary tract and offers advantages over other established diagnostic procedures: The technique provides high anatomic resolution and information on renal function without radiation (14–16). Sequences with T2 weighting provide essential information on the dilated, fluid-filled urinary system without contrast administration, regardless of renal function. Gadolinium-enhanced T1-weighted sequences together with furosemide injection allow evaluation of the entire upper system. Three-dimensional MRU also offers the possibility of quantifying renal parenchymal function in cases of poor renal function or gross hydronephrosis (17). Another challenging potential of MRU is the measurement of single-kidney GFR and the mapping of intrarenal GFR. In small children, the major drawback of MRU is the need for sedation and bladder catheterization. The procedure is quite lengthy and may not be used in the routine clinical evaluation of hydronephrosis but can provide useful information in cases of complex urinary tract abnormalities such as duplex kidneys (Fig. 2).
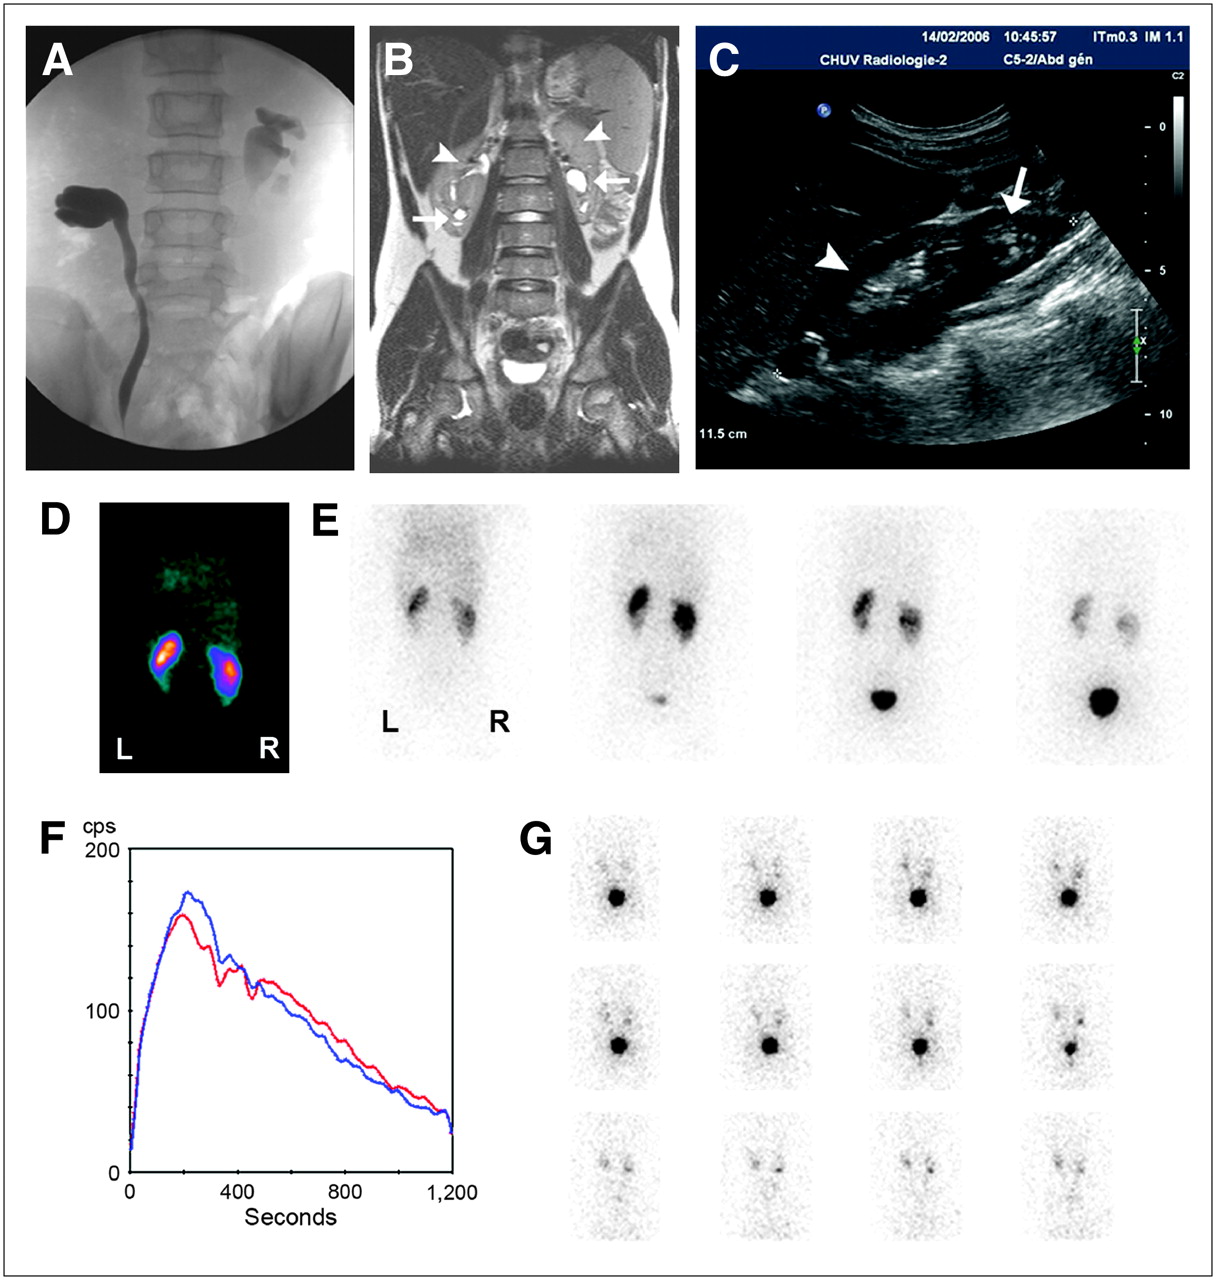
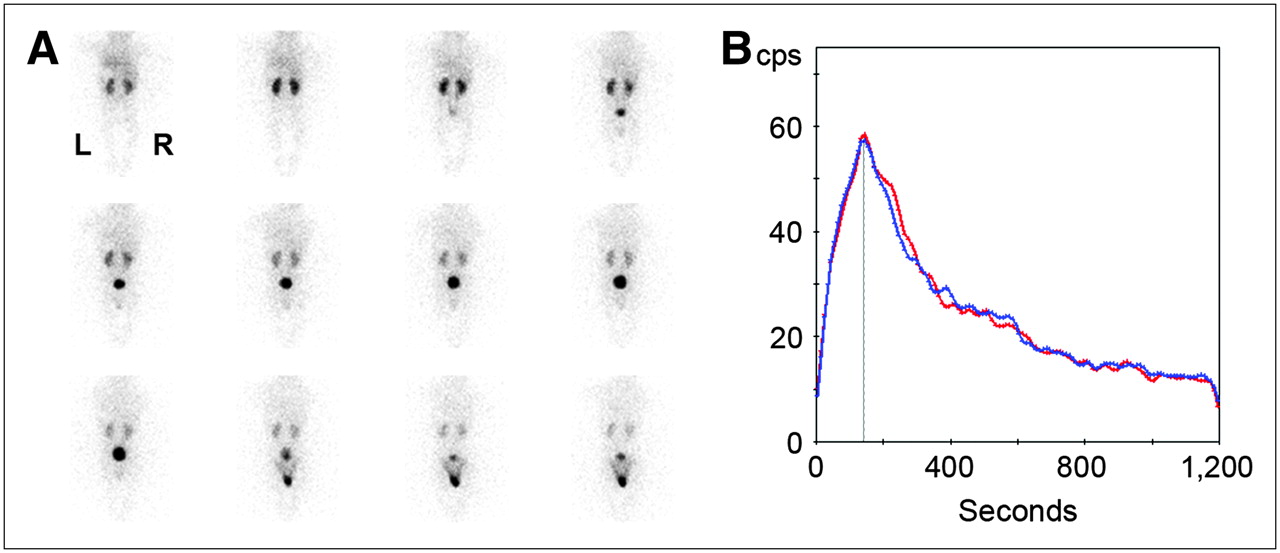
Bilateral duplex kidney diagnosed in 9-y-old boy after febrile UTI. (A) VCUG shows bilateral pyeloureteral reflux with opacification of incomplete systems, suggesting duplication. (B) Coronal T2-weighted MRI scan confirms presence of duplex kidneys bilaterally. Lower pyelocaliceal systems are dilated (arrows) even when upper ones remain thin (arrowheads). (C) Sagittal sonographic view of right upper quadrant shows enlarged kidney with broad layer of parenchyma on upper pole (arrowhead) and atrophic lower pole (arrow). (D) One-minute parenchymal view shows decreased tracer uptake by left lower system and parenchymal defects at both poles of right kidney. (E) Images obtained 1, 4, 9, and 15 min (from left to right) after injection show delayed urinary flow in lower moiety of left kidney due to loss of parenchymal function. (F) Renograms of left and right kidneys show symmetric function (left, 49%; right, 51%) and no significant impairment of urinary flow under furosemide. (G) Indirect radionuclide cystography demonstrate VUR in both left and right lower systems.
Prenatal Hydronephrosis
Prenatal hydronephrosis is the second most frequently occurring fetal structural anomaly after those involving the central nervous system and is usually detected during the second or third trimester of pregnancy (18,19). Prenatal hydronephrosis has an incidence ranging from 0.3% to 4.5%, depending on the criteria used to differentiate hydronephrosis and pyelectasis, and is bilateral in 37%–57%. The hydronephrosis grading system developed by the Society for Fetal Urology takes into account the anteroposterior diameter of the renal pelvis, the appearance of calices, and the renal parenchyma (Table 2) (20). There is no absolute threshold value, but follow-up is generally recommended if the anteroposterior diameter is at least 7–10 mm during the third trimester of pregnancy. The objectives of postnatal evaluation are to confirm hydronephrosis and then to determine its cause and to assess renal function. Bilateral hydronephrosis requires prompt evaluation by sonography and voiding cystourethrography (VCUG), especially in boys, in order not to miss posterior urethral valves (21). Unilateral hydronephrosis is generally considered a benign condition that rarely leads to renal failure. The first postnatal sonographic study is usually performed during the first week after birth, depending on the severity of the prenatal findings, but not during the first 72 h because of reduced urine output after delivery (18,21). More common causes of fetal hydronephrosis are transient hydronephrosis (48%) and physiologic hydronephrosis (15%), which will spontaneously resolve after birth. About 35%–50% of prenatal hydronephrosis will persist on sequential sonographic studies performed during the first and sixth weeks of life. The most common cause of persistent hydronephrosis is pelviureteric junction stenosis, which is bilateral in 20%–25% of cases and more frequent in males. Treatment of congenital unilateral pelviureteric junction stenosis is still debated, but there is evidence that a conservative approach with close follow-up of renal function can safely be recommended (Fig. 3); 20%–25% of infants will require surgery during the first 2 y of life (22). Other investigators have emphasized the need for long-term follow-up and found that 50% of neonates with unilateral pelviureteric junction stenosis finally required surgery by the age of 7 y (23). Close follow-up with diuretic renography and sonography can be used safely to monitor renal function and the degree of hydronephrosis (24), although none of the investigations is able to predict the ultimate deterioration of renal function. The use of intravenous urography is declining, and CT is not routinely used in children (25). MRU offers the advantage of providing high-resolution anatomic details and functional information without radiation but remains a long and invasive procedure that requires sedation in infants. Therefore, MRU is not recommended for the diagnosis and follow-up of all children with hydronephrosis and should be used to address only complex urogenital malformations.
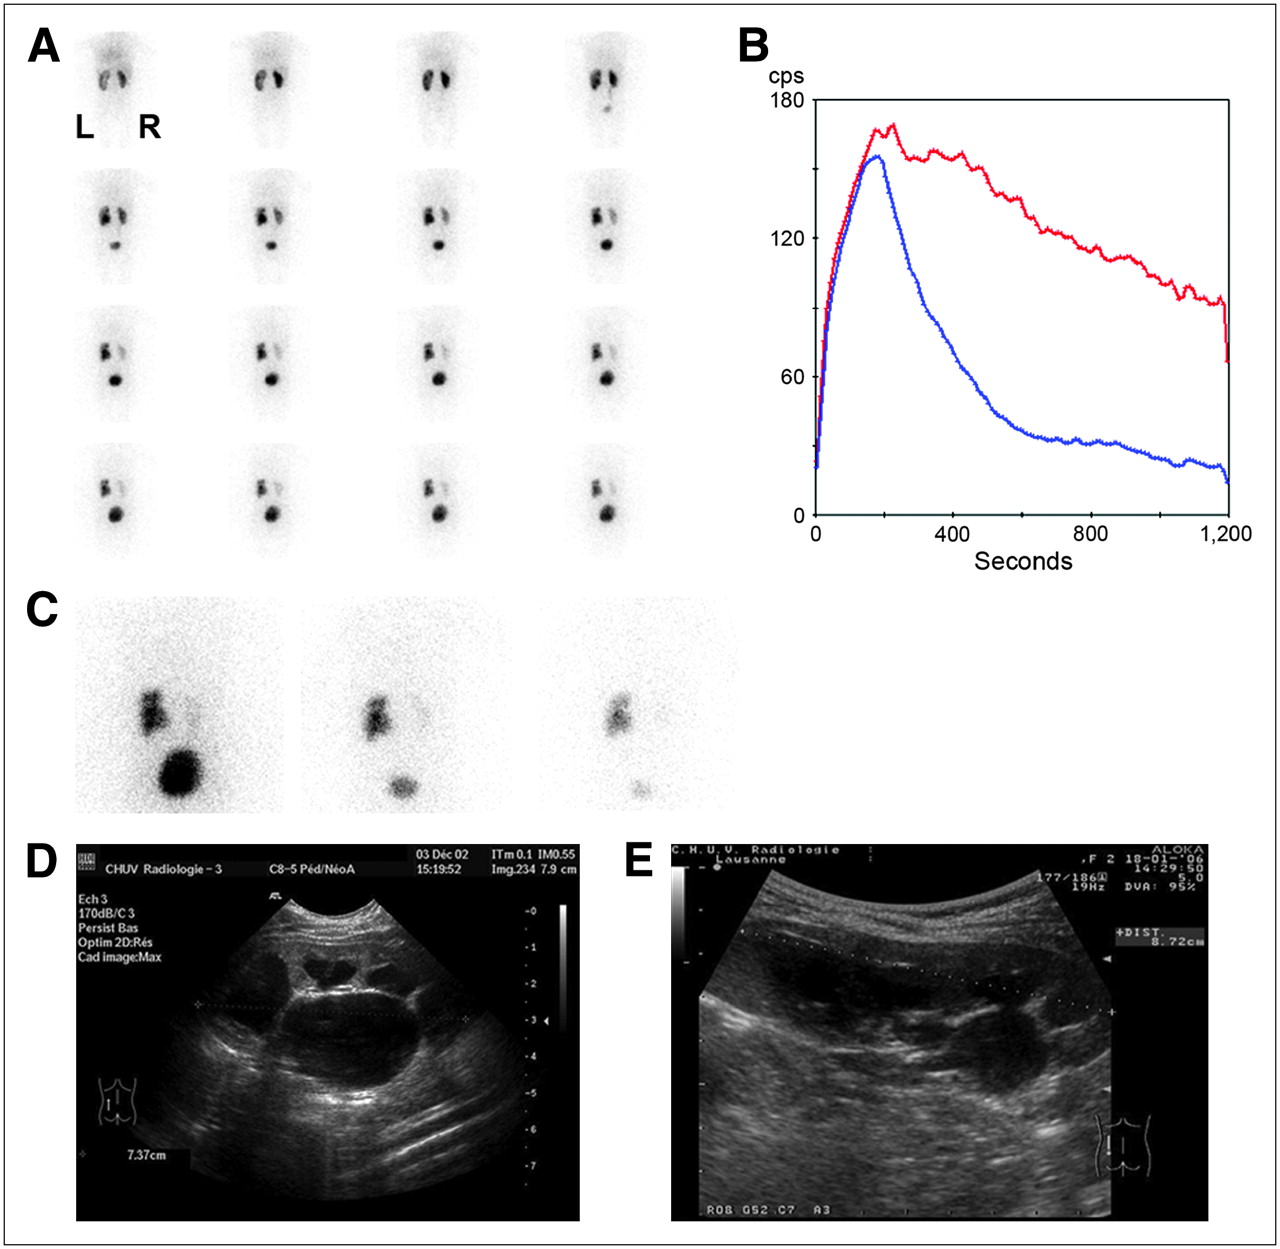
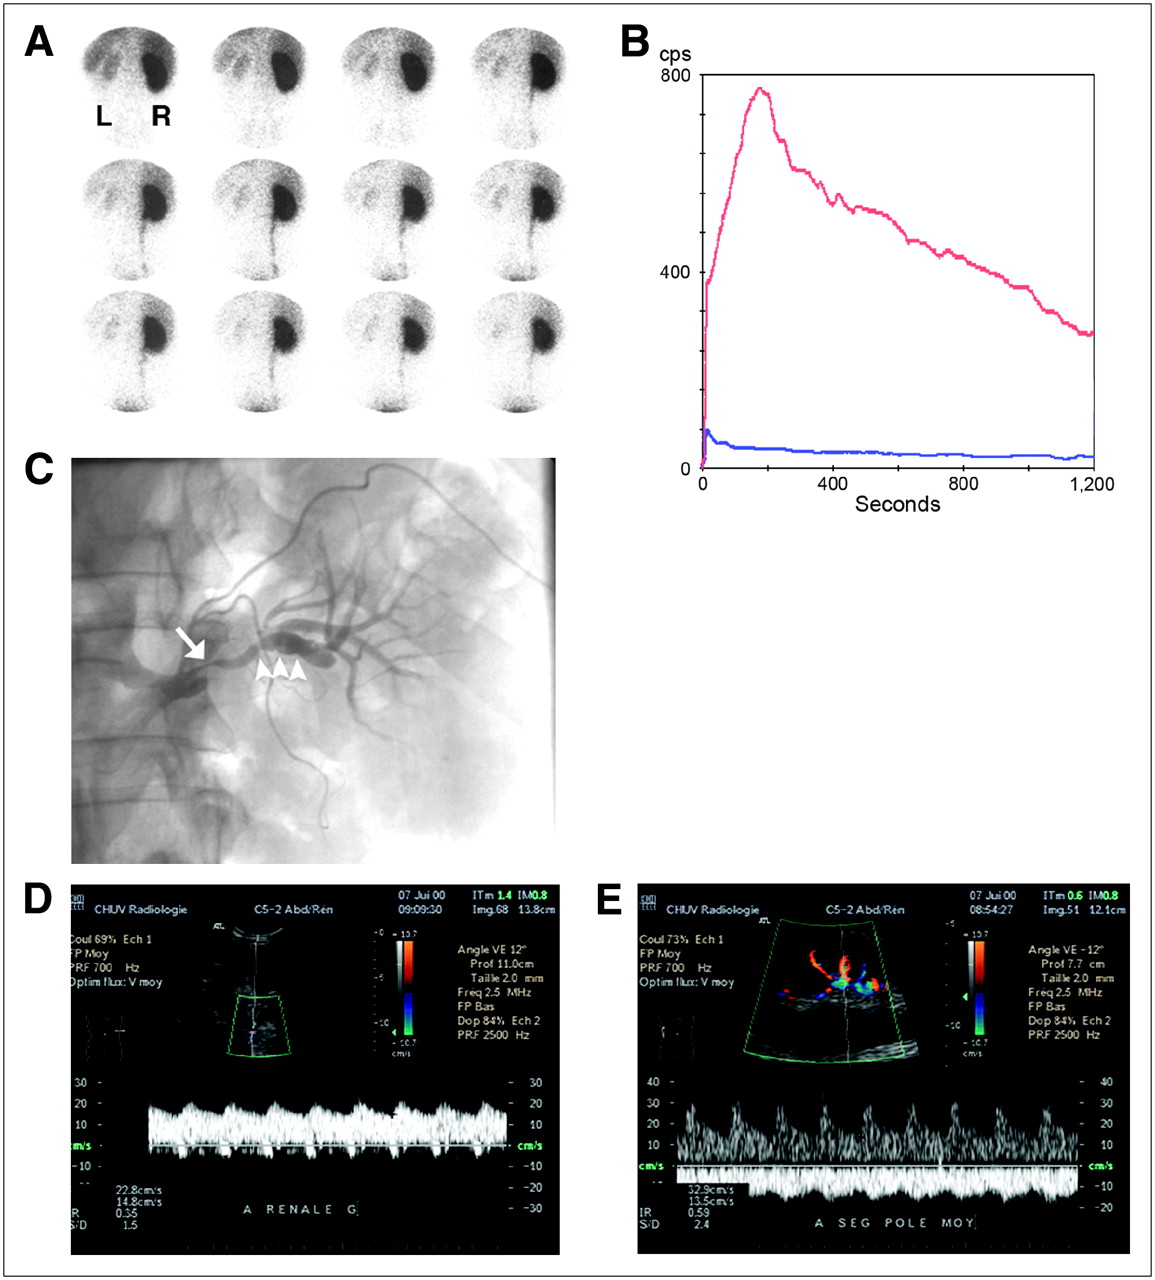
Diuretic renography (F+0) obtained during follow-up of 4-y-old girl treated conservatively for left pelviureteric junction stenosis detected prenatally. (A) One-minute posterior views show dilated left kidney with preserved parenchymal function despite impaired urinary drainage above pelviureteric junction. Right kidney is normal. (B) Left (red) and right (blue) renograms confirm symmetric (left, 51%; right, 49%) and normal tracer extraction by both kidneys and abnormal urinary flow out of left kidney. (C) Images obtained 20 min after injection (left), after miction (middle), and 50 min after injection (right) show residual activity within left renal pelvis after miction and 50 min after injection. (D) Initial sonographic sagittal view of left kidney shows enlargement of pyelocaliceal system. (E) Follow-up sonogram obtained at same time as diuretic renography shows persistent enlargement, with satisfactory growth of left kidney.
Grading System for Antenatally Detected Hydronephrosis
The second most common cause of prenatally detected hydronephrosis is VUR, which will be discussed in a separate section. Other urologic abnormalities include megaureters and multicystic dysplastic and duplex kidneys.
Adult Hydronephrosis
Whereas hydronephrosis is most often detected fortuitously in asymptomatic children, in adults it is generally diagnosed because of recurrent flank pain of various durations and intensities, UTI, or acute ureteric colic due to urolithiasis. The role of renography is probably limited in patients presenting to the emergency room for acute renal colic. Sonography followed by unenhanced CT will confirm hydronephrosis and reliably localize the level of obstruction. Some authors have observed that obstruction is better categorized by diuretic renography and that it should be performed in order to distinguish patients who may benefit from surgery from those who may be treated conservatively (26). These authors also noted that the positive predictive value of spiral CT findings for obstruction does not keep up with that of diuretic renography. They described the “stunned-kidney pattern” caused by cortical or parenchymal dysfunction due to a decrease of flow and function after passage of the calculus, with no or only faint urine production. This particular situation has to be recognized, and delayed images are mandatory to confirm that the acute tubular damage is due to acute obstruction because function is expected to recover, usually within days. Another limitation of unenhanced spiral CT is its lack of sensitivity (reported to range from 27% to 42% (14)) in the diagnosis of noncalcareous hydronephrosis. MRU with T2-weighted sequences has been shown to be accurate for the diagnosis of acute ureteric obstruction and easier to interpret than unenhanced spiral CT, especially for the diagnosis of perirenal fluid due to acute obstruction (27). Diuretic contrast-enhanced MRU has been evaluated in patients with obstructive uropathy due to calculus and congenital abnormalities of the urinary system and was more specific than CT and sonography (28). As mentioned before, MRU has many potential advantages over the other established procedures for the diagnosis of obstruction, in particular the lack of radiation and the possibility of simultaneously providing functional information and high-resolution anatomic details. The major drawbacks remain the limited availability, high costs, and patient-dependent feasibility. In the management of obstructive uropathies, diuretic renography offers the advantages of providing information about renal parenchymal function and of assessing urinary drainage in a single simple procedure and thus remains a method of choice in the diagnostic workup of adult patients with hydronephrosis (29). As in children, in adults the proper management of chronically impaired urinary drainage is still debated, because no diagnostic method is able to provide prognostic information on renal function outcome.
URINARY TRACT INFECTION (UTI)
UTI is frequent in children and affects girls twice as often as boys, with 80% of the first infections being diagnosed during the first 2 y of life (30). The diagnosis relies on urine cultures. Clinical and biologic criteria are used to differentiate lower UTI from upper UTI, that is, acute pyelonephritis. This differentiation is important because both entities need specific treatment. The prevalence of UTI is approximately 5% in infants and young children, and the only clinical sign may be fever of unexplained origin (31). The risk of renal damage is related to the delay between diagnosis of infection and initiation of treatment and increases with the number of UTIs. Nevertheless, no consensus exists on the role of imaging procedures in the diagnosis of acute pyelonephritis. The Subcommittee on Urinary Tract Infection of the American Academy of Pediatrics Committee on Quality Improvement recommended imaging (mainly sonography, VCUG, or radionuclide cystography) of the urinary tract in children younger than 2 y old but considered the role of cortical renal scintigraphy still to be unclear despite its recognized high sensitivity (31).
Cortical Scintigraphy
Scintigraphy with 99mTc-dimercaptosuccinic acid (DMSA) is a simple and noninvasive method that requires static imaging 2–4 h after intravenous injection. Sedation is rarely needed. Delayed or postfurosemide images may be helpful in cases of hydronephrosis. The value of SPECT is still not clear, because the clinical relevance of scars detected only on SPECT images is uncertain. Reconstructing oblique SPECT images according to the long axis of the kidneys reduces artifacts. In small children, pinhole images of the kidneys are recommended. Relative function is normally 44%–56% (32,33). As mentioned before, a composite image of the first 2 min of dynamic renography with 99mTc-MAG3 or 123I-OIH may also be used to evaluate renal parenchymal scarring but, because of a lower sensitivity, is a second choice (33).
The sensitivity of 99mTc-DMSA for the detection of parenchymal defects due to infection ranges from 80% to 100% but does not allow differentiation of acute pyelonephritis from renal scars (30,34). Abnormal findings on cortical scintigraphy are found in 52%–78% of children during acute pyelonephritis, and the risk that a renal scar will develop can reach 60% (35). Cortical scintigraphy during acute pyelonephritis has a high negative but weak positive predictive value for long-term renal scarring. A semiquantitative analysis of 99mTc-DMSA raised the positive predictive value from 62% to 85% for the detection of children at a high risk for the development of renal scars (36). Nevertheless, the role of cortical scintigraphy is still largely debated in acute pyelonephritis but is widely accepted in the detection of renal scars.
Nonradionuclide Imaging
The sensitivity and specificity of color and power Doppler sonography have been shown to be comparable to those of cortical scintigraphy for the detection of acute pyelonephritis (37). Acute pyelonephritis is usually visualized as a parenchymal triangular zone of decreased or absent flow. The main limitation of power Doppler sonography is its operator dependence, whereas its advantages are its wide availability, low cost, and lack of radiation. Some authors have found that sonography could be useful in detecting severe renal inflammation but not in identifying the risk of renal scarring (38). 99mTc-DMSA scintigraphy is the reference method for detecting renal sequelae after UTI, is more sensitive than sonography (30,32,33), and should be performed no sooner than 6 mo after the last documented UTI.
In an experimental study, Majd et al. found a similar sensitivity and specificity among 99mTc-DMSA SPECT, gadolinium-enhanced MRU, and spiral CT (39). Using T2-weighted inversion recovery sequences, Weiser et al. showed MRU to have potential for differentiating acute pyelonephritis from scars (40). MRU also reveals the anatomy of the kidneys and urinary tract at a high resolution that adds valuable information for further management. The major disadvantages of MRU remain its high cost, limited availability, lengthy examination time, and need for sedation in infants and young children.
VUR
VUR may be diagnosed early in life because of prenatally detected hydronephrosis or later during childhood after UTI. Management strategies include either a conservative approach, with antibiotic prophylaxis and follow-up, or antireflux surgery. Neonates are generally treated conservatively, because the VUR is expected to resolve spontaneously in 45%–70% of neonatal cases (41). The long-term complications, such as renal insufficiency, hypertension, and pregnancy-related complications, are related to parenchymal scarring after pyelonephritis (30). Diagnostic strategies include renal parenchymal imaging with 99mTc-DMSA to detect scars and VCUG to diagnose and grade the intensity of reflux.
Radionuclide Cystography
Direct radionuclide cystography is a radiologic-VCUG alternative that delivers a lower radiation burden (30,42,43). The method is as invasive as VCUG, because both require bladder catheterization, but is more sensitive than VCUG because acquisition is continuous during both the filling and the voiding phases. Reflux is known to be an intermittent phenomenon that may be missed on VCUG but visualized on direct radionuclide cystography or vice versa. Direct radionuclide cystography, like VCUG, provides information under nonphysiologic conditions, making the use of indirect radionuclide cystography attractive (30,43,44). Indirect radionuclide cystography is typically performed after conventional renography with 99mTc-MAG3 or 123I-OIH because of their high extraction rate (30,42,45) and offers the advantages of allowing the child to be investigated under physiologic conditions without bladder catheterization and of delivering a lower radiation burden than that of VCUG (Fig. 4). The sensitivity and specificity of indirect radionuclide cystography have been reported to be less than those of VCUG and of direct radionuclide cystography but still may be sufficient for follow-up of VUR. The published guidelines do not recommend the use of indirect radionuclide cystography in non–toilet-trained children. In our experience, indirect radionuclide cystography is easy to perform in neonates and infants and may add valuable information to renography without adding to the radiation dose or requiring an invasive procedure. A well-hydrated infant will void during most examinations; it is just a matter of patience. The major disadvantages of both direct and indirect radionuclide cystography are that they do not provide anatomic information or permit grading of VUR.
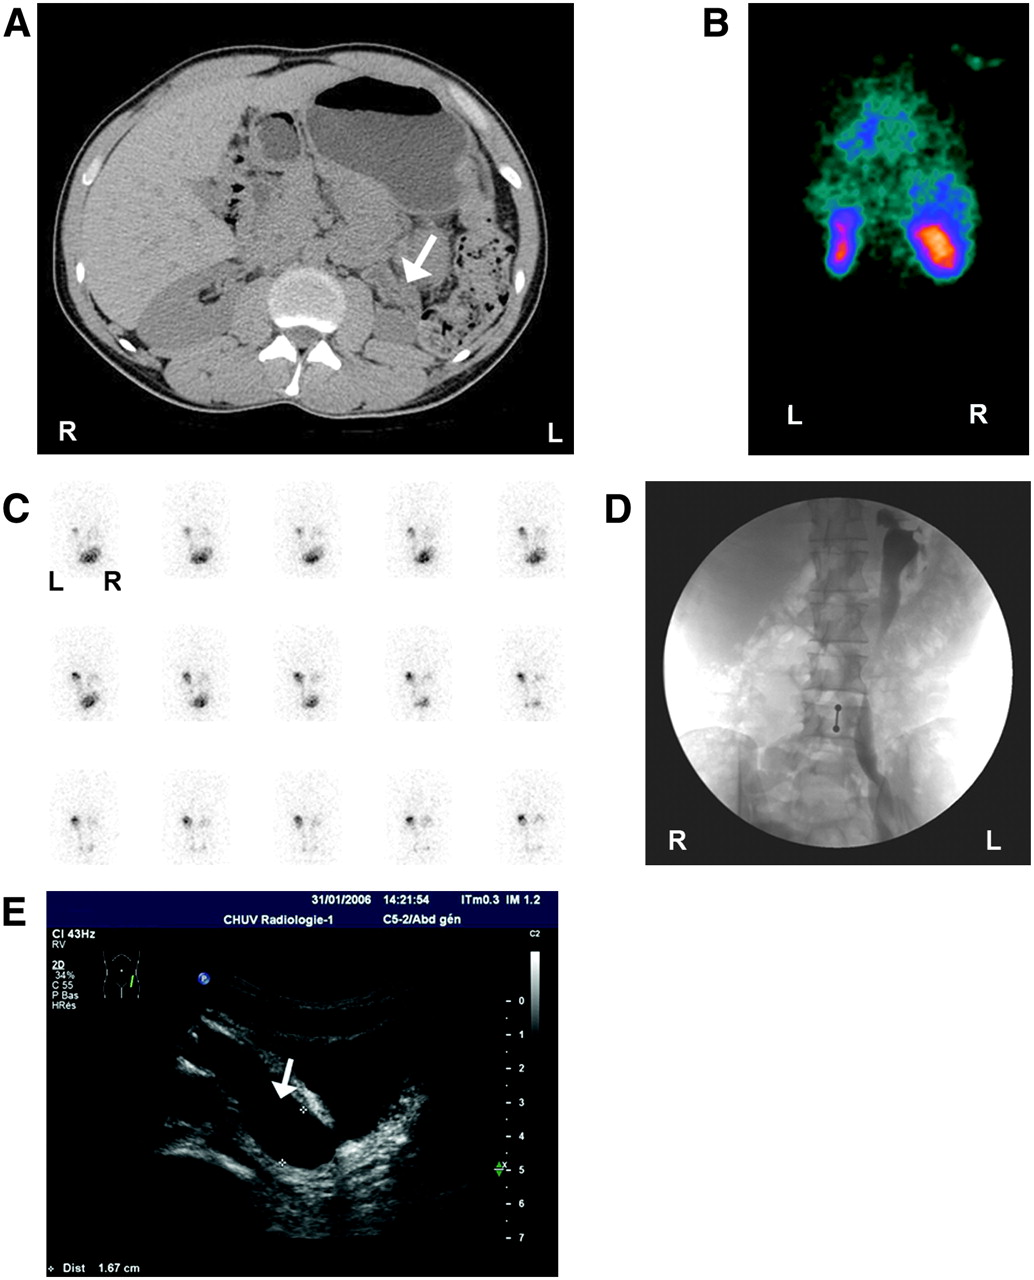
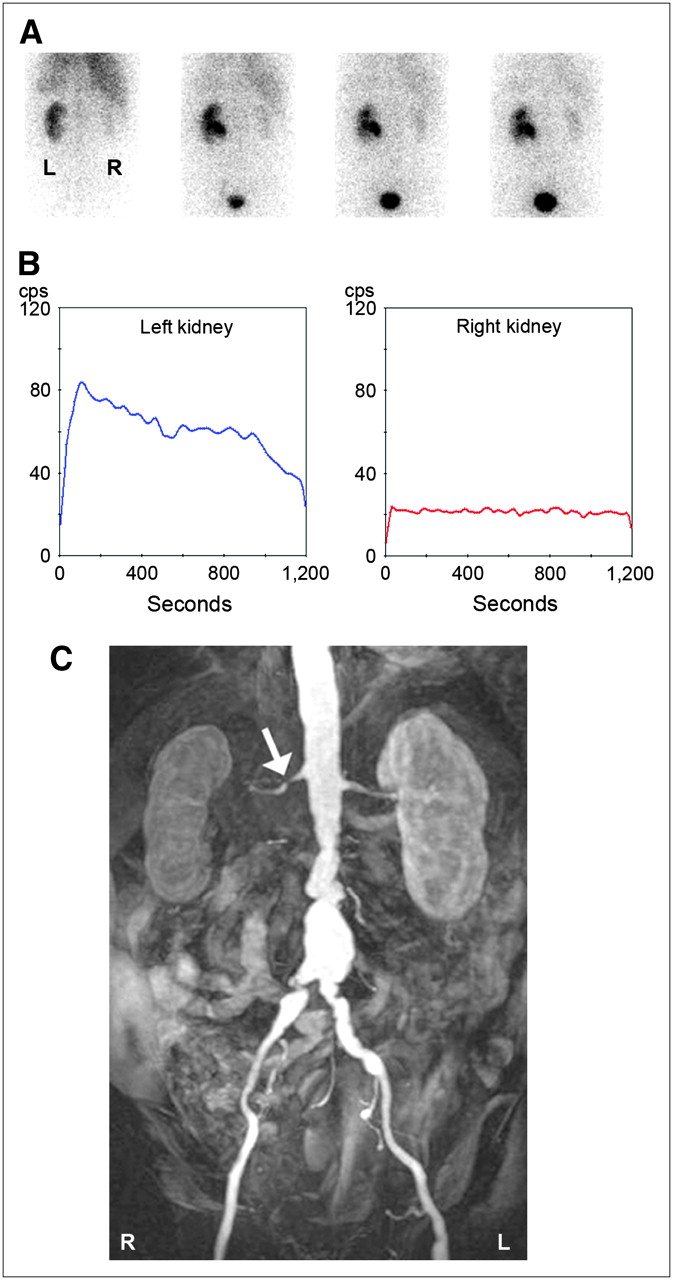
25-y-old patient with chronic renal insufficiency due to reflux nephropathy. (A) CT scan shows atrophic left kidney (arrow) with dilated pelvis. (B) First-minute parenchymal image shows small scarred left kidney and also upper and lower parenchymal defects of right kidney (differential renal function: left, 31%; right, 69%). (C) Indirect radionuclide cystography shows massive left VUR. (D) VCUG shows massive left pyeloureteral reflux. (E) Sagittal sonogram shows dilatation of distal left ureter (arrow).
Nonradionuclide Imaging
The reference method for the diagnosis and grading of VUR is VCUG, which also provides anatomic information. The intensity of reflux is assessed by the universally applied international grading system (Table 3) (46). Major drawbacks of VCUG are the radiation dose delivered to the child, mostly because of the fluoroscopic monitoring, and the invasiveness of the procedure, which requires bladder catheterization. Some authors have found reliable results for VCUG without fluoroscopic monitoring, thus decreasing the total delivered radiation dose by up to 80% (47). More recently, echo-enhanced voiding urosonography, indirect voiding urosonography, and magnetic resonance voiding cystography have been investigated in children for the detection of VUR (48–50). These methods offer the advantage of investigating VUR without radiation. Cyclic echo-enhanced voiding urosonography requires bladder catheterization and the use of an echo-enhancing agent. VUR is revealed by the detection of hyperechogenic microbubbles in the ureter (grade I), in the renal pelvis (grade II), and in a dilated renal pelvis (grade III). The detection rate has been reported to be better for cyclic voiding urosonography than for a single cycle (48). Indirect voiding urosonography avoids bladder catheterization and is based on the indirect detection of VUR by measuring the renal pelvic anteroposterior diameter or the ureter both at baseline and during voiding. Encouraging results were observed in high-grade VUR, but sensitivity was low in low-grade reflux (49). Magnetic resonance voiding cystography requires transurethral catheterization in order for the bladder to be filled with a gadolinium solution, and in children, sedation is required for the acquisition (50). Pre- and postvoiding sequences are obtained in coronal projections. Sequences with T2 weighting provide morphologic information on the urinary tract and estimate the residual volume of the bladder, whereas T1-weighted images acquired during bladder filling and after voiding allow detection of VUR. This method offers the potential of combining an anatomic and functional evaluation of the renal parenchyma and urinary tract, potentially including VUR. It has several limitations that are technical or linked to the necessity of sedation, the lengthiness of the procedure, and the inability to demonstrate VUR during voiding. There is not yet enough evidence that any of these methods can replace conventional VCUG.
Reflux Classification
Prenatally Detected VUR
VUR is diagnosed because of persistent postnatal hydronephrosis in 9%–15% of infants with prenatally detected hydronephrosis by VCUG performed during the first week of life (18,41). Direct radionuclide cystography may replace VCUG in girls because urethral anatomy is not questioned except in cases of complex malformations (21). Prenatally detected VUR is more frequent in boys and is associated with poorly functioning kidneys in 15%–30% of infants without a previous history of UTI, possibly because of developmental anomalies (41). Spontaneous resolution is expected to occur during the first 2 y of life and is more frequent in low-grade reflux. Despite antibiotic prophylaxis, UTI is observed in 4%–28% of infants, irrespective of sex or grade of reflux, and is probably related to bladder dysfunction. Renal parenchymal scarring is a major risk for the long-term complication of reflux, and some authors have proposed reliance on DMSA scintigraphy rather than VCUG as the first indicator for chemoprophylaxis (30). In an editorial, Elder emphasized the trauma associated with either VCUG or direct radionuclide cystography and discussed the possibility of reducing the number of follow-up studies for these children and of avoiding unnecessary VCUG when the probability of VUR is low—that is, after open antireflux surgery or when the voiding pattern is normal (44). In such situations, indirect radionuclide cystography may be preferred.
UTI and VUR
In older children, reflux is generally diagnosed after the first febrile UTI or in cases of recurrent UTIs. The association between VUR and renal scarring is still a matter of debate, and controversial results have been published. Some authors found a strong correlation between the grade of VUR and renal scars; others have found normal late DMSA findings in up to 84% of VUR kidneys (51,52). Long-term prognosis is related to hypertension and to renal parenchymal loss due to scarring. On the basis of their observation, some authors have proposed that late 99mTc-DMSA scanning be performed only for children diagnosed with VUR, because they were found to be at higher risk of developing renal scars (51). Others proposed relying on the findings of DMSA performed 3–6 mo after the first febrile UTI to select those children who may benefit from cystography (52). The timing and frequency of follow-up examinations may vary depending on institutional policy.
RVH
RVH, seen in about 3%–5% of all patients with hypertension, is caused by renal hypoperfusion with secondary activation of the renin–angiotensin system and is generally due to a stenotic or obstructive lesion within the renal artery. RVH is more frequently observed in a selected population, affecting up to 15%–30% of patients referred for refractory hypertension (53). Detection of RVH is important because, with repair of the renal artery lesion, it is a potentially curable cause of hypertension. However, not all cases of renal artery stenosis (RAS) are responsible for RVH, and primary hypertension may coexist with RAS. Thus, RVH can be diagnosed only retrospectively, once blood pressure returns to normal levels or if blood pressure is easier to control after the renal artery obstruction has been corrected (54).
In most cases (70%–90%), RAS is due to atherosclerosis progressively affecting the ostium and proximal third of the main renal artery lumen, as is commonly seen in older men (54). Complete lumen occlusion of the renal artery is rare, however. The other 10%–30% of cases of RAS are due to fibromuscular dysplasia (FMD), a noninflammatory process of unknown origin usually involving the vascular wall (most often the media) of the distal two thirds of the renal arteries and predominantly seen in young female patients (54). FMD has a characteristic “string-of-beads” appearance on renal angiography (Fig. 5C) and a good outcome after renal artery percutaneous angioplasty (55). In infants, RVH may also be caused by renal artery thrombosis after umbilical artery catheterization or coarctation of the aorta. RVH is a consequence of activation of the renin–angiotensin system with concomitant release of angiotensin II (a vasoconstrictor) and aldosterone (leading to plasma volume expansion) to maintain physiologic renal perfusion by increasing blood pressure (56). Yet, in the chronic phase of RVH, pharmacologic blockade of the renin–angiotensin system has been shown to be less effective and hypertension may become fixed and persist after relief of the obstruction. Selecting the hypertensive patient who should undergo a work-up for RVH is notoriously difficult. Clinical features traditionally associated with RVH are abdominal bruits; a rapid onset of the hypertension, which may be severe (diastolic blood pressure > 120 mmHg) and refractory to optimal pharmacologic treatment; unilateral renal atrophy; azotemia, especially when worsened by angiotensin-converting enzyme (ACE) inhibitors or angiotensin receptor blockers; and unexplained azotemia or hypokalemia (due to an aldosterone excess) (54). Episodes of flash (rapidly progressive) pulmonary edema have been observed with RVH in patients with relatively well-preserved systolic function, because of failure of the contralateral kidney to correct for volume expansion (57). Clinical suspicion alone is not sufficiently accurate in selecting patients for invasive renal angiography, and a noninvasive test is usually proposed first. Unfortunately, no optimal test exists that would be noninvasive, simple to perform, quick, reliable, sensitive, and specific.

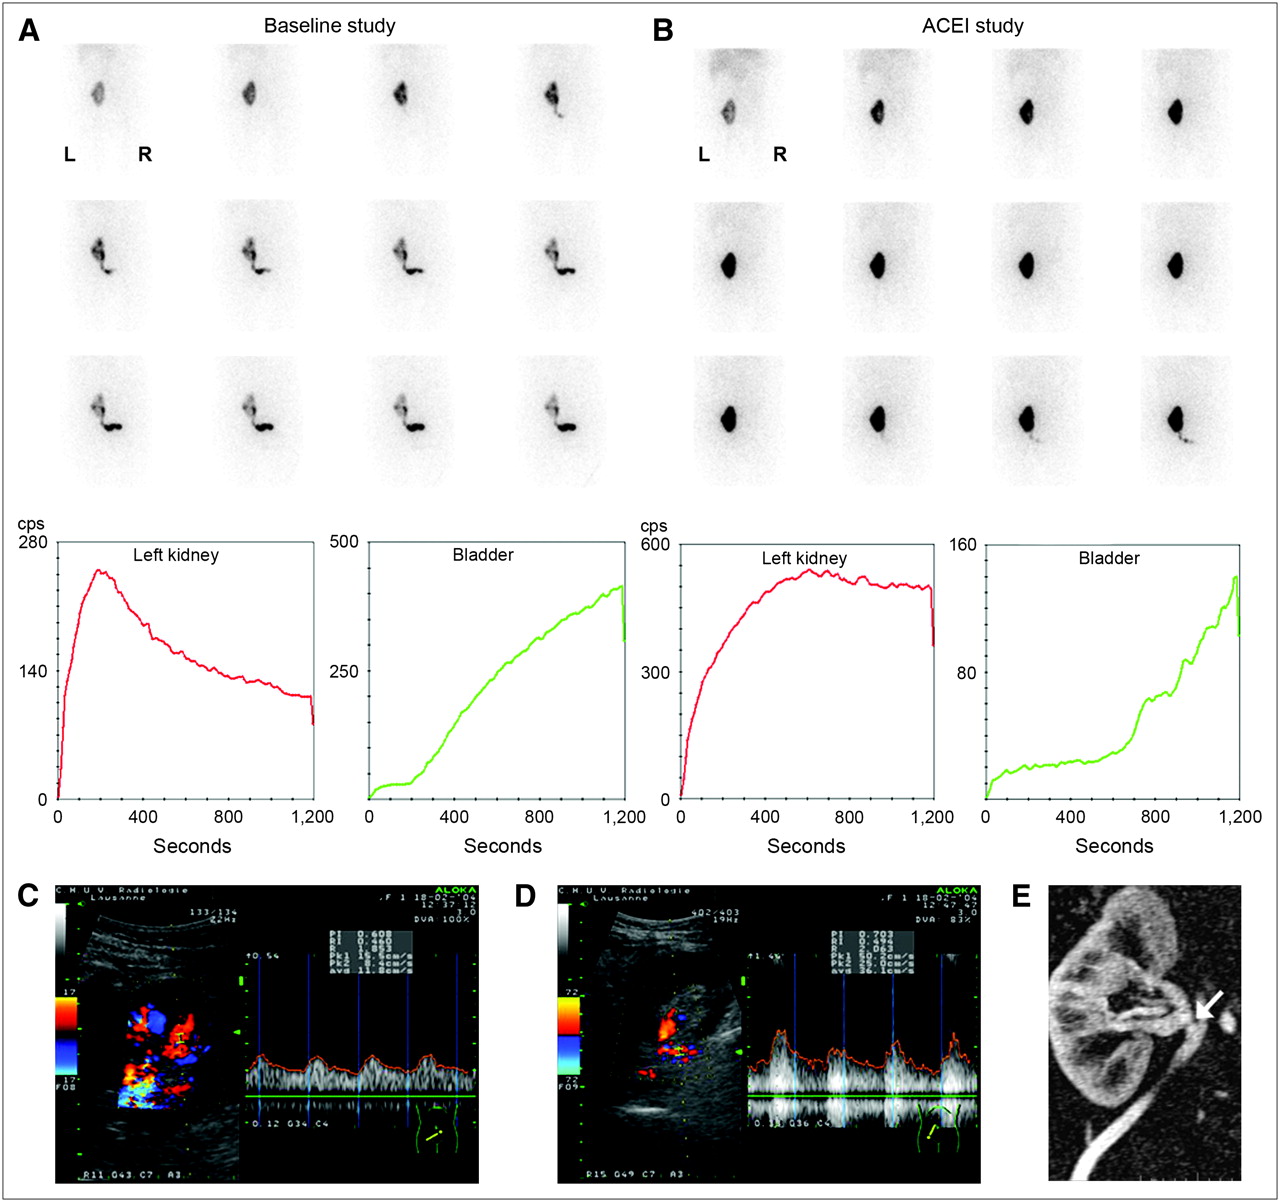
Stenosis related to FMD in 35-y-old man. (A) ACE inhibitor renography shows 1-min images of radiotracer uptake (99mTc-MAG3). Right kidney is performing 95% of the renal function, which was decreased (tubular extraction rate, 160 mL/min/1.73 m2). (B) Time–activity curves of left (blue) and right (red) kidneys show almost no participation of the left kidney to renal function. (C) Angiogram shows irregular stenosis (arrow) and beading (arrowheads). (D) Color Duplex sonography of peripheral artery of left kidney demonstrates parvus–tardus pattern with collapsed resistance index (0.35). (E) In contrast, right kidney shows normal Doppler spectrum.
Although renal angiography has been regarded as the gold standard for revealing the presence of a stenosis, this risk-carrying invasive procedure provides no information on the functional significance of the lesion and should be undertaken only for percutaneous transluminal angioplasty or for patients in whom suspicion is high (56). Over the years, many methods have been developed to diagnose renal artery obstructions, and their relative merits are summarized in Table 4 (58–62). Most comparison studies have considered a 50% stenosis of the renal artery to be the threshold for hemodynamic significance. There is, however, no clear evidence for this arbitrarily chosen lumen-narrowing threshold, and for a stenosis of less than 50%, hemodynamic abnormalities have been found that may also attain clinical significance for changes in renal function (63). The question of whether a lesion is significant in a particular patient is clinically relevant because of the association with coronary events and mortality (64).
Methods for Detection of Renal Artery Obstructions
Captopril-enhanced renography has been standardized, and criteria for the diagnosis of RVH are well defined (61,65). The main use of this functional test is to determine which patients can expect normalization of blood pressure or improvement of blood pressure control after revascularization (56). The principle is simple: ACE inhibitors reduce the conversion of angiotensin I to angiotensin II, thereby diminishing the vasoconstriction of the postglomerular efferent arteriole and decreasing the GFR, which can be detected by scintigraphy (Figs. 5–8⇓⇓) (61). Some authors have tried to use angiotensin II receptor, subtype 1, blockade but have found no clear advantage over conventional ACE inhibition (66). Both glomerulus-filtered (99mTc-DTPA) and tubule-secreted (99mTc-MAG3 or 123I-OIH) radiopharmaceuticals are currently used; in azotemic patients, tubular tracers are preferred over 99mTc-DTPA because of a more efficient extraction (61). For patients receiving chronic ACE inhibitors (or angiotensin receptor blockers by analogy), it is recommended that ACE inhibition be discontinued 4–7 d before renography (with substitution by amlodipine or labetalol, if needed), because the sensitivity of ACE inhibitor renography could be reduced. It is also preferred that diuretics and calcium channel blockers be discontinued. Administration of furosemide during renography (F+0), leading to forced diuresis and increased washout of the radiopharmaceutical from the distal nephron, renal calices, and pelvis, may facilitate detection of renal parenchymal retention and possibly improve accuracy, particularly with tubular agents such as 99mTc-MAG3 or 123I-OIH. Commonly used ACE inhibitors are captopril (25–50 mg) taken orally about 60 min before renography or enalaprilat (40 μg/kg; maximum, 2.5 mg) administered intravenously over 3–5 min more than 15 min before the beginning of renography—the latter being associated with a higher risk of hypotension (61). At our center, we monitor blood pressure and heart rate for 30 min after enalaprilat infusion and before giving furosemide and have had to report only a few episodes of mild hypotension in more than 15 y. Known pitfalls leading to erroneous results are food ingestion within 4 h before receiving captopril, infiltration, dehydration, hypotension, or a full bladder impairing drainage (61). Association with baseline findings increases specificity, and baseline testing should be performed in patients with reduced renal function, known asymmetry, or a single kidney (Fig. 8).

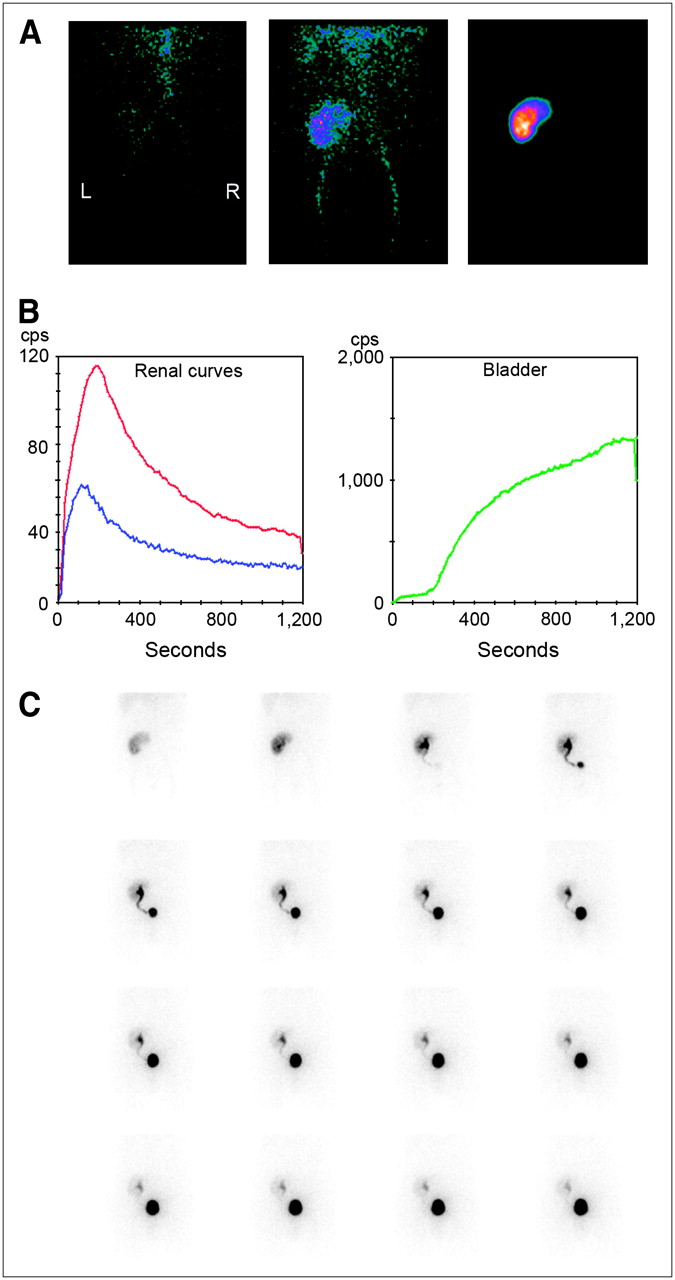
RAS in 63-y-old man with chronic renal insufficiency (creatinine clearance, 40 mL/min) and subrenal aortic inflammatory aneurysm with right renal hydronephrosis due to ureter compression. (A) On ACE inhibitor renography with 123I-OIH, images obtained at 1, 6, 11, and 16 min (from left to right) after injection show poor function of right kidney, assuming only 10% of total renal function. (B) Time–activity renal curves were identical to baseline (not shown). (C) Coronal 3-dimensional MRA image demonstrates short stenosis on right renal artery (arrow).

RAS due to atherosclerosis in 75-y-old woman. Baseline renography with 123I-OIH (A) and ACE inhibitor renography (B) show delayed renal parenchymal uptake in right kidney, as compared with baseline (images taken at 1, 6, 11, and 16 min [from left to right] after injection). (C) Angiogram shows narrow stenosis at ostium of right renal artery (arrow). (D) Angiogram performed after angioplasty demonstrates successful dilatation of vessel (arrow). (E) Coronal 3-dimensional CT shows regular-sized reshaped vessel, with presence of stent (arrow). ACEI = ACE inhibitor.

Graft dysfunction 1 d after transplantation in 41-y-old woman. Baseline renography (A) and ACE inhibitor renography (B) show prolonged tracer transit in renal parenchyma on images and on renal and bladder curves, as compared with baseline. (C) Color duplex sonographic assessment of intrarenal vessels shows parvus–tardus pattern. (D) Color duplex sonographic exploration of renal artery demonstrates disturbance of flow. (E) Coronal 3-dimensional MRA image shows short narrowing of renal artery (arrow) at site of anastomosis. Laparotomy revealed kinking of renal artery graft. ACEI = ACE inhibitor.
Clinical practice has been shifting, and ACE inhibitor enhanced renography now is rarely used as the primary imaging tool but, rather, is used after abnormal results in favor of an RAS have been found on magnetic resonance angiography (MRA) or CT angiography or sonography (67). In fact, ACE inhibitor renography is most reliable in predicting recovery in patients with FMD, who are likely to respond to revascularization. In these patients, renography by assessing the function of the affected kidney may contribute to the decision on therapeutic management, revascularization, or medical treatment. Revascularization of a stenosed renal artery will not change the fate of a nonfunctioning or very poorly functioning kidney (Figs. 5 and 6).
Considerable debate exists over the relative accuracy of the various imaging tools in diagnosing RAS. In a large meta-analysis of 55 studies conducted from 1990 to 2000, Vasbinder et al. showed that CT angiography and gadolinium-enhanced MRA seemed to work better than sonography and ACE inhibitor renography (68). These results are subject to the limitations recognized by the authors regarding a possible underestimation by functional tests such as captopril renography because of the use of an anatomic gold standard (intraarterial angiography) and differences in analytic method (on a per-individual-artery basis for CT and MRA vs. a per-patient basis for renal scintigraphy). Moreover, because these studies did not use the latest multidetector CT and MRI improvements, the superiority of one technique over the other remains unresolved and a matter of ongoing debate.
Integrating the current strengths and limitations of each modality, a typical diagnostic work-up for RVH would start with a radiologic technique. Depending on local expertise and availability, this technique could be Doppler sonography, CT angiography (better availability and spatial resolution than MRA), or MRA (especially in patients with intolerance to iodinated contrast agents). If the results of initial investigations are negative, RAS can reasonably be excluded. If initial findings are positive, ACE inhibitor renography can be performed, followed by renal angiography and treatment (Fig. 7). If FMD is suspected on the basis of clinical features, Doppler sonography or ACE inhibitor renography can be recommended as the initial test, given the known limitations of CT and MRA for distal renal angiography. For a patient who was previously treated for RAS and in whom recurrent stenosis is suspected, it would be acceptable to proceed directly to renal angiography with the aim of revascularization (67). Although the use of captopril-enhanced tests is decreasing, it would still be useful to select patients with bilateral RAS or a single functioning kidney who could benefit from treatment with ACE inhibitors or angiotensin receptor blockers without a risk of precipitating renal insufficiency. Additionally, ACE inhibitor renography may identify other causes mimicking RAS, such as pyelonephritis, malignant hypertension (acute tubular necrosis pattern on renography), renal artery embolism, renal vein thrombosis, or renal insufficiency. If ACE inhibitor renography shows normal findings in patients with normal renal function, RVH can reasonably be excluded and no baseline study needs to be performed; if baseline GFR is severely diminished (for example, in a patient with nonfunctioning kidneys), ACE inhibitor renography is not contributive and does not need to be performed (Figs. 5 and 6).
Treatment of RVH is divided among drug therapy, percutaneous transluminal renal angioplasty, and surgical intervention (54). Despite the absence of randomized controlled studies on treatment outcome, there is evidence nonetheless that stent placement for atherosclerotic RAS—a safe procedure significantly preventing restenosis—has a positive impact on blood pressure, renal function, and left ventricular hypertrophy, especially if RAS is bilateral in patients without chronic renal insufficiency or if optimal medical therapy cannot adequately control the blood pressure (53–55). Several trials are currently under way to compare benefits in terms of renal function and survival of the different treatment modalities, be they surgical, endovascular stent based (with or without drug elution), or conservative (ACE inhibitors or angiotensin receptor blockers) (54). Functional testing for RVH seems to better predict therapeutic outcome than does renal angiography (69).
In the future, methods such as MRI perfusion measurements (magnetic resonance renography) may offer comprehensive assessment of renovascular and renoparenchymal diseases (70). Furthermore, studies comparing diagnostic modalities for RVH should use the normalization of blood pressure or GFR in patients with abnormal renal function after successful revascularization as study endpoints rather than the ability to assess the angiographic degree of renal artery obstruction. At this point, functional assessment of RVH with methods such as ACE inhibitor renography may have an incremental predictive value over anatomic detection of renal artery obstruction in selected patients at increased risk. The true potential of ACE inhibitors among other contemporary imaging modalities would need to be revealed by a well-designed prospective study.
RENAL TRANSPLANTATION
The role of radionuclide renography has changed in recent years because of improvements in other functional imaging techniques, namely Doppler sonography, MRI, and multislice CT. However, the recommendations of the Radionuclides in Nephrourology Committee for the evaluation of transplanted kidneys with radioactive tracers are still valid (71). The most important change in diagnostic management since 1999, when that paper was published, has been the much more extensive use of renal biopsies in cases of unclear graft dysfunction (72).
Any recognized method that includes a flow study, sequential images of the kidneys and urinary tract, prevoiding, postvoiding, and, if appropriate, bladder images; time–activity curves, and quantitative data on perfusion, function, and tracer transit can be used (Fig. 9). For flow studies, it is important to perform a good bolus injection of 99mTc-labeled MAG3, DTPA, or 123I-OIH. Quantitative perfusion indices refine the analysis, but visual interpretation of fast images (1-s frames) and time–activity curves may be sufficient in the clinical situation, especially if Doppler flow data are available. It is, however, mandatory to quantify renal function either by concomitant measure of plasma clearance—effective renal plasma flow, GFR, or tubular extraction rate—or by quantitative analysis of the renogram. Several methods have been validated and can be used. Each center should locally validate the method chosen and perform strict quality controls on measurement of activity in the syringe before and after injection, detection of tissue infiltration during injection, bolus quality, renal depth, and data processing and should document the results. In patients with very reduced function and oligoanuria, 99mTc-MAG3 should be used with caution for the diagnosis of potential urinary complications, because bowel activity can obscure urinary stasis or leakage on late images. We recommend measuring urinary output during studies with pharmacologic intervention (diuretic challenge or angiotensin-converting enzyme inhibition). For diuretic challenge, we most often use the F+0 method, by injecting, unless clinically contraindicated, 20–40 mg of furosemide immediately after the tracer (4). Measuring urinary output quantifies the diuretic effect, which can then be considered when interpreting the renogram. In cases of ACE inhibition, diminished diuresis is a subtle sign of decreased glomerular perfusion pressure under angiotensin II blockade. To ensure that the diminished diuresis is of renal and not urinary origin, we include furosemide administration in our ACE inhibitor protocol. To standardize as many parameters as possible, we perform the challenge with intravenous administration of enalaprilat and hydrate the patients intravenously. Such a protocol requires strict monitoring of hemodynamic and clinical parameters before, during, and after the study. The interpretation of renograms in patients under ACE inhibition is identical to that in patients with native kidneys (61).

Normal camera-based renography findings 5 d after transplantation of related-donor kidney: the first two 10-s perfusion images (left and middle) and the 1-min parenchymal image (right; upper pole irregularity is due to graft position) (A); whole kidney (red), cortical kidney (blue), and bladder curves (B); and sequential 1-min images (C). Somewhat prolonged visualization of ureter is due to postoperative hypotony, frequently observed during first days after transplantation.
The main indications for performing γ-camera–based radionuclide renography in patients with renal allografts are indicated in Table 5. Delayed graft function affects 5%–10% of recipients regardless of procurement technique. The main risk factors are higher recipient and donor age, prolonged cold ischemia, and mismatched donors (73,74). Besides acute tubular necrosis in cadaver transplants, the most important reasons for delayed graft function are acute rejection and vascular or urologic complications. Delayed function is significantly associated with reduced GFR and higher blood pressure at 1 y after transplantation and, furthermore, is associated with an increased incidence of acute rejection and reduced graft survival (74). It is thus important to quickly recognize the reason for the delay and initiate appropriate treatment. If acute tubular necrosis is quite characteristic, with conserved perfusion and delayed urinary output with cortical tracer retention, it may be impossible to distinguish nephrotoxicity due to calcineurin or other drugs from that due to rejection or RAS.
Indications for Renography in Transplantation
Sonography is the method of choice for first-line evaluation of renal graft dysfunction. Widely available, even for bedside examinations, sonography has the potential to distinguish surgical from medical complications. Surgical complications include RAS or renal artery thrombosis, renal vein thrombosis, fluid collections, and urinary obstruction. Renal artery or vein thrombosis is an urgent indication for thrombectomy, but graft loss is nevertheless frequent (75). Medical complications are related to parenchymal anomalies, such as acute rejection, acute tubular necrosis, or drug toxicity. These anomalies elevate the intrarenal resistance index ([peak systolic frequency shift – end diastolic frequency shift]/peak systolic frequency shift) measured with Doppler sonography, but this elevation remains unspecific. If performed, renography must be available on an emergency basis. Nonvisualization of the graft is an important sign of irremediable loss of function. Rejection or ischemia due to RAS may sometimes not easily be distinguished by renography. In unclear cases, renal biopsy is the method of choice to diagnose rejection. The use of sonographic guidance for such procedures allows safe placement of the biopsy needle. Transplant RAS has been reported to occur in 1%–23% of renal allografts and significantly affects long-term graft outcome. Predisposing factors include cytomegalovirus infection, initial delayed graft function, acute rejection, atherosclerotic changes, and prolonged cold ischemia (76). RAS may be diagnosed noninvasively by Doppler sonography, MRI, or multidetector CT, which provides high-resolution images of the kidneys, vessels, and urinary tract but requires adequate renal function to allow injection of contrast medium. Renography under ACE inhibition (61) helps determine whether arterial hypertension is dependent on the renin–angiotensin system and thus contributes to the management, conservative or invasive, of RAS detected by other imaging methods (Fig. 8). Besides radionuclide renography, MRI can also be used to quantitatively assess renal function (77), but this use is not yet widespread in everyday practice.
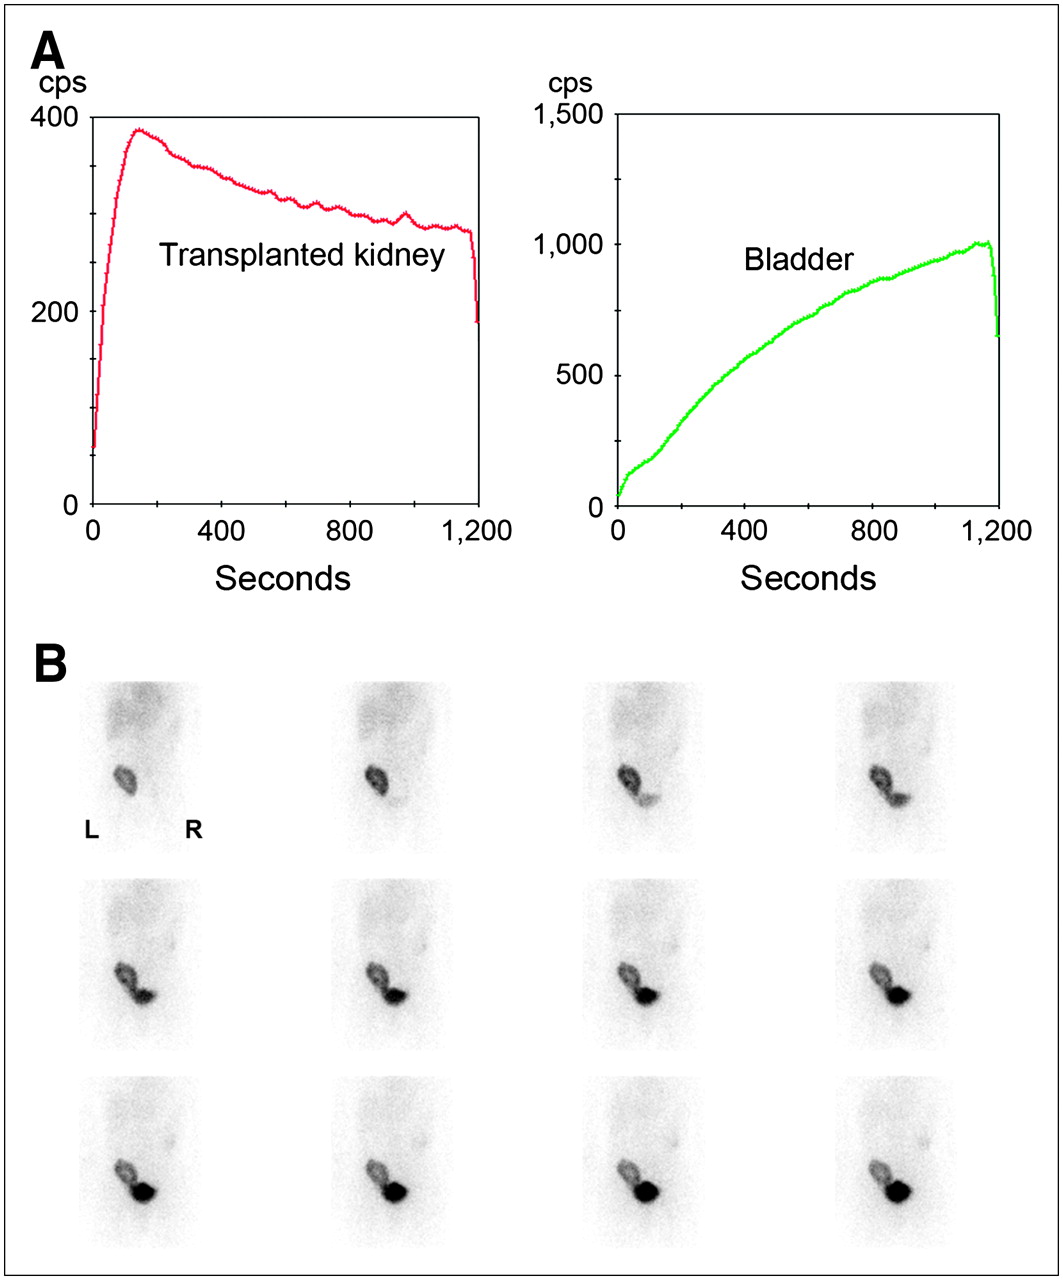
Urinary complications occur in 2.5%–14.1% of recipients (78). Radionuclide renography has an important role to play in the diagnosis of such a complication, be it an obstruction or a leak (Fig. 10). Early after transplantation, especially if such a complication occurs, urinary output may be low and the urinary volume retained or leaked will consequently be small. The high activity per unit volume of urine allows the detection of obstruction and leaks with high sensitivity and specificity, even when kidney function is reduced (79).
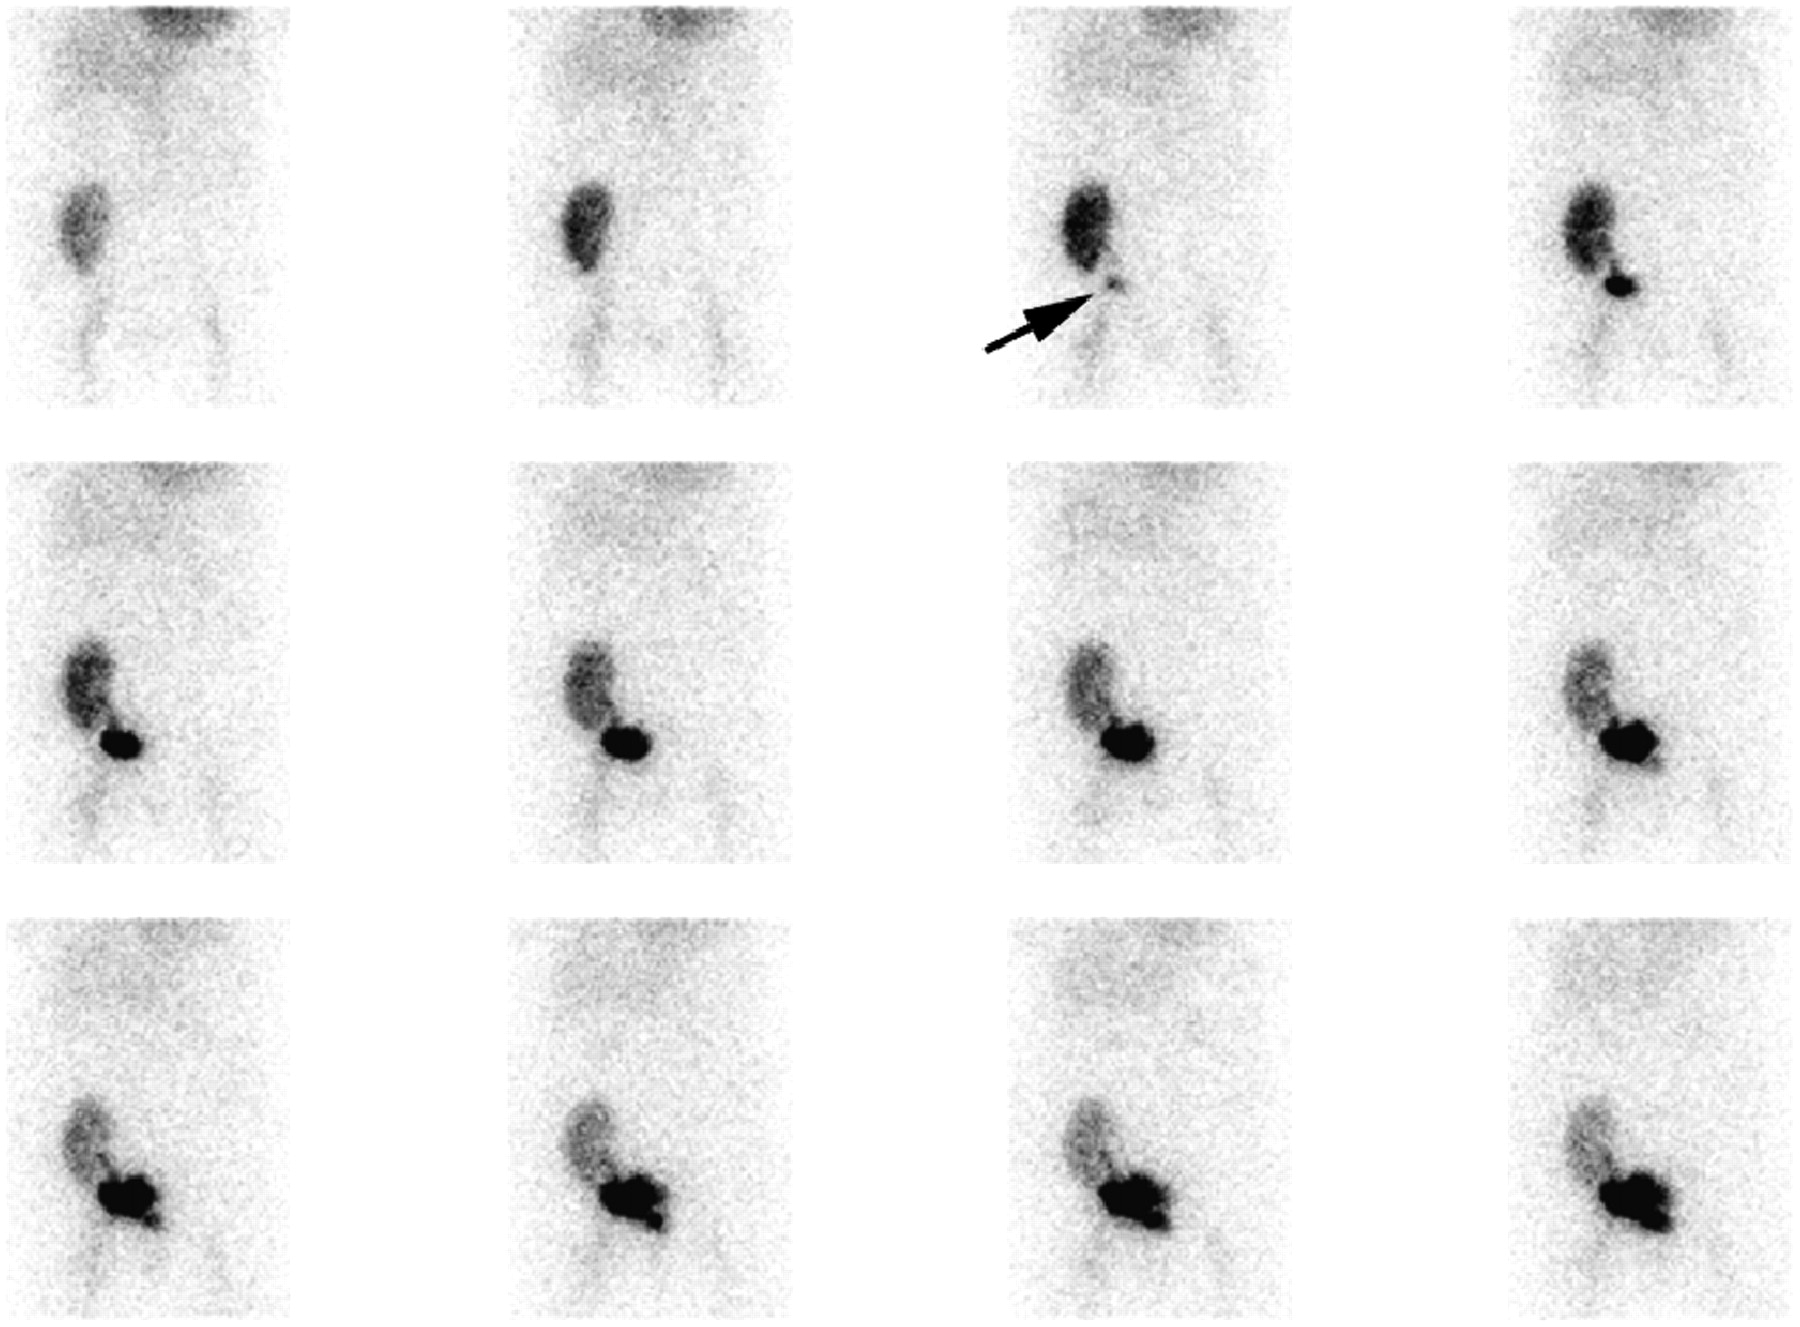
One-minute images after injection of 99mTc-MAG3. Images were obtained 6 d after transplantation because of sudden anuria and abdominal pain. Starting with third image, irregularly shaped urinary collection suggestive of urinary leak appears (arrow). Reintervention revealed necrosis of distal ureter and confirmed urinary leak. After resection and reanastomosis of ureter, course was uneventful.
Cyclosporine A has been the basis of immunosuppressive therapy for the last 20 y. Because of side effects such as an increased incidence of hypertension, nephrotoxicity, neurotoxicity, hyperlipidemia, and hirsutism, cyclosporine A therapy tends now to be replaced by tacrolimus-based protocols (80). A recent comparative study between patients treated with newer preparations of cyclosporine A or tacrolimus did not show, except for blood pressure, a significantly poorer outcome for the cyclosporine A group over the long term (81). Diagnosis of calcineurin inhibitor toxicity may be difficult and is often made by exclusion of other causes of graft function impairment, especially since several concomitant pathologic states often are present. Cyclosporine A seems to induce a renal vasomotor effect: probably a constriction of the afferent arteriole of the glomerulus that reduces renal perfusion and consequently renal function. Radionuclide renography and sonography, including Doppler flow studies, often cannot accurately distinguish perfusion impairment due to calcineurin inhibitor renal toxicity from that due to early-stage acute rejection. By integrating all available information (clinical presentation, color Doppler sonography, perfusion, transit times, presence or absence of outflow impairment on renography, dosage of immunosuppressive drugs), one may build a probability diagnosis (Fig. 11). Attempts have been made to diagnose rejection specifically by measuring increased uptake of 99mTc-labeled OKT3, an antibody directed against the CD3 antigen on T cells and used as an immunoregulation agent to prevent graft rejection (82). This method, as well as imaging with labeled platelets (83), has so far not been widely accepted in the management of transplant patients. A biopsy showing thrombotic microangiopathy in the early stage of calcineurin inhibitor toxicity or widespread interstitial fibrosis after chronic exposure (72,80) may be the only means to assess the diagnosis and to take the proper therapeutic steps.

Patient with decreased graft function 5 mo after transplantation of living-donor kidney. Creatinine level was 219 μmol/L. (A) Renogram shows an 123I-OIH accumulation within normal limits, a normal peak, but delayed elimination. Normal uptake and peak are unlikely to be seen in acute rejection. (B) Corresponding 1-min images reveal tracer retention in parenchyma without outflow impairment, suggesting potential calcineurin inhibitor toxicity; normal Doppler sonography findings made RAS unlikely. Biopsy showed thrombotic microangiopathy. After change of immunosuppressive therapy from tacrolimus to sirolimus, creatinine returned to baseline level (140 μmol/L).
Chronic allograft nephropathy leading to progressive decline of renal function and, finally, graft loss is probably is not due to a single specific cause but has several known risk factors related to the donor, the recipient, the transplant, and comorbid conditions (84). Except at the end stage, renographic curves usually show quite preserved transit times but decreased amplitude due to decreased function. Thus, renography is usually not performed to determine the reason for a progressive loss of function but to monitor function and, especially, to detect a potentially treatable cause of a sudden rise in serum creatinine, such as urinary tract abnormalities or obstruction, VUR with or without UTI (85), or RAS.
CONCLUSION
The role of nuclear medicine procedures is well recognized in the investigation of both renal parenchymal function and upper urinary tract abnormalities. The radiation burden is low, and the procedures do not require sedation or special patient preparation and are easy to perform. Knowledge of renal pathophysiology and recognition of the limitations and technical pitfalls are essential to provide the clinician with valuable data on the perfusion and function of individual kidneys and on urinary tract dynamics. As long as the role of scintigraphy is well understood and clearly defined among the other available methods of evaluating urinary tract anomalies, radionuclide studies of the kidneys and urinary tract will continue to supply unique information that is important for patient management and care in nephrourology.
Acknowledgments
We thank Jacqueline Rivar for editorial assistance.
Footnotes
-
↵* NOTE: FOR CE CREDIT, YOU CAN ACCESS THIS ACTIVITY THROUGH THE SNM WEB SITE (http://www.snm.org/ce_online) THROUGH NOVEMBER 2007.
-
↵† Contributed equally to this work.
-
COPYRIGHT © 2006 by the Society of Nuclear Medicine, Inc.
References
- 1.↵
- 2.↵
- 3.
- 4.↵
- 5.↵
- 6.↵
- 7.↵
- 8.↵
- 9.↵
- 10.↵
- 11.↵
- 12.↵
- 13.↵
- 14.↵
- 15.
- 16.↵
- 17.↵
- 18.↵
- 19.↵
- 20.↵
- 21.↵
- 22.↵
- 23.↵
- 24.↵
- 25.↵
- 26.↵
- 27.↵
- 28.↵
- 29.↵
- 30.↵
- 31.↵
- 32.↵
- 33.↵
- 34.↵
- 35.↵
- 36.↵
- 37.↵
- 38.↵
- 39.↵
- 40.↵
- 41.↵
- 42.↵
- 43.↵
- 44.↵
- 45.↵
- 46.↵
- 47.↵
- 48.↵
- 49.↵
- 50.↵
- 51.↵
- 52.↵
- 53.↵
- 54.↵
- 55.↵
- 56.↵
- 57.↵
- 58.↵
- 59.↵
- 60.↵
- 61.↵
- 62.↵
- 63.↵
- 64.↵
- 65.↵
- 66.↵
- 67.↵
- 68.↵
- 69.↵
- 70.↵
- 71.↵
- 72.↵
- 73.↵
- 74.↵
- 75.↵
- 76.↵
- 77.↵
- 78.↵
- 79.↵
- 80.↵
- 81.↵
- 82.↵
- 83.↵
- 84.↵
- 85.↵
- Received for publication April 17, 2006.
- Accepted for publication June 19, 2006.


