


Abstract
The purpose of our study was to assess the usefulness of integrated PET/CT using 18F-FDG for distinguishing thymic epithelial tumors according to the World Health Organization (WHO) classification. Methods: Thirty-three patients (age range, 34–68 y; mean age, 54.6 y) with thymic epithelial tumors, who underwent both integrated PET/CT and enhanced CT, were included. The clinicopathologic stages, maximum standardized uptake values (SUVs), and uptake patterns of tumors on integrated PET/CT images, and various enhanced CT findings, are described according to the simplified (low-risk [types A, AB, and B1] and high-risk [types B2 and B3] thymomas and thymic carcinomas) subgroups of the WHO classification. Discriminant analysis was performed to determine the relative capabilities of integrated PET/CT and enhanced CT findings to differentiate tumor subgroups. Results: Tumors included 8 low-risk thymomas, 9 high-risk thymomas, and 16 thymic carcinomas. The maximum SUVs of high-risk thymomas (P < 0.001) and low-risk thymomas (P < 0.001) were found to be significantly lower than those of thymic carcinomas. Homogeneous 18F-FDG uptake within tumors was more frequently seen in thymic carcinomas than in high-risk thymomas (P = 0.027) or low-risk thymomas (P = 0.001). The uptake pattern (homogeneous vs. heterogeneous) on integrated PET/CT images and the presence of mediastinal fat invasion on enhanced CT images were found to be useful for differentiating tumor subgroups. In addition, integrated PET/CT helped detect lymph node metastases, which were not identified on enhanced CT in 2 patients. Conclusion: Integrated PET/CT was found to be useful for differentiating subgroups of thymic epithelial tumors and for staging the extent of the disease.
Thymic epithelial tumors consist of several histologic subtypes—that is, thymoma types A, AB, B1, B2, and B3 and thymic carcinoma—in increasing order of malignancy (1). Thymoma types A and AB generally behave like benign tumors, whereas type B1 is a low-grade malignant tumor (10-y survival rates of >90%), type B2 shows a higher degree of malignancy, and type B3 in the advanced stage shows a poor prognosis, similar to that of thymic carcinoma and the malignant tumors of other organs (1). According to one study of a large number of thymic epithelial tumors, the overall survival rates of patients with type A, AB, or B1 tumors are higher than those of patients with type B2 or B3 tumors (2).Therefore, in the present study, we attempted to simplify the World Health Organization (WHO) histologic classification of thymic epithelial tumors into 3 subgroups—that is, low-risk thymomas (types A, AB, and B1), high-risk thymomas (types B2 and B3), and thymic carcinomas.
Clinically, thymic epithelial tumors are diagnosed primarily by using morphologic examinations, such as CT and MRI, both of which are excellent for identifying and defining the extent of thymic tumors (3–6). However, the differentiation of histologic subtypes according to the WHO classification is difficult in some cases (4).
18F-FDG PET has emerged as a powerful diagnostic tool for the diagnosis, staging, and restaging of neoplasms. Moreover, the recent development of integrated PET/CT overcomes to a large extent the lack of precision of PET in terms of anatomic landmark identification, and the PET/CT combination based on the integrated approach is not additive but, in fact, highly synergistic (7–9). However, relatively few clinical PET studies have been performed to evaluate thymic epithelial tumors. Liu et al. (10) first reported high 18F-FDG uptake in thymoma and suggested that 18F-FDG PET is useful in assessing the invasiveness of thymomas. Sasaki et al. (11) demonstrated that 18F-FDG PET is useful for the differential diagnosis of thymic cancer and thymoma, and the usefulness of 18F-FDG PET for evaluating the malignant nature of primary mediastinal tumors has also been described (12). However, these studies were performed on a relatively small number of subjects or were published before the current classification of thymic epithelial tumors was proposed by WHO in 1999. The purpose of the present study was to describe the 18F-FDG PET/CT findings of thymic epithelial tumors according to a simplified WHO classification scheme using 3 subgroups and to investigate the usefulness of PET/CT for distinguishing and staging subgroups of thymic epithelial tumors.
MATERIALS AND METHODS
The institutional review board of Samsung Medical Center approved this research study. Patient informed consent was not required for the retrospective study but written informed consent was obtained from all patients for the integrated 18F-FDG PET/CT and enhanced stand-alone CT study.
Patient Population and Case Ascertainment
From August 2004 to December 2005, 51 patients with thymic epithelial tumors registered at Samsung Medical Center. Of these, 18 patients were excluded because of a lack of information on PET/CT in 11 patients and on posttreatment status in 7. Therefore, this study included 33 patients (15 men, 18 women; age range, 34–68 y; mean ± SD, 54.6 ± 10.9 y) who underwent both integrated PET/CT and CT before initial surgery, chemotherapy, or radiotherapy.
Twenty-six (79%) of the 33 patients underwent surgical resection and the remaining 7 underwent only core biopsy. All tumors were staged according to the TNM staging systems of Masaoka et al. (13) and Yamakawa et al. (14). Of the 33 patients, 20 (61%) underwent postoperative adjuvant therapy—that is, radiation therapy only (n = 11), chemotherapy only (n = 8), or radiation plus chemotherapy (n = 1).
All surgical specimens were reviewed and classified according to the WHO classification (1) (i.e., thymoma types A, AB, B1, B2, and B3 and thymic carcinoma) by an experienced lung pathologist who was unaware of clinical or imaging findings. All tumors were regrouped into 3 subgroups: low-risk thymomas (types A, AB, and B1), high-risk thymomas (types B2 and B3), and thymic carcinomas.
The presence of intrathoracic or extrathoracic nodal metastasis (n = 7) was determined by lymph node biopsy (n = 7), the presence of extrathoracic distant organ metastasis (n = 4) was determined by core biopsy (n = 1, liver) or initial and follow-up imaging studies (n = 3; follow-up period, 2–10 mo), and the presence of pleural seeding was determined by surgical exploration (n = 5) or by follow-up study (n = 2; follow-up period, 8 and 16 mo, respectively).
CT Acquisition and Image Analysis
CT scans were obtained using the helical technique and using commercially available machines, mostly 8-detector (LightSpeed Ultra; GE Healthcare) or 16-detector (LightSpeed16, GE Healthcare) scanners. Scanning was performed from the level of the thoracic inlet to the level of the middle portion of the kidneys after the intravenous administration of contrast medium (100 mL of iomeprol [Iomeron] 300; Bracco). In all patients, the scanning parameters were 120 kVp and 170–200 mA. All image data were reconstructed using a bone algorithm. Data were interfaced directly to our picture archiving and communication system (Centricity 1.0; GE Medical System Integrated Imaging Solutions, GE Healthcare), which displayed all image data on monitors (4 monitors, 1,536 × 2,048 image matrices, 8-bit viewable gray scale, 60-foot-lambert luminescence). The monitors were used to view both mediastinal (width, 400 Hounsfield units (H); level, 20 H) and lung (width, 1,500 H; level, −700 H) window images.
Two chest radiologists, who were unaware of clinical findings and histologic classifications, assessed CT scans retrospectively. Decisions on CT scan findings were reached by consensus. CT scans were assessed in terms of size, contour, enhancement pattern, and tumor findings (i.e., the presence of tumor necrosis or calcification and associated findings). The presence of mediastinal fat infiltration, great vessel invasion, pleural or pericardial effusion, pleural seeding, and lymph node enlargement (short-axis diameter, >10 mm) was also evaluated.
The longest tumor diameters were measured. Marginal characteristics were subclassified as smooth, lobulated, or irregular. Enhancement patterns were recorded as homogeneous or heterogeneous, and enhancement degrees were classified as less than, equal to, or greater than that of the chest wall muscle by visual estimation. Tumor necrosis was presumed to be present when a focal area of low attenuation was observed on enhanced scans, and great vessel invasion was considered present when a tumor abutted and altered the contour of a vessel or when overt tumor thrombosis and vascular occlusion were present.
Integrated PET/CT Acquisition and Image Analysis
All patients fasted for at least 6 h before PET/CT examination, although oral hydration with glucose-free water was allowed. After ensuring a normal blood glucose level in peripheral blood, patients received an intravenous injection of 370 MBq (10 mCi) of 18F-FDG and then rested for approximately 45 min before scanning. Scans were acquired using a PET/CT device (Discovery LS; GE Healthcare), which consisted of a PET scanner (Advance NXi; GE Healthcare) and an 8-slice CT scanner (LightSpeed Plus; GE Healthcare). The axes of these systems were mechanically aligned such that a patient could be moved from the CT scanner to the PET scanner gantry by moving the examination table a distance of 68 cm.
CT was performed according to a standardized protocol using the following settings: 140 kV; 80 mA; tube rotation time, 0.5 s per rotation; pitch, 6; and section thickness, 5 mm (to match the PET section thickness). Patients maintained normal shallow respiration during the acquisition of CT scans. No iodinated contrast material was administered. Immediately after unenhanced CT, emission PET was performed in the identical transverse field of view. The acquisition time for PET was 5 min per table position (per frame). CT data were resized from a 512 × 512 matrix to a 128 × 128 matrix to match PET data, so that scans could be fused and CT-based transmission maps could be generated. PET datasets were reconstructed iteratively using an ordered-subset expectation maximization algorithm with segmented attenuation correction (2 iterations, 28 subsets) using CT data. Coregistered scans were displayed using eNTEGRA software (GE Healthcare).
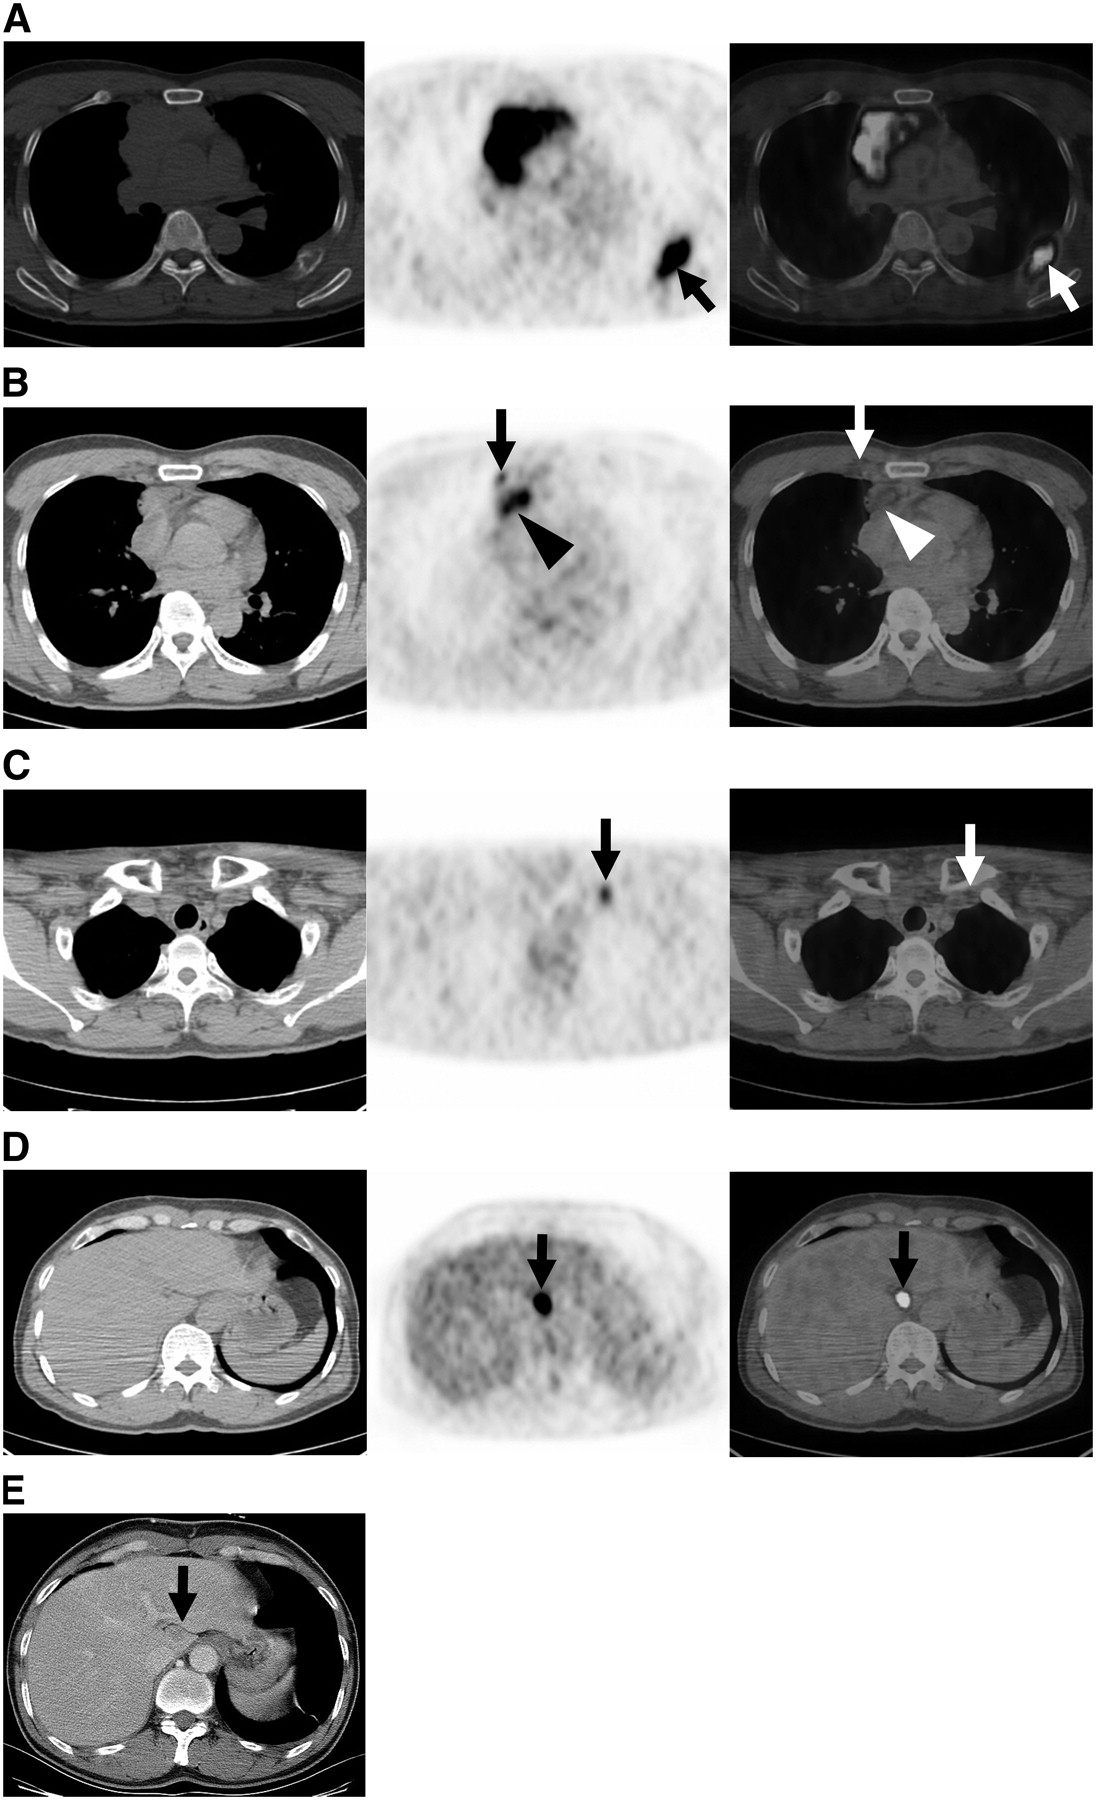
Maximum standardized uptake values (SUVs) of masses were recorded. Patterns of uptake were described as heterogeneous or homogeneous. Heterogeneous uptake was defined to be present when a thymic tumor showed spotted or mottled 18F-FDG uptake (Fig. 1), and homogeneous uptake was defined to be present when the whole thymic epithelial tumor showed homogeneous uptake (Figs. 2A and 4A), irrespective of the presence of a tumor necrotic area (an uptake void area). The presence of metastatic lymph nodes, pleural or pericardial seeding, and distant metastasis were also recorded with their maximum SUVs.

CT, PET, and coregistered PET/CT images (from left to right) of low-risk (type AB tumor) thymoma in 52-y-old woman show inhomogeneous 18F-FDG uptake (maximum SUV, 3.6) in smoothly marginated anterior mediastinal mass (arrows). There is no evidence of mediastinal fat invasion.

Thymic carcinoma (squamous cell carcinoma) in 48-y-old man. (A) CT, PET, and coregistered PET/CT images demonstrate homogeneous 18F-FDG uptake (maximum SUV, 16.6) in anterior mediastinal mass of lobulated contour. Mediastinal fat invasion is highly suggested. Also note rib metastasis (arrows). (B) 18F-FDG uptake (maximum SUV, 3.8) in right internal mammary lymph node (arrows) is evident at bottom level of anterior mediastinal mass (arrowheads). Node metastasis was missed on stand-alone CT. (C) 18F-FDG uptake (maximum SUV, 4.1) is also identified in left supraclavicular lymph node (arrows) at thoracic inlet level. This node was also missed on stand-alone CT. (D) Hepatic uptake (proven as a metastasis) (arrows) is noted on integrated PET/CT scan. (E) Stand-alone CT image shows subtle hepatic low-attenuated lesion (arrow).
Statistical Analysis
Relationships between tumor type distributions according to the WHO thymic epithelial tumor classification and clinical staging systems (staging system of Masaoka et al. (13) and TNM system) were analyzed using the Cochran–Mantel–Haenszel test.
Differences between the maximum tumor SUVs of the 3 simplified WHO histologic subtypes were assessed using the Kruskal–Wallis test, and the Jonckheere–Terpstra test was used to evaluate maximum tumor SUV trends with respect to these 3 subtypes. Statistical differences between the 3 subtypes with respect to uptake pattern prevalence were analyzed using the Fisher exact test with the permutation method for multiple testing. The Cochran–Mantel–Haenszel test was used to evaluate trends in uptake pattern prevalence.
The enhanced stand-alone CT findings of the 3 tumor subgroups were analyzed using 1-way ANOVA and the Fisher exact test. Discriminant analysis was undertaken to determine the extent to which integrated PET/CT and enhanced stand-alone CT findings were independent of each other in terms of differentiating these 3 thymic epithelial tumor subgroups.
RESULTS
Histopathologic Classification of Thymic Epithelial Tumors
This study included 8 low-risk thymomas (1 type A, 4 type AB, and 3 type B1) (Fig. 1), 9 high-risk thymomas (6 type B2 and 3 type B3), and 16 thymic carcinomas (Figs. 2–4). Histologically, the 16 thymic carcinomas consisted of 11 squamous cell carcinomas, 3 mucoepidermoid carcinomas, 1 neuroendocrine tumor, and 1 adenocarcinoma.

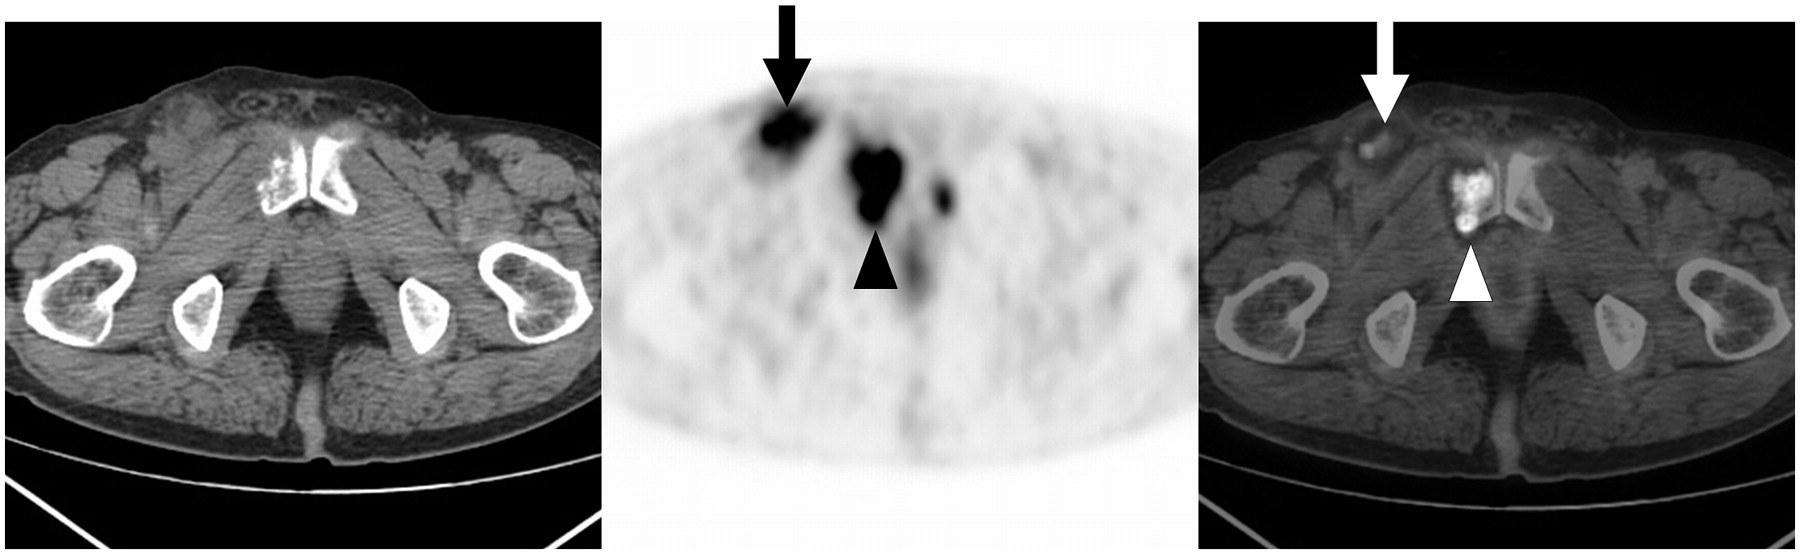
CT, PET, and coregistered PET/CT images of thymic carcinoma (adenocarcinoma) in 67-y-old man show extrathoracic inguinal nodal metastasis (arrows) in right inguinal area. Also note bone metastasis in pubis (arrowheads).

Thymic carcinoma (squamous cell carcinoma) in 66-y-old man. (A) CT, PET, and coregistered PET/CT images show anterior mediastinal mass with homogeneous 18F-FDG uptake (maximum SUV, 10.5). (B) CT, PET, and coregistered PET/CT images obtained at thoracic inlet level show focal 18F-FDG uptake (arrows) in left apical pleura with a maximum SUV of 3.8, suggestive of pleural seeding. With surgical exploration, pleural seeding was confirmed. (C) Stand-alone CT image obtained at level similar to B shows focal pleural thickening (arrowhead) in left apical area, which was not identified on initial interpretation.
The distributions of tumors according to the simplified WHO classification and the clinical stagings (the Masaoka et al. (13) and TNM systems) are shown in Table 1. The proportion of invasive tumors showed an increasing tendency in the order of low-risk thymomas, high-risk thymomas, and thymic carcinomas (P = 0.006 for staging system of Masaoka et al.; P = 0.003 for the TNM system).
Clinicopathologic Staging vs. Simplified Subgroups of Thymic Epithelial Tumors Based on WHO Classification
Lymph node metastasis was observed in 7 patients with a squamous cell carcinoma histologic subtype. Distant metastasis was found in 4 patients with the following histologic subtype: type B1 (n = 1), squamous cell carcinoma (n = 2), and adenocarcinoma (n = 1). Pleural seeding was present in 7 patients: type B1 (n = 1), type B2 (n = 3), squamous cell carcinoma (n = 2), and neuroendocrine carcinoma (n = 1).
Integrated PET/CT and Stand-Alone CT Findings Among 3 Subgroups of Tumors
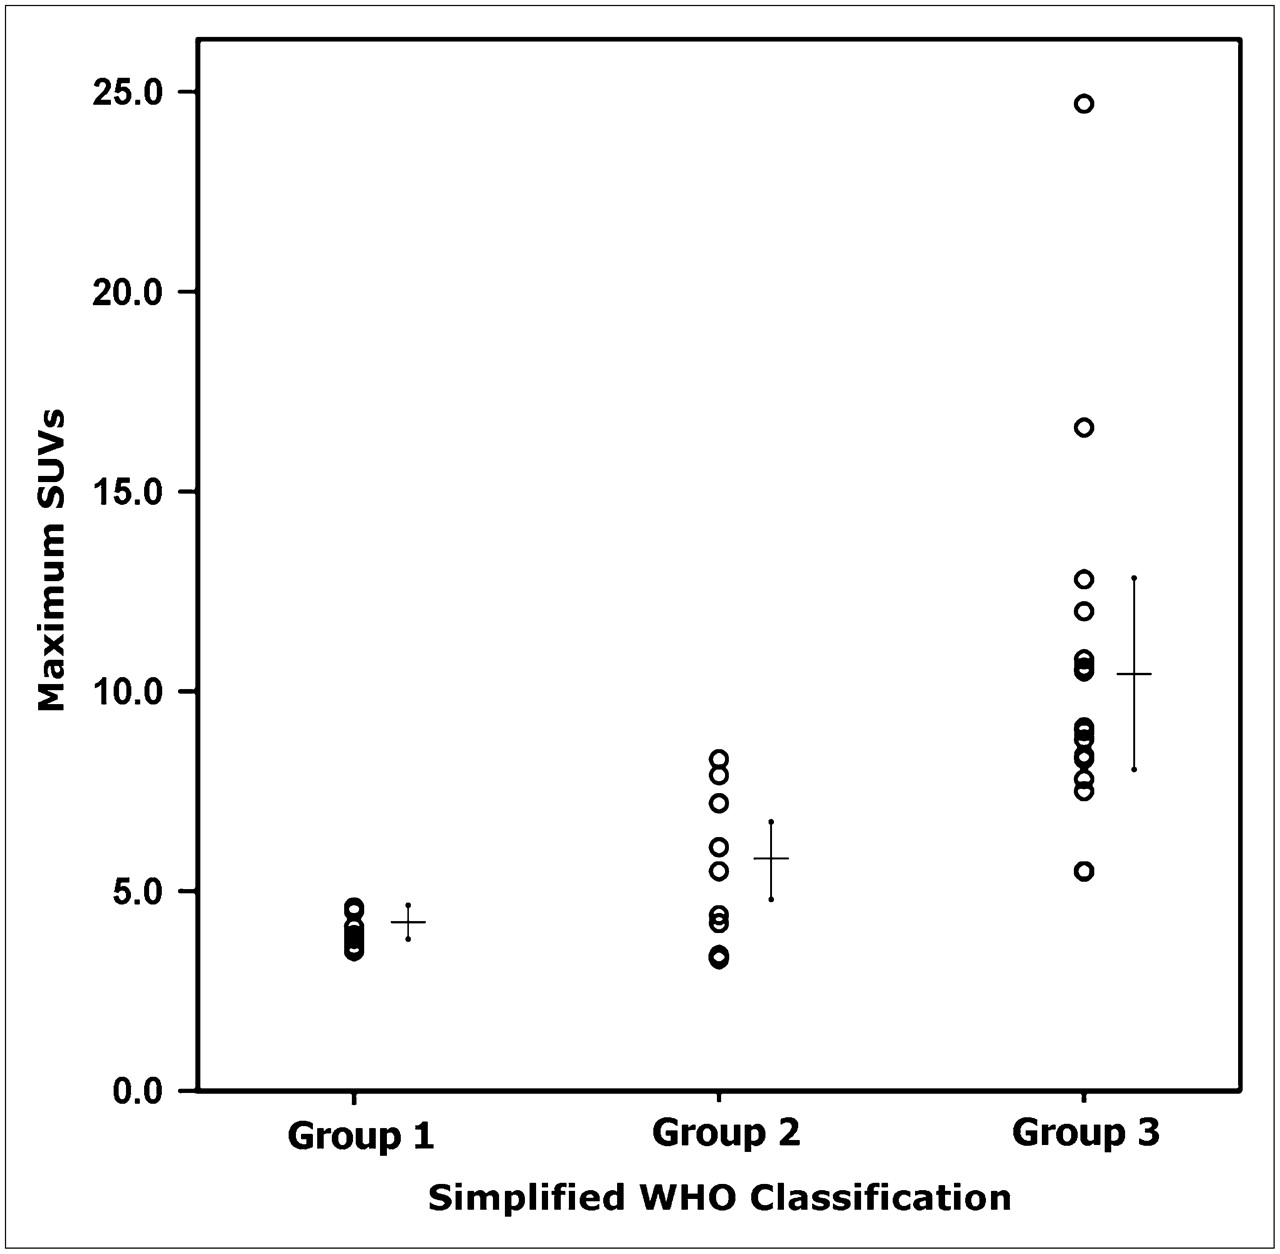
The maximum SUVs ± SD of the 3 subtypes on integrated PET/CT were 4.0 ± 0.42 (range, 3.5–4.6; median, 3.9) for low-risk thymoma, 5.6 ± 1.90 (range, 3.3–8.3; median, 5.5) for high-risk thymoma, and 10.5 ± 4.68 (range, 5.5–24.7; median, 9.1) for thymic carcinoma (Fig. 5). The maximum SUVs were 11.2 ± 5.4 (range, 5.5–24.7) for squamous cell carcinoma, 8.8 ± 3.3 (range, 5.5–12) for mucoepidermoid carcinoma, 10.6 for adenocarcinoma, and 8.3 for thymic neuroendocrine tumor.

Graph shows maximum SUV distribution of each patient of 3 groups. Group 1 = low-risk thymoma (maximum SUVs, 4.0 ± 0.42 [mean ± SD]), group 2 = high-risk thymoma (maximum SUVs, 5.6 ± 1.90), and group 3 = thymic carcinoma (maximum SUVs, 10.5 ± 4.68).
The maximum SUVs of high- and low-risk thymomas were significantly lower than those of thymic carcinomas (both P < 0.001), but no difference was observed between low-risk thymomas and high-risk thymomas (P = 0.076). However, an increasing tendency was observed according to tumor type, in the order low-risk to high-risk thymoma to thymic carcinoma (P < 0.001).
Homogeneous 18F-FDG uptake within tumors was observed in 12 (75%) of 16 thymic carcinomas, 2 (22%) of 9 high-risk thymomas, and 0 (0%) of 8 low-risk thymomas. The homogeneous uptake was observed more frequently in thymic carcinomas (Figs. 2A and 4A) than in high-risk thymomas (P = 0.027) or low-risk thymomas (P = 0.001) (Fig. 1). No significant differences in the uptake pattern (P = 0.661) was observed between low-risk and high-risk thymomas. An increasing trend in homogeneous 18F-FDG uptake pattern prevalence was observed in the order low-risk to high-risk thymoma to thymic carcinoma (P < 0.001).
The enhanced stand-alone CT findings of the 3 thymic epithelial tumor subtypes are summarized in Table 2. The longest tumor mean diameters in the 3 subtypes were 48.5 ± 15.2 mm for low-risk thymomas, 51.0 ± 18.1 mm for high-risk thymomas, and 63.6 ± 20.1 mm for thymic carcinomas. No significant difference was observed between these subtypes in terms of the longest diameter (P = 0.115). An irregular contour and mediastinal fat invasion were seen more often in thymic carcinomas than in low-risk thymomas (P = 0.008 and P < 0.001, respectively), and mediastinal fat invasion was also more frequent in high-risk thymomas than in low-risk thymomas (P = 0.015). No significant differences were observed between the 3 subgroups in terms of tumor necrosis (P = 0.125), calcification (P = 0.062), enhancement pattern (P = 0.080), enhancement degree (P = 0.140), great vessel invasion (P = 1.000), pleural effusion (P = 0.258), pericardial effusion (P = 1.000), pleural seeding (P = 0.476), and lymph node enlargement (P = 0.058).
Comparison of Various CT Findings According to Simplified Subgroups of Thymic Epithelial Tumors
A homogeneous or a heterogeneous uptake pattern on integrated PET/CT and mediastinal fat invasion on enhanced stand-alone CT were found to be useful for differentiating subgroups of tumors with a prediction rate of about 76% by discriminant analysis.
Tumor Extent by Integrated PET/CT and Stand-Alone CT
Intrathoracic or extrathoracic lymph node metastases were noted in 7 (44%) of 16 patients with thymic carcinoma on integrated PET/CT and in 5 patients (31%) on stand-alone CT. Integrated PET/CT helped detect lymph node metastases, which were not identified on stand-alone CT in 2 patients. One (squamous cell carcinoma) of these 2 patients showed increased 18F-FDG uptake in the left supraclavicular (maximum SUV, 4.1) and the right internal mammary (maximum SUV, 3.8) nodes (Figs. 2B and 2C), and the other (adenocarcinoma) showed increased 18F-FDG uptake in the right paratracheal (maximum SUV, 4.3) and the right inguinal (maximum SUV, 6.6) lymph nodes (Fig. 3). All of these nodes proved to be malignant histologically but, because of their small sizes, these lymph nodes were not interpreted as malignant nodes on CT images.
Hepatic or bony metastases were demonstrated in 4 patients on both integrated PET/CT and stand-alone CT: liver in 1 patient with a low-risk thymoma (Figs. 2D and 2E), bone in 2 patients with thymic carcinoma, and liver and bone in 1 patient with a thymic carcinoma.
Eight patients (6 patients without pleural effusion and 2 with pleural effusion; reference standard was made by surgical exploration in 6 patients and by follow-up imaging study in 2) were suspected of having pleural seeding on integrated PET/CT or stand-alone CT; of these 8 patients, 7 proved finally to have pleural seeding. The maximum SUVs of the pleural lesion, and the integrated PET/CT and CT interpretations are given in Table 3. CT produced 1 false-positive and 1 false-negative result (Fig. 4) and integrated PET/CT demonstrated various degrees of 18F-FDG uptake in cases of pleural seeding. The presence of pleural seeding was predicted more confidently by observing stand-alone CT findings or the CT component of integrated PET/CT than by PET findings alone.
Evaluation of Pleural Seeding Suspected on Integrated PET/CT or CT Images of 8 Patients
DISCUSSION
The literature indicates that preoperative diagnoses based on the WHO histologic classification system assist during the assessment and treatment planning of patients with thymic epithelial tumors (15,16). Low-risk thymomas can be resected completely with favorable long-term survival. Adjuvant therapy after complete resection is not warranted (17). Adjuvant radiation therapy may be given after surgical resection for high-risk thymomas. In thymic carcinomas, complete resection is feasible in <50% of patients; therefore, adjuvant radiation therapy or chemotherapy is given after surgery or chemotherapy or concurrent chemoradiation therapy is given from the beginning (17–20). However, preoperative predictions of WHO histologic subtypes based on imaging findings alone are difficult because the imaging findings of the various WHO classification subtypes of thymic epithelial tumors overlap (4,5,21).
Relatively few clinical PET studies have been performed to evaluate thymic epithelial tumors. Liu et al. (10) first reported high 18F-FDG uptake in thymoma and suggested that 18F-FDG PET is useful for assessing invasiveness, whereas Sasaki et al. (11) found that 18F-FDG PET was considered for the differential diagnosis of thymic cancer and thymoma. The usefulness of 18F-FDG PET for evaluating the malignant nature of primary mediastinal tumors has also been described (12).
Our results suggest that the maximum SUVs of thymic carcinomas were significantly higher than those of high- or low-risk thymomas. Our results concur with those of Kubota et al. (12), who showed that 18F-FDG uptake in invasive thymoma is significantly higher than that in noninvasive thymoma. Another observation made during the present study was that a higher proportion of thymic carcinoma patients showed homogeneous 18F-FDG uptake than low- or high-risk thymoma patients. The high and homogeneous 18F-FDG uptake of thymic carcinomas found in the present study could be explained by the positive correlations between 18F-FDG uptake and the tumor growth rates (22) or cell density (23).
Intrathoracic and extrathoracic lymph node metastases were found to be more detectable on integrated PET/CT than on stand-alone CT in 2 patients, although extrathoracic organ metastases were equally and correctly detected on integrated PET/CT and stand-alone CT. Eight patients were suspected of having pleural lesions on integrated PET/CT, and pleural seeding was confirmed in 7 of these patients, which showed various 18F-FDG uptakes (maximum SUVs, 1.9∼7.4). In 1 of the 7 patients with pleural seeding, stand-alone CT missed an apical pleural lesion, which was detected correctly on integrated PET/CT. This finding suggests that integrated PET/CT may also be useful for the evaluation of pleural seeding.
The discriminant analysis performed in our study showed that homogeneous uptake on integrated PET/CT and mediastinal fat infiltration on stand-alone CT are significant differentiators of the 3 defined thymic tumor subgroups; although no significant difference was found between low-risk thymomas (4.0 ± 0.42) and high-risk thymomas (5.6 ± 1.9), maximum SUVs and 18F-FDG uptake patterns were significantly different between thymic carcinomas (10.5 ± 4.68) and low-risk or high-risk thymomas. Therefore, thymic cancer can be diagnosed confidently when a thymic epithelial tumor is avidly visualized on PET (>10 in maximum SUV), appears as a homogeneous mass on the PET component image, and shows mediastinal fat invasion on the CT component image of integrated PET/CT.
Our study is limited by the small number of patients included and the retrospective design. Although we included 33 patients, in each subgroup of thymic epithelial tumor, only about 8–16 patients were enrolled. Moreover, squamous cell carcinoma accounted for 11 of 16 thymic carcinomas. Further results from studies dealing with a large number of patients and designed in a prospective manner remain to be determined. These studies may include a direct comparison between PET/CT and stand-alone CT on the diagnostic efficacy for the differentiation of thymic carcinoma from other subtypes of thymic epithelial tumors and a larger prospective study on the relationship between the uptake pattern or maximum SUVs of tumors and the patient outcome.
In conclusion, 18F-FDG PET/CT proved to be useful in differentiating thymic epithelial tumor subgroups and in evaluating the extent of disease. In addition, integrated PET/CT appeared to be helpful in terms of predicting lymph node metastasis and pleural seeding from thymic epithelial tumors.
Footnotes
-
COPYRIGHT © 2006 by the Society of Nuclear Medicine, Inc.
References
- Received for publication May 9, 2006.
- Accepted for publication July 14, 2006.


Jump to section
Related Articles
Cited By...
- A bimodal approach to thymic carcinoma with pericardial sac invasion
- Thymomas and Thymic Carcinomas
- 18F-Fluorodeoxyglucose Positron Emission Tomography in the Management of Patients with Thymic Epithelial Tumors
- Biologic Correlation of 2-[18F]-Fluoro-2-Deoxy-D-Glucose Uptake on Positron Emission Tomography in Thymic Epithelial Tumors