


Abstract
The purpose of this study was to evaluate the ability of 18F-FDG PET to identify aortitis and to localize and follow disease activity in patients with Takayasu arteritis. The value of using 18F-FDG PET coregistered with enhanced CT in determining vascular lesion sites and inflammatory activity was assessed. Methods: Takayasu arteritis was diagnosed according to the predefined criteria. Eleven patients with Takayasu arteritis in the active stage, 3 patients with Takayasu arteritis in the inactive stage, and 6 healthy subjects underwent 18F-FDG PET coregistered with enhanced CT and the inflammatory vascular lesion was evaluated by using the standardized uptake value (SUV) of 18F-FDG accumulation as an index. Two patients with active disease were analyzed by sequential 18F-FDG PET scans during treatment. Results: The 18F-FDG PET revealed intense 18F-FDG accumulation (SUV ≥ 2.7) in the vasculature of 2 of the 11 cases in the active stage of Takayasu arteritis. The other 9 patients in the active stage revealed weak 18F-FDG accumulation (2.3 ≥ SUV ≥ 1.2). No significant 18F-FDG accumulation was observed in the patients with inactive disease (SUV ≤ 1.2) and 6 control healthy subjects (SUV < 1.3). Given the cutoff SUV is 1.3, the sensitivity of 18F-FDG PET analysis of Takayasu arteritis is 90.9% and the specificity is 88.8%. 18F-FDG PET coregistered with enhanced CT localized 18F-FDG accumulation in the aortic wall in the patients with Takayasu arteritis who had weak 18F-FDG accumulation that could not otherwise be identified anatomically. Finally, 18F-FDG accumulation resolved with therapy in 2 active cases. The disappearance of 18F-FDG accumulation did not coincide with the level of general inflammatory markers. Conclusion: The 18F-FDG PET images coregistered with enhanced CT images showed the distribution and inflammatory activity in the aorta, its branches, and the pulmonary artery in patients with active Takayasu arteritis, even those who had weak 18F-FDG accumulation. The intensity of accumulation decreased in response to therapy.
Takayasu arteritis is an idiopathic systemic granulomatous disease of large- and medium-sized vessels that may lead to vascular lesions such as segmental stenosis, occlusion, dilatation, and aneurysm formation in the aorta and its main branches (1,2). It mainly affects young females. Its pathogenesis is still unknown.
The diagnosis of Takayasu arteritis is made from the identification of a vascular lesion by a conventional aortogram, enhanced CT, MRI, augmented general inflammatory markers, or clinical symptoms due to ischemia. The disease activity of Takayasu arteritis is estimated from the levels of general inflammatory markers such as C-reactive protein and erythrocyte sedimentation rate during treatment with medication. However, general inflammatory markers usually are not good surrogate markers for evaluating the disease activity of Takayasu arteritis (3).
Gadolinium-enhanced MRI has been recently reported to provide imaging adequate to delineate large vessel anatomy and identify stenotic lesions (4). In gadolinium-enhanced MRI, the enhanced uptake of contrast agent by the inflamed large vessels are presumably due to enhanced permeability. However, the specificity for active inflammation or edema in the vessel wall is imperfect. Histopathology remains the gold standard for active vascular inflammation and it cannot be done in the diagnosis of Takayasu arteritis (5).
18F-FDG PET has been recently reported to be useful in the diagnosis of vascular diseases such as atherosclerosis and large vessel aortitis (6–12). However, we found that most of the patients with active Takayasu arteritis revealed weak 18F-FDG accumulation in the vascular wall of the large vessels by PET analysis and therefore we could not diagnose Takayasu arteritis by 18F-FDG PET alone. And few cases were studied to determine whether 18F-FDG accumulation might disappear in response to the medication.
The aim of our study was to evaluate whether 18F-FDG PET coregistered with enhanced CT can identify the distribution of the inflammation in the vasculature, facilitate the diagnosis anatomically, and evaluate the disease activity of Takayasu arteritis. We also evaluated whether there are differences between the disease activity estimated by general inflammatory markers and that estimated by 18F-FDG PET. We prospectively studied 11 patients with active Takayasu arteritis, 3 patients with inactive Takayasu arteritis, according to the diagnostic criteria (13) and 6 healthy control subjects. The coregistration of PET with enhanced CT may facilitate the diagnosis of Takayasu arteritis and could validate the usefulness of 18F-FDG PET for evaluating the disease activity of Takayasu arteritis
MATERIALS AND METHODS
Selection of Patients and Control Subjects
The study included 14 patients (13 women, 1 man) with Takayasu arteritis according to the American College of Rheumatology criteria (13). Of the 14 patients, 11 were in the acute stage and 3 were in the chronic stage. The mean age was 28 y old (range, 14–50 y old). Details of the patients are summarized in Table 1. All patients in acute stage were given 30 mg of prednisolone. In some cases with strong inflammation, 100 mg of cyclosporine were given together with prednisolone. The acute stage patient is defined as the patient with Takayasu arteritis who needs prednisolone to control the inflammation in the vessel clinically. And the chronic stage patient is defined as the patient with Takayasu arteritis who no longer need prednisolone for at least 2 y. Six control subjects without Takayasu arteritis were also studied. All participants were Japanese. Written informed consent was obtained from all participants before the study began. This study was approved by the Institutional Ethical Committee.
Details of Patients with Takayasu Arteritis Who Underwent 18F-FDG PET
CT Scan
Standard diagnostic CT scans were performed on a spiral CT scanner with 5-mm center-to-center slice separation, 512 × 512 matrix size, 0.54- to 0.82-mm pixel size, and 39–85 axial slices that include the neck and the entire lung volume. Scans were performed with intravenous contrast. During the scan, patients raised their arms and held their breath.
18F-FDG PET
PET was performed with a whole-body PET scanner, model SET 2400W (Shimadzu Co.), with an axial field of view of 20.0 cm and 63 transverse slices with a slice thickness of 3.125 mm. 18F-FDG was produced using a commercial kit (FDG MicroLab; GE Healthcare) in the Positron Medical Center, Tokyo Metropolitan Institute of Gerontology. All patients were asked to fast for >12 h before the study to minimize glucose utilization in normal tissues and to ensure standardized glucose metabolism. A total of 23 rounds of 18F-FDG PET scans were performed in 14 patients with Takayasu arteritis; each of 6 healthy subjects underwent 18F-FDG PET once. The image acquisition on 2-dimensional mode started 45 min after the intravenous administration of 300–370 MBq (approximately 6 MBq 18F-FDG per kilogram of body weight) using simultaneous emission and transmission measurement methods (14). A 7-min emission/transmission scan with a 68Ga/68Ge rotating rod source was performed for 4 overlapping bed positions; this resulted in an axial field of view of 75 cm and a total acquisition time of 28 min. Emission and transmission sinograms were separated by the sinogram windowing technique. The transmission scan for the attenuation correction was filtered using nonlinear gaussian filters to reduce noise (15) and reconstructed using ordered-subsets expectation maximization with 6 iterations and 16 subsets and postsmoothed using a 3 × 3 × 3 cubic filter. The image pixel counts were calibrated to activity concentration (Bq/mL) and were corrected for decay using the time of tracer injection as the reference. The resulting in-plane image resolution of the transaxial image was approximately 8-mm full width at half maximum.
Initial Data Processing
Further data processing and analysis were performed on an SGI workstation (Silicon Graphics) using Dr.View software (Asahi Kasei Joho System). Before image registration, the PET data were resampled to a 256 × 256 matrix and the volume extents and pixel sizes were adjusted automatically by our registration software to equalize the extents of PET and CT field of view. The coregistration of PET and enhanced CT was obtained by the semiautomated process of rigid-body transformation with additional fine adjustment of the interactive process of viewing the superimposed images in 3-dimensional slices using the Dr.View program so that the outline of the mediastinum and the upper edge of the lung were matched. With this approach, satisfactory registration was achieved at the particular region of the thoracic aorta and its branching portions regardless of the arm position.
Visual Analysis
PET data were analyzed by visual interpretation of coronal, sagittal, and transverse slices and cross-referenced with coregistered enhanced CT images and rotating 3-dimensional images when necessary. All 3 image modalities (CT, PET, and coregistered images) were assessed separately by 2 experienced radiologists using standardized questionnaires independently. The aorta was considered positive for aortitis when heterogeneously increased 18F-FDG uptake was present in areas presumed to correspond to the aorta in the enhanced CT images. In contrast, the aorta was considered negative when no 18F-FDG uptake was observed.
Analysis of Regions of Interest (ROIs)
Each ROI was identified on the wall of the aorta with its center on the local maximum of 18F-FDG accumulation by the same nuclear medicine physician during the entire study. 18F-FDG uptake was quantified at the ROI using the standardized uptake value (SUV) normalized for lean body mass. In the control case, 18F-FDG uptake was quantified at the aortic arch because Takayasu arteritis affects the aortic arch most often. The SUV is defined as a tissue activity concentration divided by the total activity injected per body weight.
RESULTS
18F-FDG Accumulation in Vascular Walls of Patients with Active Takayasu Arteritis
As shown in Table 1, in 2 patients with active disease, strong 18F-FDG accumulation (SUV ≥ 2.7), which was easily identified in the aortic region, was observed and the other patients with active disease revealed weak 18F-FDG accumulation (2.3 ≥ SUV ≥ 1.2), from which identification of the location of 18F-FDG accumulation was difficult by 18F-FDG PET alone. Furthermore, 18F-FDG accumulation in this study did not always coincide with established aortic lesions observed in CT or MR angiography. In contrast, 3 patients with inactive disease (SUV = 1.2) and the control subjects had no specific 18F-FDG accumulation in the vasculature and revealed low SUVs (SUV < 1.3) in the aortic arch region. Therefore, we judged that the cutoff point of SUV could be 1.3 for the diagnosis of vascular inflammation in our analysis. Given the SUV cutoff point is 1.3, the sensitivity of our analyses should be 90.9% and the specificity should be 88.8%.
18F-FDG PET Coregistered with Enhanced CT Facilitates Identification of 18F-FDG Accumulation of Takayasu Arteritis Anatomically
As shown in Table 1, most of the patients with active disease did not have strong 18F-FDG accumulation that was easily identified in the aortic region. Therefore, to identify the lesion of 18F-FDG accumulation anatomically, we coregistered the 18F-FDG PET images with the enhanced CT images.
In the case shown in Figure 1, enhanced CT showed a dilated aortic arch causing severe aortic regurgitation and constriction of the abdominal aorta due to Takayasu arteritis. Similar findings were confirmed in the angiogram and MR images (data not shown). The 18F-FDG accumulation was observed in the mediastinum region (Figs. 1A and 1D), but we could not adequately identify whether these 18F-FDG accumulations were located in the vascular wall on the basis of the PET image alone. However, as shown in Figures 1B and 1E, the 18F-FDG PET images coregistered with enhanced CT images revealed that these 18F-FDG accumulations were localized in the vascular wall of the ascending arteries and also in the pulmonary arteries. These 18F-FDG accumulations did not always coincide with a vascular wall thickening lesion. These may represent areas of inflammation that have not yet progressed to develop vascular thickening.
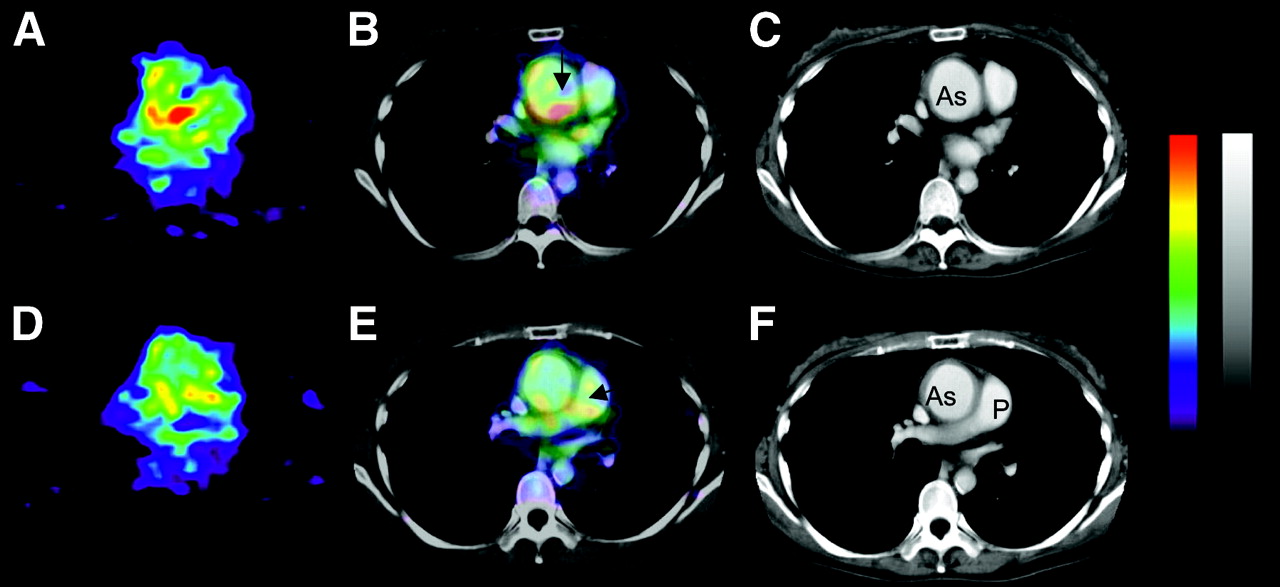
A 37-y-old woman with active Takayasu arteritis. 18F-FDG PET coregistered with enhanced CT revealed that 18F-FDG accumulations were localized in vascular wall of ascending aortic and pulmonary artery. (A and D) Axial images of 18F-FDG PET. 18F-FDG accumulated in mediastinum. (B and E) Coregistered PET with enhanced CT images. Arrows indicate 18F-FDG accumulation in ascending aorta (B) and pulmonary arteries (E). (C and F) Enhanced reconstituted CT images of same level of A and D. Ascending aorta was enlarged, causing aortic regurgitation. As = ascending aorta; P = pulmonary artery.
18F-FDG PET Coregistered with Enhanced CT Facilitates Diagnosis of the Suspected Case of Takayasu Arteritis
In the case shown in Figure 2, we observed the wall thickness of both common carotid arteries by carotid echography but did not locate a clear vascular deformity by the angiogram, MRI, and enhanced CT (Figs. 2C and 2F). In this case, weak 18F-FDG accumulation was observed in 18F-FDG PET (Figs. 2A and 2C) and we could not diagnose Takayasu arteritis by 18F-FDG PET alone. However, 18F-FDG PET coregistered with enhanced CT showed that the 18F-FDG accumulations were located in the ascending aortic wall (Fig. 2B), in the aortic arch, and in the descending aorta (Figs. 2B and 2E). Interestingly, in the carotid artery, where wall thickness was observed, 18F-FDG accumulation was not evident. In this case, although marked deformity of a large vessel was not observed, 18F-FDG accumulation was identified in the aortic walls by these coregistered images, facilitating the diagnosis of suspected Takayasu arteritis.
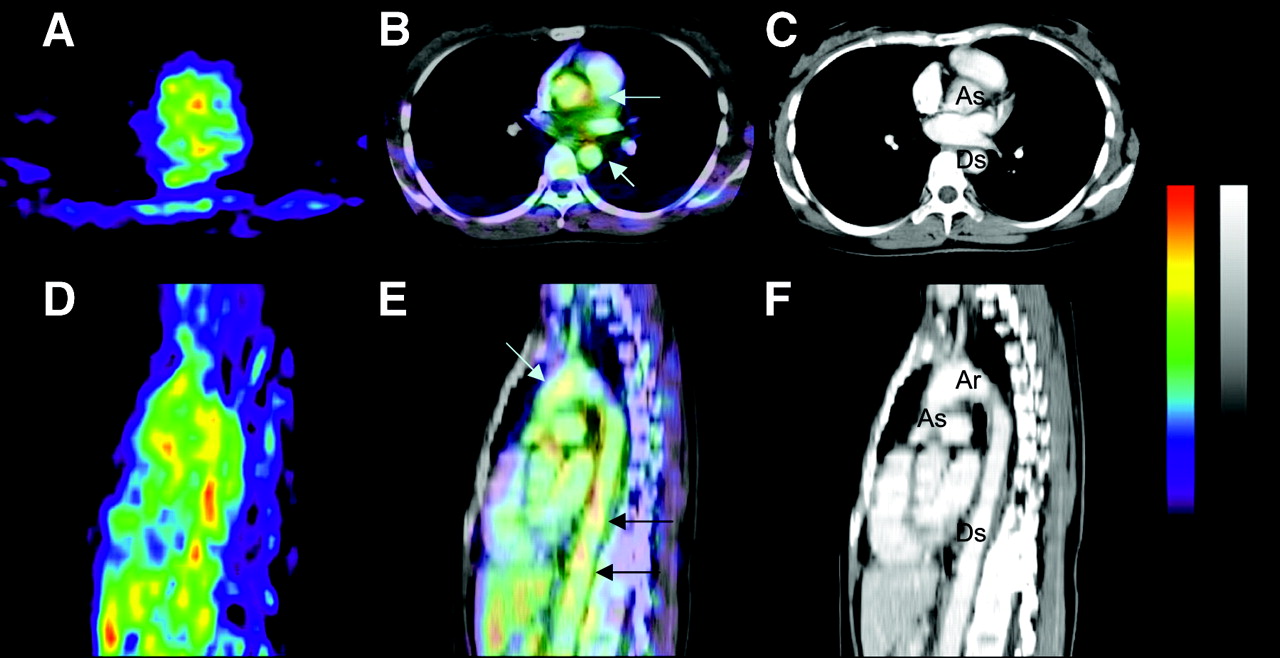
A 31-y-old woman with active Takayasu arteritis. 18F-FDG PET coregistered with enhanced CT revealed that 18F-FDG accumulations were localized in vascular wall of ascending aorta, aortic arch, and descending artery. (A and D) Axial (A) and sagittal (D) images of 18F-FDG. (B and E) Coregistered PET with enhanced CT images. 18F-FDG accumulation was observed in mediastinum and region along spine. Arrows show 18F-FDG accumulations in aorta. (C and F) Enhanced reconstituted CT images of same section of A and C. As = ascending aorta; Ds = descending aorta; Ar = aortic arch.
18F-FDG Accumulation in Vasculature Disappeared During Treatment with Medication and Did Not Correlate with General Inflammatory Markers
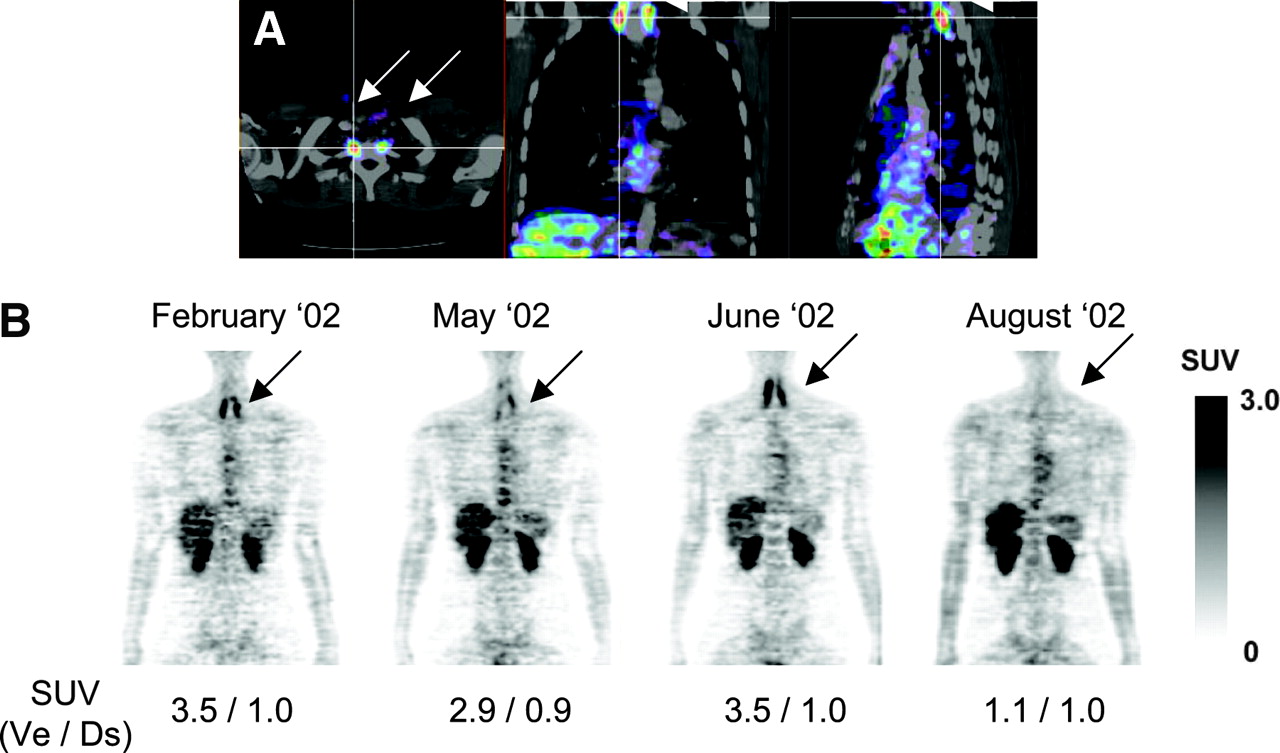
We performed 4 sequential 18F-FDG PET analyses of a patient with active Takayasu arteritis to determine whether these 18F-FDG accumulations disappear during medical therapy (Fig. 3). The patient was given 30 mg of prednisolone daily. The inflammatory markers were normalized in a week. In contrast, the 18F-FDG accumulation apparent in 18F-FDG PET was not diminished for many months and did not correlate with the normalization of general inflammatory markers (Fig. 3). 18F-FDG accumulation was almost diminished within 6 mo after the combination therapy of 30 mg of prednisolone and 100 mg of cyclosporine (Fig. 3). The other patient who underwent sequential PET analysis also showed diminished 18F-FDG accumulation with 30 mg of prednisolone and 100 mg of cyclosporine (data not shown). We also examined the reproducibility using a sequential PET analysis shown in Figure 3 at her nonaffected descending aorta. The SUVs in each PET analysis were 1.05, 0.91, 0.96, 1.03, and 1.19. Therefore, we believe the 18F-FDG PET data are reproducible and these data can be compared together.

A 21-y-old woman with active Takayasu arteritis. (A) Increased 18F-FDG was identified at both vertebral arteries by 18F-FDG PET coregistered with CT (white arrows). (B) Four sequential 18F-FDG PET analyses showed that 18F-FDG accumulations in vertebral arteries on both sides disappeared during treatment with prednisolone and cyclosporine (black arrows). SUVs at bottom of each image were measured at peak signals in left side of vertebral artery (Ve) with active inflammation and at descending aorta (Ds) without inflammatory activity as a reference.
DISCUSSION
This study is a prospective analysis of the utility of 18F-FDG PET coregistered with enhanced CT in the localization of inflammation in the large vessels and estimation of the inflammatory activity in patients with Takayasu arteritis. In this study, we found that 18F-FDG PET analysis of Takayasu arteritis alone did not always give a signal strong enough to demonstrate inflammation of a vascular lesion; 18F-FDG PET coregistered with enhanced CT can enhance the sensitivity of the 18F-FDG accumulation in the aorta, its branches, and the pulmonary artery due to Takayasu arteritis and also can estimate the disease activity. We also showed that the 18F-FDG accumulation responded to medication and disappeared. The disappearance did not coincide with the level of the general inflammatory markers. In contrast, in the patients with inactive Takayasu arteritis and the healthy subjects, low 18F-FDG accumulation was observed in the vascular wall. These findings suggest that the 18F-FDG accumulation observed in the patients with active Takayasu arteritis indicates the site of inflammation in the affected vascular lesion.
The diagnosis of Takayasu arteritis is made from image analysis and clinical symptoms (13). The key finding for the diagnosis of Takayasu arteritis is the image analysis of angiograms, enhanced CT, and MRI showing the stenosis, occlusion, or aneurysm formation in large- and medium-sized vessels. The diagnosis of Takayasu arteritis often takes time because the discernable appearance of vascular lesions often takes time. We may hesitate to diagnose Takayasu arteritis in its early stage in suspected cases that do not have any vascular deformity. Therefore, direct identification of the inflammation in the vasculature facilitates the diagnosis of Takayasu arteritis in the early stage.
Several reports show the value of 18F-FDG PET in the diagnosis of large vessel arteritis (6–12) and show strong 18F-FDG signals in the vascular lesions that could be detected in several patients with aortitis. However, we found that 18F-FDG PET analyses did not always give the strong signals that could be easily identified with a location anatomically in patients with active Takayasu arteritis. Coregistration of 18F-FDG PET images with enhanced CT images has been described as a tool that provides good anatomic localization of functional data (16,17). Visual side-by-side analysis of nuclear medicine and CT studies is of value in characterizing large, single lesions (18,19). Therefore, we coregistered 18F-FDG PET images with enhanced CT images to identify 18F-FDG accumulation located in the vascular wall, to diagnose Takayasu arteritis, and also to exclude the cases of suspected Takayasu arteritis in which 18F-FDG accumulation was not located on the vascular wall. Takayasu arteritis sometimes involves only pulmonary arteries (20,21), and it is difficult to diagnose because of few clinical symptoms. Our study shows that the coregistration of 18F-FDG PET and enhanced CT may facilitate the diagnosis of isolated pulmonary arteritis due to Takayasu arteritis.
During the treatment of Takayasu arteritis with medication, general inflammatory markers such as C-reactive protein and erythrocyte sedimentation rate are used for the estimation of inflammatory activities. However, these inflammatory markers are reported to be unreliable surrogate markers for estimating the inflammatory activity of Takayasu arteritis during treatment with medication (1). Our study showed that C-reactive protein and erythrocyte sedimentation rate did not correlate with the existence of the inflammation in the vasculature. These findings suggest that 18F-FDG PET may be a potential tool for estimating the disease activity of Takayasu arteritis. However, more cases must be studied to confirm these findings.
Pathologic analyses of Takayasu arteritis showed that the inflammatory process of Takayasu arteritis starts at the vasa vasorum in the adventitia (2,22,23). These inflammatory cells in the affected lesion may be involved in 18F-FDG accumulation in Takayasu arteritis. Recently, 18F-FDG PET was also used for the diagnosis of atherosclerosis (24–26). 18F-FDG is believed to accumulate in atherosclerotic vascular lesions. Takayasu arteritis generally affects young females (27). They usually have a low number of risk factors for atherosclerosis and marked atherosclerosis formation is usually not expected in these young females. To differentiate 18F-FDG accumulation due to Takayasu arteritis from atherosclerosis, the disappearance of 18F-FDG accumulations during the treatment with medication may be a critical point. 18F-FDG accumulation in PET in the diagnosis of Takayasu arteritis should be carefully interpreted along with other clinical findings.
CONCLUSION
Coregistration of 18F-FDG PET and enhanced CT showed the distribution of the inflammation in the aorta, its branches, and the pulmonary artery. 18F-FDG PET also reveals the disease activity of Takayasu arteritis directly and the general inflammatory markers did not necessarily coincide with disease activity shown by 18F-FDG PET during the treatment with medication. These findings suggest that 18F-FDG accumulation observed in Takayasu arteritis directly indicates the inflammation in the vascular wall. 18F-FDG PET coregistered with enhanced CT should be useful in the diagnosis and management of Takayasu arteritis.
Acknowledgments
We thank Professor Shoichi Ozaki of the University of St. Marianna, Kawasaki, Japan; Dr. Shigeto Kobayashi of Juntendo University, Tokyo, Japan; and Dr. Takamichi Miyamoto of Musashino Red Cross Hospital, Tokyo, Japan, for the enrollment of their patients to this study. We also thank Professor Brian Mandell of The Cleveland Clinic, Cleveland, Ohio, for critical reading of the manuscript and discussion. This study was supported in part by a Grant-in-aid from the Ministry of Health, Labor, and Welfare, Japanese Government.
Footnotes
Received Oct. 22, 2004; revision accepted Jan. 27, 2005.
For correspondence or reprints contact: Kenji Ishii, MD, Positron Medical Center, Tokyo Metropolitan Institute of Gerontology, 35-2 Sakaecho, Itabashi, Tokyo 173-0015 Japan.
E-mail: ishii{at}pet.tmig.or.jp
REFERENCES
In this issue


Jump to section
Related Articles
Cited By...
- Overview of Imaging in Adult- and Childhood-onset Takayasu Arteritis
- Pulmonary Artery Involvement in Patients with Takayasu Arteritis
- Comparison of magnetic resonance angiography and 18F-fluorodeoxyglucose positron emission tomography in large-vessel vasculitis
- FDG Uptake by Prosthetic Arterial Grafts in Large Vessel Vasculitis Is Not Specific for Active Disease
- Assessment of Patients with Takayasu Arteritis in Routine Practice with Indian Takayasu Clinical Activity Score
- Pioglitazone Decreases Coronary Artery Inflammation in Impaired Glucose Tolerance and Diabetes Mellitus: Evaluation by FDG-PET/CT Imaging
- Response to Letter Regarding Article, "Anti-Tumor Necrosis Factor-{alpha} Therapy Reduces Aortic Inflammation and Stiffness in Patients With Rheumatoid Arthritis"
- EANM/SNMMI Guideline for 18F-FDG Use in Inflammation and Infection
- Anti-Tumor Necrosis Factor-{alpha} Therapy Reduces Aortic Inflammation and Stiffness in Patients With Rheumatoid Arthritis
- Added Value of 99mTc-HMPAO-Labeled Leukocyte SPECT/CT in the Characterization and Management of Patients with Infectious Endocarditis
- 18F-Fludeoxyglucose PET/CT in the evaluation of large-vessel vasculitis: diagnostic performance and correlation with clinical and laboratory parameters
- Role of FDG PET-CT in Takayasu Arteritis: Sensitive Detection of Recurrences
- Development of Outcome Measures for Large-vessel Vasculitis for Use in Clinical Trials: Opportunities, Challenges, and Research Agenda
- Sudden mono-ocular blindness with recurrent transient diplopia and ptosis in a middle-aged woman
- Detection and Quantification of Large-Vessel Inflammation with 11C-(R)-PK11195 PET/CT
- Imaging of Vascular Inflammation With [11C]-PK11195 and Positron Emission Tomography/Computed Tomography Angiography
- Overview of Late Outcome of Medical and Surgical Treatment for Takayasu Arteritis
- Detection of inflammation in patients with acute aortic syndrome: comparison of FDG-PET/CT imaging and serological markers of inflammation
- Aortitis
- 18F-FDG PET and PET/CT in Fever of Unknown Origin
- Simvastatin Attenuates Plaque Inflammation: Evaluation by Fluorodeoxyglucose Positron Emission Tomography