


Abstract
We aimed to validate the accuracy of a new automated myocardial perfusion SPECT quantification based on normal limits for detection and sizing of infarcts, using delayed-enhancement MRI (DE-MRI) as a gold standard. Methods: Eighty-two immediate 201Tl rest scans and 26 201Tl delayed redistribution scans were compared with resting DE-MRI scans acquired within 24 h of SPECT acquisition. The immediate 201Tl scans were considered for validation of infarct detection and the delayed 201Tl scans were considered for infarct sizing. A simplified quantification scheme was used in which defect extent (EXT) and total perfusion deficit (TPD) parameters were derived automatically from SPECT images by comparison with sex-matched normal limits and applying a 3.0 average deviation criterion. The total extent of hyperenhancement expressed as the percentage of the left ventricle was derived from DE-MRI images by visual definition of myocardial contours and defects. DE-MRI and SPECT images were fused in 3 dimensions for visual comparison. Phantom data were also quantified using the same EXT and TPD measures for defects ranging from 5% to 70% of the myocardium. Results: The area under the receiver-operator-characteristic curve for the detection of infarct on immediate rest scans was 0.91 ± 0.03 for EXT and 0.90 ± 0.03 for TPD (P = not significant). The sensitivity and specificity for the detection of infarct by EXT on immediate 201Tl rest scan were 87% and 91%, respectively, with the optimal defect size threshold of 4%. Six of 7 cases with DE-MRI defects < 5% were detected by SPECT. Infarct sizes obtained from DE-MRI correlated well with EXT (slope = 0.94, offset = 3.8%; r = 0.84) and TPD (slope = 0.75, offset = 4.2%; r = 0.85) obtained from delayed SPECT 201Tl scans. Excellent correlation was observed between the SPECT quantification and the physical defect size for the phantom data. The actual size of the defect was better estimated by EXT (slope = 1.00, offset 1.33%; r = 0.99) than by TPD (slope = 0.79, offset = 1.9%; r = 0.99). Conclusion: Automated quantification of the EXT on myocardial perfusion SPECT images can reliably detect infarcts and measure infarct sizes.
Accurate sizing of myocardial perfusion defects provides important prognostic information after myocardial infarction (1). Quantitative methods for analysis of myocardial perfusion SPECT have been validated extensively for the detection of coronary artery disease (CAD) by comparison with coronary angiography (2), but such comparison does not allow validation of infarct detection or sizing. Validation of the myocardial perfusion SPECT quantification for defect sizing has been performed in animal models (3,4) and in phantom studies (5,6). This approach, however, is of limited use in evaluation of quantitative software tools as applied to patient studies, when images are compared with the database of normal scans to derive measures of perfusion defect extent and severity. Some studies suggest large variability in the measurements obtained by different quantitative SPECT techniques (7,8); therefore, there is a need to establish an appropriate reference standard and directly evaluate accuracy of these quantitative methods with respect to perfusion defect sizing.
Delayed-enhancement MRI (DE-MRI) is a highly accurate method for the noninvasive estimation of infarct size and location in the setting of either acute (9,10) or chronic (11,12) myocardial infarction. DE-MRI is now widely accepted as the gold standard for the quantitative estimation of infarct size and, thus, it presents an ideal comparator for validation of perfusion defect size by SPECT.
Recently, we have developed a simplified SPECT quantification scheme, which has been validated for the detection of CAD on stress SPECT images using coronary angiography as a gold standard (13). This new quantification scheme for myocardial perfusion quantification replaces the previous myocardial perfusion quantification and segmental scoring method based on optimization of segmental thresholds (14) in the new releases of the Cedars QPS software. The principal advantage of the new technique is a simplified creation of site-specific normal limits. In addition, the new method has improved performance for the detection of CAD in stress SPECT (13). In this study, we evaluate the performance (sensitivity and specificity) of the quantitative SPECT technique to detect infarcts using DE-MRI scans, which were performed on the same day as the SPECT scans, as a gold standard. We also validate the accuracy of this new quantitative algorithm for the estimation of rest defect size by comparison with DE-MRI in a subgroup of patients with available delayed redistribution 201Tl images. We further assess the performance of the SPECT quantification by examining phantom data with various defect sizes.
MATERIALS AND METHODS
Test Population
Infarct Detection.
The infarct detection was validated in a group of 82 patients (52 males, 30 females), with an average age ± SD of 70 ± 11 y. These were patients with known or suspected chronic CAD undergoing clinically indicated 201Tl SPECT who were recruited for an additional cardiac MRI examination. All patients with available 201Tl SPECT and DE-MRI scans were included in this study.
These patients underwent a combined study, which included cardiac MRI examination, rest 201Tl SPECT, and exercise or adenosine stress 99mTc-sestamibi SPECT. The stress SPECT scan, immediate rest SPECT scan, and MRI scan were obtained on the same day for a given patient. Twenty-seven of the 82 patients had a documented history of previous myocardial infarction. This study was approved by the Investigational Review Board at our institution, and all patients gave written consent for these tests. To evaluate infarct detection, we compared results of rest 201Tl SPECT with DE-MRI, since a stress perfusion defect with 99mTc-sestamibi may be present without infarction due to stress-induced ischemia.
Infarct Sizing.
A subgroup of 26 patients in the group of 82 patients also underwent delayed redistribution 201Tl SPECT. For the infarct size comparisons, we used delayed 201Tl scans to include the effect of redistribution and, therefore, exclude regions of hibernating myocardium, which could be hypoperfused on immediate rest images (15). Due to the redistribution effect, the extent of the defect on delayed 201Tl scans should be directly related to the infarct size determined by DE-MRI (16) and, thus, validation of infarct sizing by SPECT was performed using the delayed 201Tl scans only.
SPECT Acquisition and Reconstruction Protocols
Patient Acquisition.
SPECT acquisition was performed as previously described using a standard rest-redistribution 201Tl SPECT protocol (17). Elliptic orbit acquisition with 64 projections, 35 s per projection, was used on dual-detector γ-cameras (Forte, Philips-ADAC Laboratories; or E Cam, Siemens Medical Systems). For rest SPECT scans, patients were injected with 129.5–148 MBq (3.5–4 mCi) 201Tl intravenously. Rest imaging took place approximately 10 min after injection with electrocardiographic gating. The 201Tl acquisition parameters included 10% and 30% energy windows centered over the 165- and 68- to 80-keV peaks of 201Tl. For redistribution scans, patients returned and were imaged again at 18–24 h (n = 23), 48 h (n = 1), and 4 h (n = 2) after injection, without reinjection of 201Tl, using the same protocol as described. Gating was not performed for the delayed redistribution scans. All images were subject to standard quality control measures.
Phantom Acquisition.
SPECT studies of a cardiac phantom (RH-2; Capintec), acquired with the same acquisition parameters as standard clinical protocol, were also considered in this analysis. Phantom data were acquired with 99mTc and a total dose of 118.4 MBq (3.2 mCi) (77.7 MBq [2.1 mCi] in the central chamber and 40.7 MBq [1.1 mCi] in the myocardium) on a dual-detector Vertex (Philips-ADAC Laboratories) system. Scans were performed without any inserts as a reference and with 8 latex inserts with sizes comprising 5%, 10%, 20%, 30%, 40%, 50%, 60%, and 70% of the “myocardium” to simulate infarcted myocardium. Thus, 9 separate phantom datasets were analyzed. These scans were acquired as a part of the multicenter γ-camera trial organized by the Mayo Clinic (18) and were used retrospectively in this study to assess the performance of the automated quantification.
SPECT Reconstruction.
No attenuation or scatter correction was used. After iterative (maximum likelihood expectation maximization, 12 iterations) image reconstruction and filtering with a Butterworth filter (cutoff, 0.5 cycle/pixel on a 0–1 scale, order 10), short-axis images were generated automatically (19). In this study, only ungated summed short-axis rest and delayed redistribution rest scans were used.
MRI Protocol
MR images were acquired on a clinical 1.5-T scanner (Siemens Sonata). After routine scouting of the anatomic short and long axes of the heart, patients were injected with 0.2 mmol/kg of gadolinium contrast (gadodiamide, Omniscan; Amersham) and a period of 10–15 min was allowed to elapse before infarct imaging. DE images demonstrating viable and nonviable myocardium were acquired from base to apex in the short-axis orientation using a segmented inversion-recovery, steady-state free precession pulse sequence, as previously described (20). Imaging parameters were as follows: field of view, 340–400 × 300–400 mm; matrix size, 192 × (176–192); slice thickness, 8 mm; slice gap, 2 mm; echo time/repetition time, 1.1/700; pixel bandwidth, 1,185 kHz; flip angle, 50°. Depending on the heart rate, 5–9 phase-encoding lines were acquired per segment. Inversion time set to null normal myocardium was between 250 and 320 ms. For reference, 2- and 4-chamber long-axis DE-MRI images that covered the entire left ventricle (LV) were also acquired but these were not used for the infarct quantification.
SPECT Analysis
Comparison with Normal Limits.
After contours of the LV were determined by the software (21), raw myocardial counts were extracted from profiles normal to the LV surfaces and average count densities between epi- and endocardial surfaces were obtained for each profile. The number of profiles and the angular samples were standardized for all patients and were 20 and 36, respectively, which matched the number of samples in the normal database. These samples were compared with sex-matched normal limits (40 low-likelihood males, 40 low-likelihood females) using the simplified quantification approach (13). In this new approach, the average (mean absolute) deviation is used instead of the more commonly used SD due to more robust behavior in nongaussian distributions (22). The average deviation (ADev) for a given sample (x1…xn) is defined as follows:
 Eq. 1 where N is the sample size.
The threshold of 3.0 average deviations is approximately equivalent to 2.5 SDs, as used in other studies establishing normal limits for stress myocardial perfusion quantification (23,24). This cutoff level of 3.0 average deviations was used throughout the whole LV without regional modifications. For the phantom data, a uniform variation of 5% was assumed throughout the myocardium, based on our previous findings of the reproducibility of SPECT with cardiac phantom data (25), and was used in the form of a uniform variation map in place of the average deviation calculated for patient data. Nevertheless, the same software technique was used to quantify phantom and patient perfusion defects.
Defect Extent (EXT) Calculation.
The total perfusion EXT was computed using midmyocardial surfaces, which were positioned at the maximal radial count location between epi- and endocardial surfaces. This surface was limited by the valve plane (not included in the calculation of the LV surface). Average counts between epi- and endocardial surfaces for each radial sample were compared with the corresponding normal limit values. Pixels below normal limits were considered to belong to the perfusion defect. Midmyocardial defect area was computed by integration of all partial midmyocardial surface areas corresponding to each polar map sample. In this analysis, noncontiguous defects were summed together, since the total size of the infarcted regions is most important clinically and it may not be possible to separate larger defects on SPECT images. The total EXT was subsequently calculated as a percentage of the total midmyocardial surface area of the LV.
Total Perfusion Deficit (TPD) Calculation.
In addition to EXT, we defined a continuous TPD measure, which was designed to be equivalent to the definition of a visual summed score (26) combining EXT and severity. A floating-point score was assigned to each abnormal pixel on the polar map with the minimum abnormal score of 2.0 and a maximum score of 4.0 using linear mapping, based on how much the pixel value fell below the normal limit. A score of 0.0 was applied for the pixels within normal limits, and a maximum score of 4.0 was assigned to all pixels with values >70% below the normal limit. This threshold was derived from the subjective criteria used to assign a score of 4 in the visual reading. Subsequently, TPD was defined as follows:
 Eq. 2 where a, p are the radial coordinates of the polar map; A, P are the maximum number of samples in each dimension; score(a, p) is the pixel score at the polar map location (a, p); and Max_Score is the maximum pixel score (4.0). The theoretic maximum value for TPD was 100% for a case with no visible uptake (<70% below normal) in the entire LV. Thus, the TPD measure was designed to be equivalent to the commonly used summed segmental scoring (26) but had a continuous character and did not require arbitrary segmental definition.
MRI Analysis
Infarct Definition.
The infarct extent was delineated manually on the DE-MRI images by an experienced observer who was unaware of the SPECT quantification results. Infarct size was determined on DE-MRI scans as a percentage of the LV using methods previously described (27). Briefly, short-axis DE-MRI images were analyzed on a clinical workstation (Argus; Siemens Medical Systems), where endo- and epicardial borders were manually segmented from the base of the heart to the apex. In addition, the 3-dimensional (3D) regions of hyperenhanced myocardium were defined on each slice, based on visual assessment. If needed, multiple contours were drawn on the same slice. Papillary muscles were included in the determination. After such 2-dimensional (2D) contouring, total 3D LV and infarct sizes were computed using a modified Simpson’s rule (10) taking into account image pixel size, slice spacing, and coverage from base to apex. The total infarct size was then expressed as the percentage of the total LV volume. If multiple noncontiguous regions were detected, they were summed to obtain the total infarct size. A second expert observer verified the region assignment, and differences were resolved by consensus.
MRI/SPECT Image Fusion.
For the visual assessment of the results on SPECT and DE-MRI, we used cardiac image fusion software developed in our previous work (28). The registration of SPECT and DE-MRI images was performed manually, using interactive adjustment of rotational and translational parameters in 3D. Quantification of the defects on DE-MRI images was performed independently from the image alignment. Image fusion was used only to facilitate visual comparison and for the display of the results.
Statistical Analysis
All continuous variables are expressed as mean ± 1 SD. A threshold P < 0.05 was considered significant. The receiver-operator-characteristic (ROC) curve analysis was performed to estimate the performance for infarct detection. ROC curves were created using increments of 0.1% for the EXT and TPD values. All statistical calculations were performed using a software package from Analyze-It Software Ltd. The ROC curve comparison was performed using the Hanley and McNeil method for paired comparisons (29), which requires that all tests be performed on the same subjects.
RESULTS
The approximate boundaries of the myocardium needed to be manually constrained in 49 of 82 SPECT studies, before automatic contour detection could proceed, due to the failure of the automatic contour definition when applied to original data (mostly incorrect valve plane). In these cases, the computer performed automatic detection of the myocardial contours only in the user-defined volume of interest. The manual definition of the volume of interest required typically 30–40 s per case. This facility is available in QPS quantitative SPECT software from Cedars-Sinai. The average total processing time for the automatic contour detection was 2 s for a set of stress and rest data.
Thirty-eight of 82 cases had infarcts identified on DE-MRI scans. These infarcts ranged in size from 0.8% to 46.3%. The average size of the infarcts measured by DE-MRI for these 38 cases was 13.5% ± 11%. Figure 1 shows the ROC performance of the TPD and EXT measures for detection of infarcts by rest 201Tl scans, using the presence of infarct of any size on the DE-MRI scan as a gold standard. The area under the ROC curve for EXT and TPD parameters was found to be 0.91 ± 0.03 and 0.90 ± 0.03, respectively (P = not significant). From this ROC analysis, we can establish that, to maximize accuracy, the EXT threshold considered significant should be 4.0% and the TPD measure should be 3.9%. These numbers are consistent with those previously established for detection of stress perfusion defects (2). Using these thresholds, the sensitivity and specificity for infarct detection by EXT were 87% and 91%, respectively. The sensitivity and specificity of TPD were 87% and 86%, respectively. In the 38 patients with infarcts and 44 without, there were 4 false-positive and 5 false-negative results according to EXT parameter. Using TPD, there were 7 false-positive and 5 false-negative findings. Interestingly, 6 of 7 cases with DE-MRI defects < 5% were detected on SPECT by both the EXT and TPD measures.

ROC curve for detection of infarct by TPD and EXT measures on rest 201Tl SPECT (n = 82), using presence of infarct on DE-MRI as a gold standard.
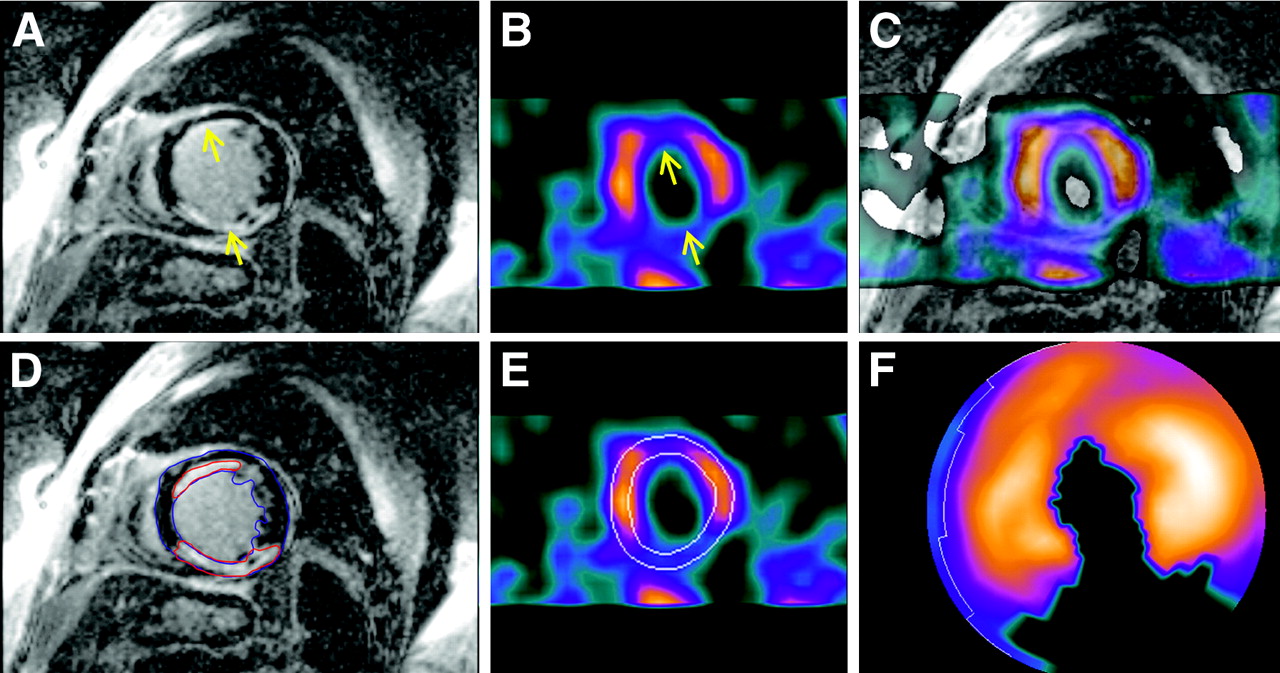
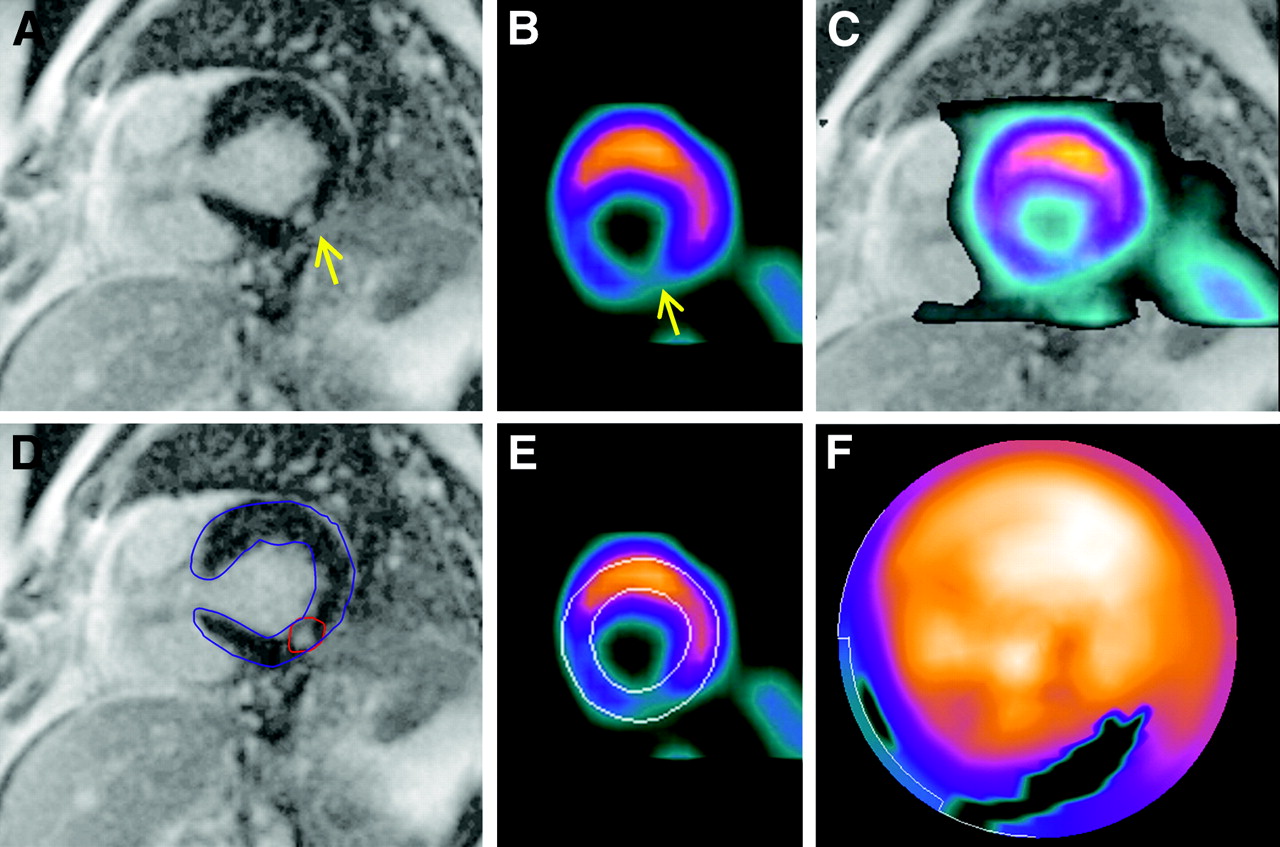
Twenty-four of 26 patients, in whom delayed 201Tl scans were obtained, had infarcts identified on DE-MRI. For those 24 cases, the average size of infarcts measured by DE-MRI was 16% ± 12%. On the delayed 201Tl SPECT scans, the average EXT measure was 18% ± 14% and the average TPD was 16% ± 11%. Figures 2 and 3 show 2 examples of DE-MRI images, registered and fused with 201Tl rest (delayed) SPECT images. Figure 2 illustrates an example of a patient with 2 infarcts. In Figure 3, an example of a small infarct is shown. This was the smallest infarct measured by DE-MRI (0.8%). Despite the small size, this defect was still detected by SPECT.

DE-MRI images and corresponding SPECT images in patient with extensive infarcted regions. Defect quantification results were 27% by DE-MRI, 31% by SPECT EXT, and 25% by SPECT TPD. (Top row) DE-MRI image (A), coregistered slice from delayed 201Tl rest SPECT (B), and fused MRI/SPECT image (C). (Bottom row) Definition of infarct regions (red) and LV contours (blue) on DE-MRI image (D), LV contours on corresponding SPECT slice (E), and polar map SPECT quantification (F). Arrows point to defect locations in A and B. DE-MRI scan contains no-reflow zones in inferior wall hyperenhancement region. No-reflow zones were included by the operator in overall infarct region. Note that anterior wall infarct was clearly resolved by SPECT despite being nontransmural.

Patient with smallest defect size as defined by DE-MRI in group of 82 patients. Quantification results were 0.8% by DE-MRI, 4.5% by SPECT EXT, and 4.8% by SPECT TPD. Labels A–F are the same as in Figure 2. Arrows point to defect locations in A and B.
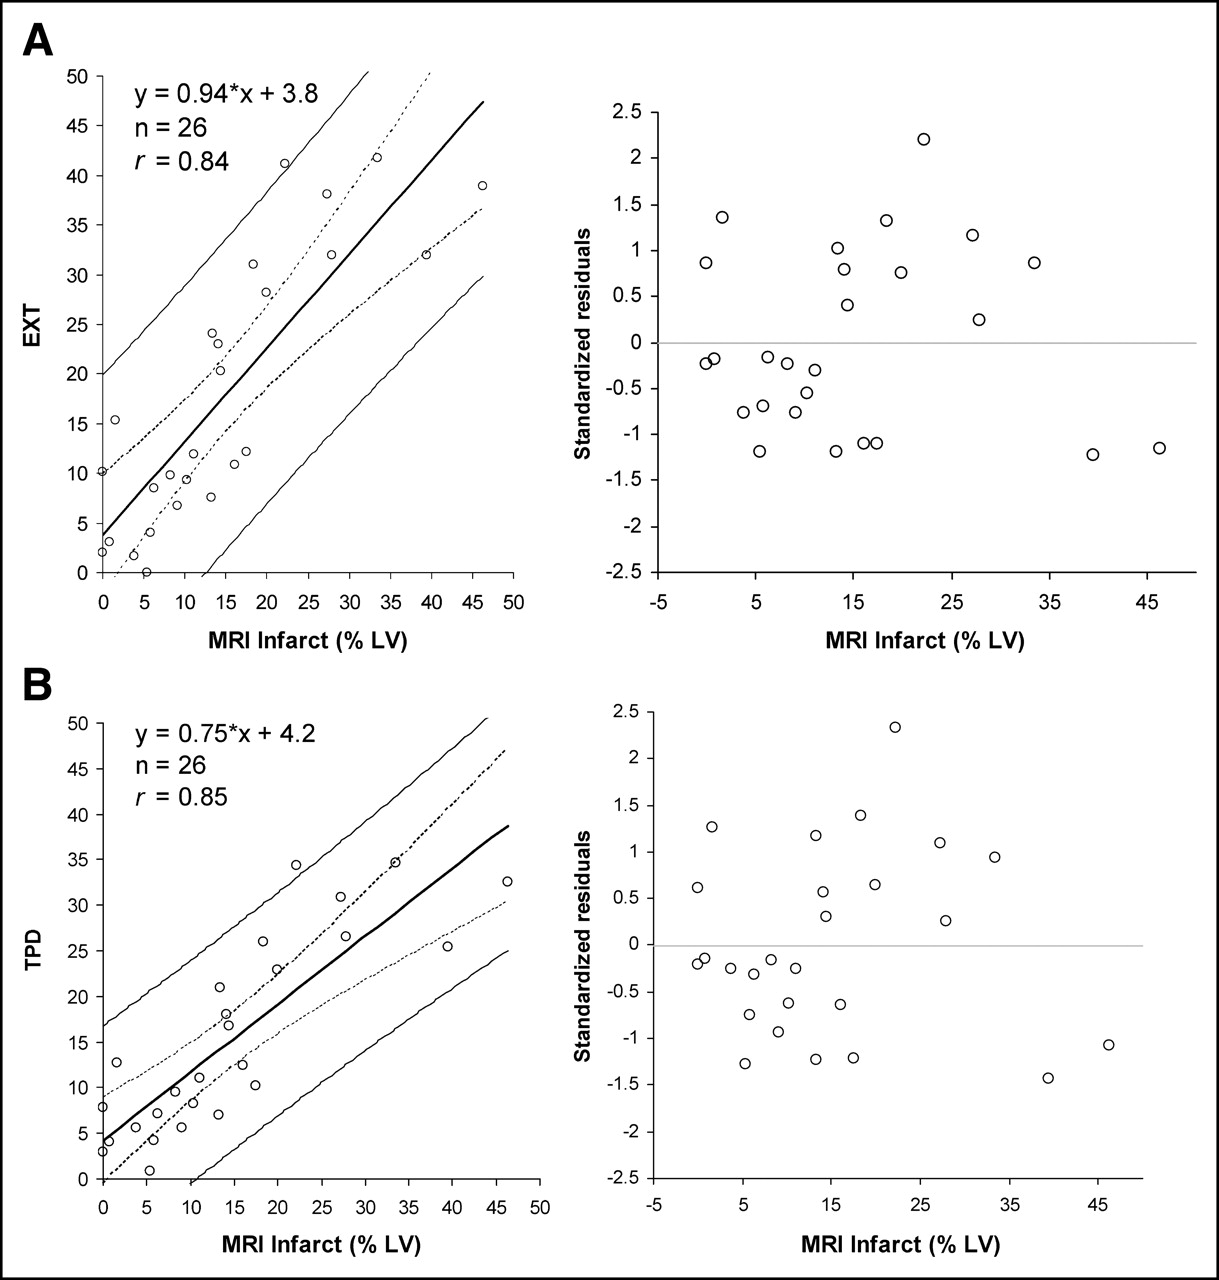
Figure 4 presents correlation and regression residual plots for the EXT (Fig. 4A) and TPD (Fig. 4B) measures obtained from delayed 201Tl scans (n = 26) and infarct sizes obtained by DE-MRI. The correlation coefficients were 0.84 for EXT and 0.85 for TPD (P < 0.0001). The regression equation for EXT as a function of DE-MRI infarct size was y = 0.94·x + 3.8% (SE = 7.4%). The regression equation for TPD as a function of DE-MRI defect size, was y = 0.75·x + 4.2% (SE = 5.8%).

Delayed 201Tl SPECT vs. DE-MRI infarct size (n = 26). Vertical distance between individual observations and fitted regression line is shown on regression residual plot in units of SDs (standardized residuals). (A) Linear regression and regression residual plots for SPECT EXT measure vs. infarct size defined by DE-MRI. (B) Linear regression and regression residual plots for SPECT TPD measure vs. infarct size defined by DE-MRI.
Figure 5 shows an example of the SPECT phantom image acquisition with overlaid contours. Figure 6 presents the correlation and regression residual plots for EXT (Fig. 6A) and TPD (Fig. 6B) measures obtained from the SPECT phantom data. The Pearson correlation coefficients for the EXT and TPD indicated excellent agreement (r = 0.99, P < 0.0001). The regression equation for EXT as a function of physical defect was y = 1.00·x + 1.33% (SE = 2.79%). The regression equation for the TPD as a function of physical defect was y = 0.79·x + 1.86% (SE = 3.23%), indicating a systematic underestimation of infarct size by TPD.
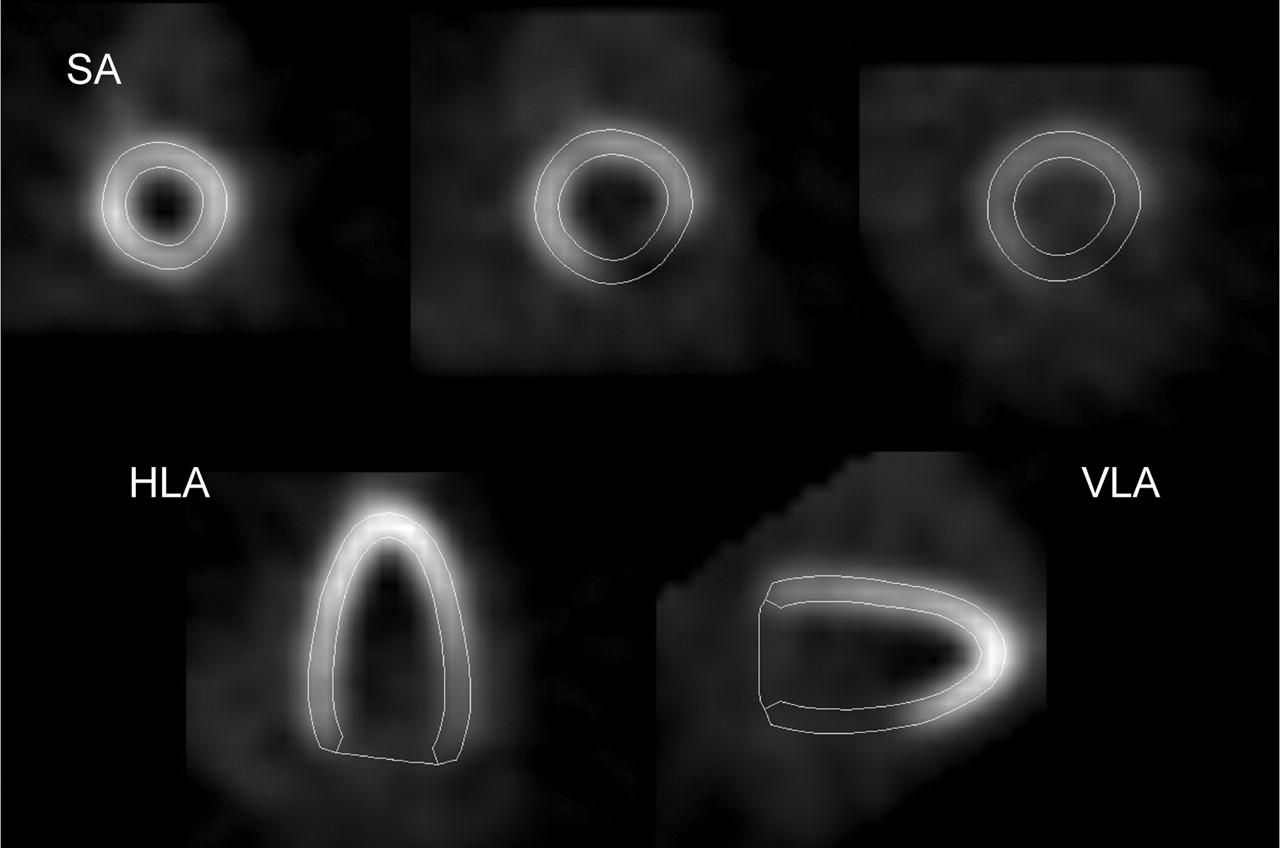
Example of phantom images with physical defect size of 21%. Results of quantification for this scan were EXT = 22.0% and TPD = 18.7%. Short-axis (SA), vertical long-axis (VLA), and horizontal long-axis (HLA) views are shown.
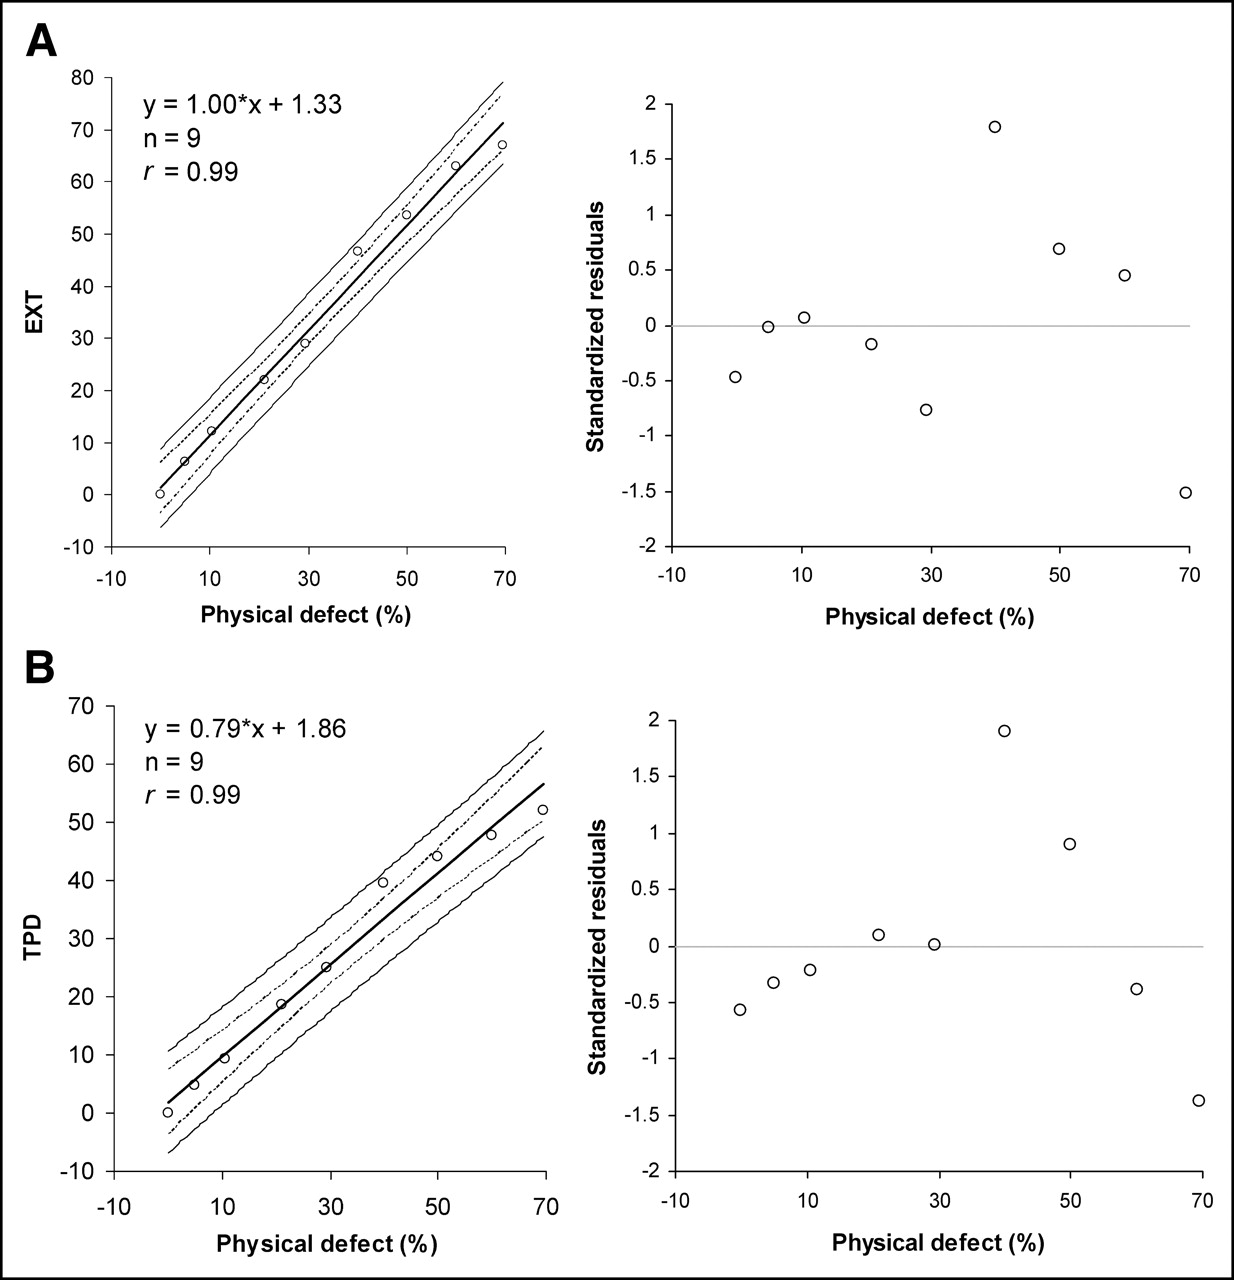
SPECT defect size vs. physical defect size in phantom scans (n = 9). (A) Linear regression and regression residual plots for SPECT EXT measure. (B) Linear regression and regression residual plots for SPECT TPD measure.
DISCUSSION
Although it has been demonstrated that SPECT can measure defect sizes accurately in phantom and animal studies (4,6,18), computer-based methods for estimating SPECT perfusion defects by comparison with normal limits had limited direct validation for detection or sizing of infarcts in humans. Most existing computer systems used in clinical practice—such as 4D-MSPECT from University of Michigan (30), Emory Toolbox from Emory University (31), and our QPS software (14), which now utilizes the quantification scheme described in this work—apply normal-limit methods to derive defect size. For clinical trial endpoints, the most commonly used system for infarct quantitation from SPECT is that of the Mayo Clinic, which employs a single threshold- based technique in 5 selected slices, without the use of normal limits. This method has been extensively validated (18) but not with DE-MRI. In this study, we use DE-MRI images, acquired on the same day as rest SPECT scans, as the gold standard for the validation of our new quantification technique for rest 201Tl myocardial perfusion SPECT. This technique will become the default method for the perfusion quantification in the new versions of the QPS software.
DE-MRI has been established as the reference standard for the infarct measurement in animal (10) and clinical models (12) and has become widely used clinically for the assessment of myocardial scarring. DE-MRI was previously compared with PET with regard to infarct sizing and detection using a subjective visual segmental scoring technique for PET (12). DE-MRI has also been compared with visually interpreted rest 201Tl SPECT (without redistribution images) in detection of transmural and nontransmural infarcts (32). Good correlation of size in visually measured infarcts by DE-MRI and 201Tl SPECT was shown in 12 patients with acute infarcts (33). In one recent study, quantitative normal-limit analysis (4D-MSPECT; University of Michigan, Ann Arbor) (30) was applied to compare defect sizes measured by 4-h delayed 201Tl with defect size obtained by DE-MRI. However, in that study, only acute infarcts were considered and the performance of SPECT for detection of infarcts was not evaluated. Furthermore, only 3 selected 2D DE-MRI slices were obtained rather than a full 3D volume.
The relatively similar number of cases with and without infarct (38 and 44, respectively), as determined by DE-MRI, allowed us to report the ROC performance of rest 201Tl SPECT for the detection of myocardial infarction. The area under the ROC curve for the infarct detection by the EXT measure was 0.91, which is similar to that reported for infarct detection by DE-MRI using 13N-ammonia PET as a gold standard (0.93) (12). In contrast to previous findings (32), we found that small infarcts can be detected by quantitative rest 201Tl SPECT.
Both correlation coefficient values of the TPD and EXT measures with DE-MRI EXT were high (r = 0.84 and 0.85, respectively; P = not significant). The slope for the EXT was closer to unity with an offset of 4%. However, when looking at the individual values, infarct size can be significantly over- or underestimated in individual cases (Fig. 4). Infarcts were overestimated by >10% by EXT in 5 of 26 cases and underestimated by >5% in 6 of 26 cases. This is likely a consequence of poor quality of delayed 201Tl imaging, variability of patient-specific attenuation in SPECT, and possible errors in the determination of infarct size by DE-MRI rather than limitation in the quantification methodology. In the phantom study, very accurate correlation of defect sizes (r = 0.99) was obtained (Fig. 6). Phantom data allowed us to establish that the quantitative measures defined in this study increase linearly for a wide range of perfusion defect sizes. Our phantom results are similar to those obtained when uniform count threshold is applied instead of the normal-limit approach (34).
The perfusion deficit measure appeared to underestimate the defect size for phantom data and, to some extent, for patient data (Figs. 4 and 6). This is primarily due to the apparent activity present within the portions of the infarcted myocardium due to photon scatter, partial-volume effects, and other effects, which reduce image resolution. Another factor that likely explains some discrepancy between TPD and EXT measures is what would be expected to occur in nontransmural infarction, when the contribution of the infarct to the perfusion deficit could be less than it is to the EXT.
An absolute defect volume, which could be derived from DE-MRI, cannot be reliably determined by SPECT due to partial-volume effects (35) and, consequently, difficulties in correctly estimating myocardial wall thickness. Because of these limitations, most current SPECT quantification methods, including ours, estimate defect size as a percentage of the midmyocardial LV area using polar map sampling, which precludes precise volumetric determination of the infarct on SPECT. The defect volumes expressed in milliliters could be potentially computed and compared with DE-MRI if voxel-based 3D methods (36) were applied to quantify the defect size by SPECT.
This study has some limitations due to imperfections in both DE-MRI and SPECT acquisitions. In this analysis, we used delayed distribution 201Tl SPECT for the correlation of the defect sizes with DE-MRI, since immediate 201Tl SPECT may overestimate or underestimate defect size. The overestimation would be expected in viable regions hypoperfused at rest, which might fill in with redistribution (15). Because of the phenomenon of reverse redistribution associated with nontransmural infarcts and open infarct-related arteries, the rest 201Tl images might also underestimate infarct size (37). However, a limitation of the delayed scans is that the quality and count level are often not optimal, due to radioactive decay. The noisy character of the data is therefore likely to explain the need for manual adjustment of initial contour location in a large percentage of the studies.
On the other hand, the estimation of the defect size by DE-MRI is also not perfect. The accuracy of defect sizing by DE-MRI in determination of the infarct size may be affected by the acquisition timing (38); however, in a recent study, the interscan coefficient of variability was found to be ±2.4% with a bias of 0.1% (39). The inter- and intra-observer variability in the manual definition of infarct size measurements by DE-MRI was determined to be 0.41% and 0.34%, respectively (40). It is also possible that some of the no-reflow zones on DE-MRI images, which do not exhibit the DE effect, might be missed by the regions of interest drawn (41). In general, however, these zones are usually seen within the region of DE-MRI (Fig. 2); therefore, this error is not likely to be large. The no-reflow effect was observed in only 2 of 82 patients and, as noted, was considered by the observer when defining the region.
CONCLUSION
Automatic quantitative SPECT technique based on normal limits can be used to accurately detect infarcts on rest 201Tl scans. Quantitative EXT and perfusion deficit measures obtained correlate well with the infarct size defined by DE-MRI and with the physical defect size in phantom studies.
Acknowledgments
We thank Jim Gerlach for his assistance in image data analysis. Cedars-Sinai Medical Center receives royalties for the licensure of software used in the quantitative assessment of myocardial perfusion, a portion of which is distributed to some of the authors of this article.
Footnotes
Received Sep. 16, 2004; revision accepted Dec. 17, 2004.
For correspondence or reprints contact: Piotr J. Slomka. PhD, Artificial Intelligence in Medicine Program, Department of Imaging, Cedars-Sinai Medical Center, 8700 Beverly Blvd., Suite A-047, Los Angeles, CA 90048.
E-mail: Piotr.Slomka{at}cshs.org


