


Abstract
Adenosine plays a critical role in both tumor proliferation and the cerebral response to tumor invasion. We used 8-cyclopentyl-3-(3-18F-fluoropropyl)-1-propylxanthine (18F-CPFPX) PET to investigate A1 adenosine receptor (A1AR) density as a potential indicator of the local cerebral response to glioma invasion. Methods: A1AR density in F98 glioma–bearing rats was examined by 18F-CPFPX and 3H-CPFPX using PET, quantitative in vitro and ex vivo double-label receptor autoradiography, and immunohistochemical analyses. Results: For all imaging modalities, A1AR signal intensity was increased in a zone surrounding experimental tumors (136%–146% that in control tissue) (P < 0.01). Immunostaining identified activated astrocytes as the main origin of peritumoral A1AR upregulation. The results of a pilot 18F-CPFPX PET study on a patient with recurrent glioblastoma multiforme confirmed increases in A1AR density in the immediate vicinity of the tumor. Conclusion: 18F-CPFPX PET is suitable for the detection of peritumoral changes in A1AR density. Molecular imaging with 18F-CPFPX PET may open novel possibilities for gaining experimental and clinical insights into the cerebral response to tumor invasion.
Neoplasms arising from glial cells are the most frequent primary brain tumors in adults. Despite considerable efforts, these tumors remain almost incurable because of their highly proliferative, infiltrative, and aggressive behaviors (1). The modulation of appropriate receptors in the invasion zone of tumors could augment cerebral antitumor responses, thus serving as an adjunct to tumor therapy. Identification and monitoring of peritumoral changes indicating the type and extent of the cerebral response to tumor invasion could advance this increasingly important branch of experimental and clinical research on brain tumors.
Adenosine is a ubiquitous modulator of cell metabolism and plays an important role in tumor growth and diffusion (2). It can promote tumor survival by stimulating carcinoma proliferation (3), and it is able to suppress the local antitumor immune response (4), which is partly mediated by adenosine surface receptors. Adenosine receptors expressed by cells in the invasion zone of tumors therefore may be targets for therapy strategies intended to augment antitumor responses and to block tumor proliferation. In this study, we investigate whether the novel A1 adenosine receptor (A1AR) PET ligand 8-cyclopentyl-3-(3-18F-fluoropropyl)-1-propylxanthine (18F-CPFPX) (5) is suitable for the detection of peritumoral A1ARs, which may serve as indicators of the cerebral response to tumor invasion.
MATERIALS AND METHODS
Cell Culture and Tumor Implantation
A previous publication (6) described the cell culture and the technique of tumor implantation in detail. The care and use of animals conformed to German law and received institutional approval (23.203.2 KFA 6/98). For tumor cell implantation, 13 male CDF (F-344) Fischer rats (body weight, 230–250 g; 8–12 wk old; Charles River Laboratories) were used. A suspension of F98 cells (either 104 or 106 cells in 5 μL saline) was stereotactically injected at a depth of 6.5 mm from the dural surface approximately 2 mm posterior and 4 mm lateral to the bregma. Neither intra- nor postoperative complications occurred. All experiments were performed 10 d after F98 cell implantation.
Immunohistochemical Analyses
At 7 d after F98 cell implantation, 5 rats were anesthetized with pentobarbital and transcardially perfused with 30 mL of physiologic saline and then with 120 mL of saline containing 20% sucrose for cryopreservation. For immunohistochemical studies, slices (20 μm) were submerged in Zamboni’s fixative for 48 h and then in 25% sucrose:phosphate-buffered saline (PBS; sodium phosphate at 10 mmol/L in 0.9% NaCl; pH 7.4), frozen, and sectioned at 50 μm. After 4 rinses in PBS, freely floating sections were incubated for 1 h in PBS containing 0.1% Triton X-100 and 10% normal goat serum (Vectastain; Camon). The sections then were incubated at 4°C for 48 h with primary monoclonal antibody to glial fibrillary acid protein (GFAP) (1:25; Boehringer) and polyclonal antibody to A1AR (1:300; Sigma). Alternate sections were immunostained with primary antibody to GFAP or microglia marker OX-42 (1:100; Serotec) and processed as previously described (7).
Radiopharmaceuticals
3H-CPFPX (8), 18F-CPFPX (9), and O-(2-18F-fluoroethyl)-l-tyrosine (18F-FET) (10) were synthesized with specific radioactivities of >2.1, >270, and >20 TBq/mmol, respectively, and a radiochemical purity exceeding 98%. They were dissolved in 0.9% saline containing 10% ethanol for intravenous injection and administered in PBS (pH 7.4).
Autoradiography and Image Processing
At 7 days after F98 cell implantation, 3 rats received an intravenous injection of a mixture of 10 MBq of 3H-CPFPX and 50 MBq of 18F-CPFPX. Two other rats received a mixture of 10 MBq of 3H-CPFPX and 50 MBq of 18F-FET. Animals were killed 20 min after tracer injection; the brains were removed immediately, frozen in 2-methylbutane at −50°C, and cut in coronal sections (20 μm) (CM 3050 instrument; Leica). Sections were placed on phosphorimaging plates along with industrial tritium activity standards (Microscales; Amersham Biosciences) for tritium studies and with calibrated 18F-labeled liver paste standards made in-house. The distribution of 18F radioactivity was recorded on imaging plates insensitive to β-particles of tritium (BAS-SR 2025; Raytest-Fuji). Tritium distribution was detected after the decay of 18F (10 half-lives) by use of a high-performance imaging plate reader (BAS5000 BioImage Analyzer; Raytest-Fuji) and tritium-sensitive imaging plates (BAS-TR 2025; Raytest-Fuji).
For in vitro displacement studies, brain sections were taken from 5 animals from the ex vivo studies and incubated at 22°C for 120 min with 3H-CPFPX at 4.4 nmol/L, with or without R(−)-N6-(2-phenylisopropyl)adenosine at 100 μmol/L, in Tris:HCl buffer (170 mmol/L; pH 7.4) containing adenosine deaminase at 2 IU/L and 5′-guanylimidodiphosphate at 100 μmol/L. An irregular region-of-interest analysis was carried out by standard image analysis (AIDA 2.31; Raytest), and statistical software (Prism 4.00; GraphPad) was used to process the digitized autoradiographic data.
High-Resolution Small-Animal PET and MRI
Three animals underwent sequential PET and MRI. Previous publications (11,12) described the experimental setup, data acquisition, and creation of high-resolution PET images. Animals were anesthetized with ketamine (100 mg/kg):xylazine (10 mg/kg) and received a bolus injection of 0.3 mL of 18F-CPFPX (37 MBq/mL dissolved in 0.9% NaCl:7% ethanol). PET data were acquired for 60 min after injection in 10 frames, each with a duration of 6 min. Upon completion of the PET scanning, the animals were killed by cervical dislocation, and their brains were processed for autoradiography.
Human PET Investigation
The human PET measurement method was approved by the Ethics Committee of the Medical Faculty of Heinrich-Heine-University Düsseldorf and was performed in accordance with a recently described method (5) after written informed consent had been obtained from the patient. In brief, the PET study was performed in three-dimensional mode with an ECAT EXACT HR+ scanner (Siemens-CTI). A slow bolus of 214.1 MBq (5.79 mCi) of 18F-CPFPX in 10 mL of saline was injected intravenously. Dynamic data were acquired over a 60-min period after injection. PET data were corrected for random and scattered radiation as well as attenuation. Data were subsequently Fourier rebinned into two-dimensional sinograms and reconstructed by filtered backprojection (Shepp filter, 2.5 mm) with a pixel size of 2 × 2 mm2. The ratio of specific uptake to nonspecific uptake, represented by (region-of-interest uptake − cerebellar uptake)/cerebellar uptake, was calculated as a surrogate of the regional binding potential.
RESULTS
We observed a significant increase in 3H-CPFPX binding in the vicinity of implanted F98 gliomas (Figs. 1A and 1B). Peritumoral A1AR density ranged between 54.1 and 100.1 fmol/mg (wet weight), a level 136%–146% that in control tissue (contralateral temporal cortex) and 168%–198% that in the total tumor. Average absolute peritumoral A1AR-binding capacity was significantly higher than receptor binding in the tumor (P < 0.01) and in the control region (P < 0.01). Outside the tumor, the pattern of 3H-CPFPX binding was typical of that of rat cerebral A1ARs, that is, low nonspecific background binding (maximum 7% total binding) and high specific binding in the cerebral cortex, cerebellar cortex, hippocampus, and distinct thalamic nuclei (12). In vitro autoradiography with 3H-CPFPX excluded the possibility that peritumoral tracer accumulation was caused primarily by pathologically increased permeability of the blood–brain barrier. Ex vivo and in vitro patterns of peritumoral A1AR binding were identical. R(−)-N6-(2-phenylisopropyl)adenosine at 100 μmol/L completely displaced 3H-CPFPX binding, demonstrating that the radioligand is bound specifically to A1ARs.

Autoradiographic studies. (A) Quantification of data from F98 glioma ex vivo animal experiments reveals that receptor densities in tumor margin, tumor (total), and control region (contralateral temporal cortex [Temp. ctx.]) differ significantly (P < 0.01) (asterisks). WW = wet weight. Error bars indicate SDs. (B) Two representative ex vivo autoradiographs display intense accumulation of 3H-CPFPX at periphery of tumor. Left panel displays solid tumor; right panel displays tumor with central necrosis. Ex vivo experiments were performed 10 d after implantation of F98 tumor cells in right caudate putamen. (C) Same sections as in B. Ex vivo autoradiographs obtained with 18F-FET delineate solid tumor mass. For direct reading of absolute receptor density and amino acid (AA) uptake, see black–white scales between sections. (D) Histograms of 3H-CPFPX (red line), 18F-FET (green line), and Nissl stain (blue line) taken from levels indicated by respective colored lines in B, C, and E. A1AR density peaks at margin of solid tumor mass. OD = optical density. (E) Nissl stains of 2 sections depicted in B and C.
Double-label autoradiography with 3H-CPFPX and 18F-FET was used to determine whether the zone of increased A1AR density was part of the tumor or located adjacent to it (6). The solid parts of tumors exhibited homogeneous 18F-FET uptake (Fig. 1C). Coregistration of 3H-CPFPX and 18F-FET autoradiographs showed that the region of increased A1AR density was located primarily outside the tumor mass, slightly overlapping the solid parts of tumors (Fig. 1D). The histologic findings (Fig. 1E) confirmed that conclusion.
Cell types responsible for the increase in A1AR density were identified by immunohistochemical analyses. GFAP, OX-42, and a nonphosphorylated neurofilament (SMI311) served as markers for astrocytes, activated microglia, and neurons, respectively. GFAP immunoreactivity was enhanced in the vicinity of tumors, matching the distribution of A1ARs (Fig. 2A). In contrast, the zone of activated microglia, defined by OX-42 immunoreactivity, extended far beyond the vicinity of tumors (Fig. 2B). Double-label immunofluorescence revealed a partial overlap of A1AR immunoreactivity and GFAP immunoreactivity (Figs. 2C and 2D). In the vicinity of tumors, colocalization of A1AR labeling and SMI311 immunoreactivity was seen (Fig. 2E). In accordance with the autoradiographic findings for A1AR expression, several tumor cells also showed A1AR immunoreactivity (Fig. 2C).
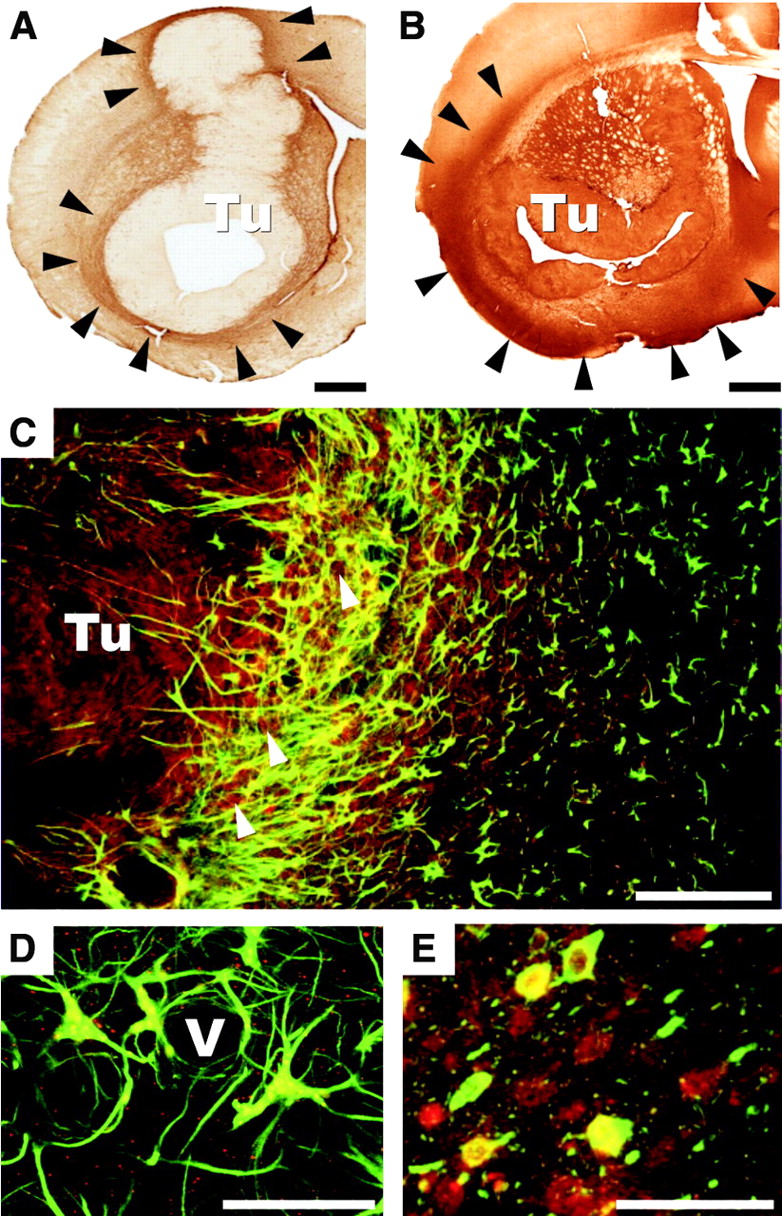
Immunohistochemical analyses and fluorescence microscopy of sections from rat brain gliomas 10 d after implantation of tumor cells in right caudate putamen. (A) GFAP immunoreactivity of reactive astrocytes is increased in immediate vicinity of tumor (Tu), as indicated by arrowheads. Scale bar = 1 mm. (B) OX-42 immunoreactivity as a marker of activated microglia spreads far beyond peritumoral zone into cortical and limbic regions, as indicated by arrowheads. Scale bar = 1 mm. (C) Confocal fluorescence images of GFAP (green) and A1AR (red) in tumor periphery indicate that a subpopulation of GFAP-immunopositive cells expresses A1ARs (yellow). Tumor cells in solid tumor mass as well as in invasion zone (arrowheads) are also immunoreactive for A1ARs (red). Scale bar =200 μm. (D) High magnification of C. Subpopulation of astrocytes closely associated with a vessel (V) in tumor margin is immunoreactive for both GFAP (green) and A1ARs (red). Cellular colocalization is indicated by yellow. A1AR immunoreactivity (red) is also found next to cells staining for GFAP. Scale bar = 25 μm. (E) Confocal microscopy of neuronal marker SMI311 (green) and A1AR (red) indicating cellular colocalization of both immunostains (yellow). Scale bar = 50 μm.
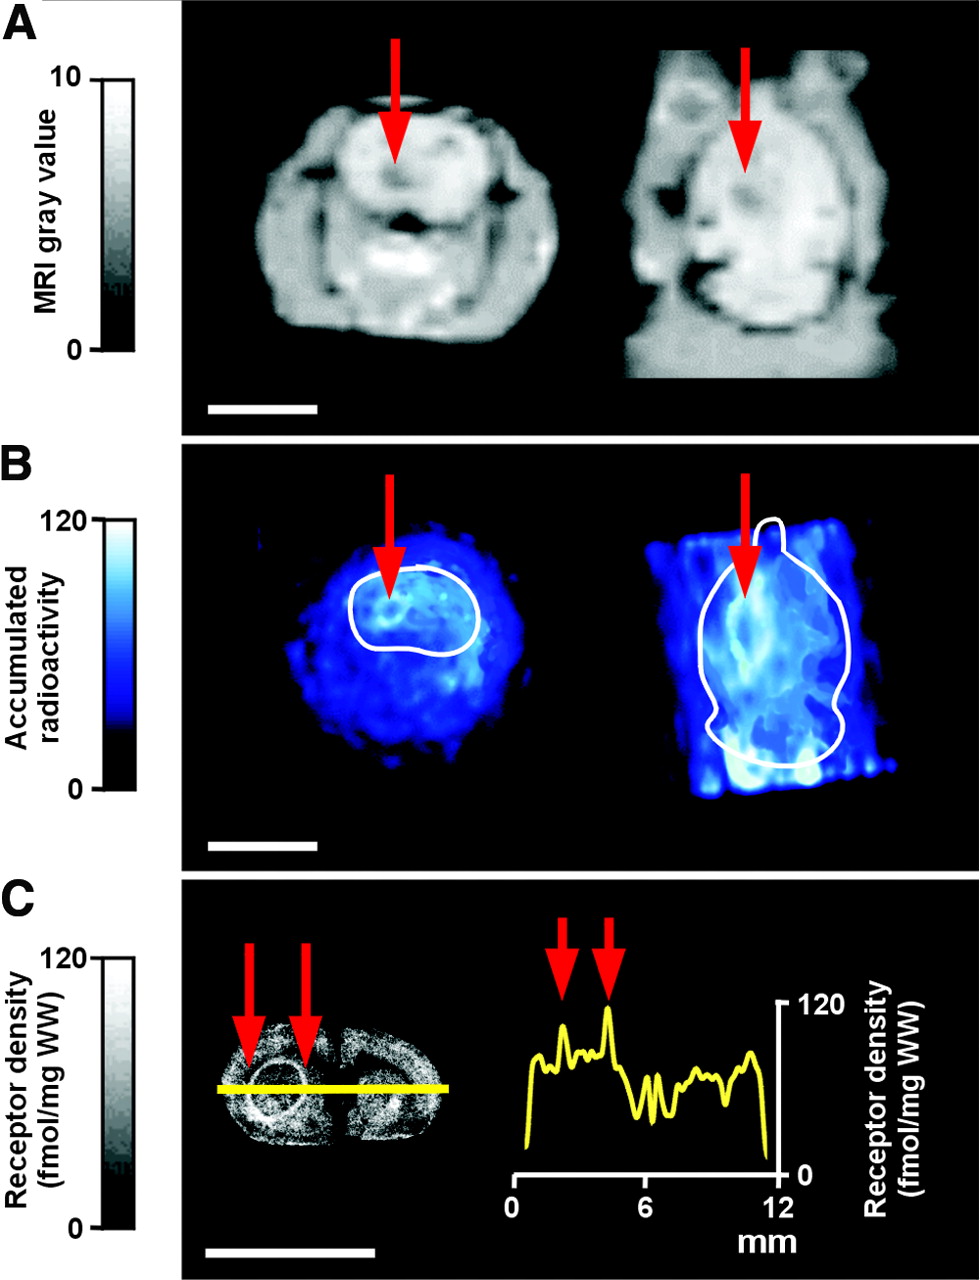
Combined high-resolution MRI and A1AR PET (11,12) confirmed the usefulness of in vivo imaging in the F98 glioma model. MR images served to identify tumors and anatomic structures (Fig. 3A). The MRI tumor contour served as an overlay, which was transferred to individually coregistered animal PET datasets. After intravenous injection of 18F-CPFPX, brain uptake was rapid (12), reaching the maximum in less than 6 min. A high accumulation of 18F-CPFPX clearly marked the border of the tumor (Fig. 3B). PET experiments were complemented by ex vivo dissection and autoradiographic evaluation of the brain, which confirmed the circumferential accumulation of 18F-CPFPX at the tumor margin (Fig. 3C).

Representative examples of tumor-bearing rat 10 d after implantation of F98 cells in left caudate putamen, as measured by 18F-CPFPX and high-resolution small-animal PET. (A) MRI depicting tumor (red arrows) as hypointense zone in coronal (left) and horizontal (right) sections. (B) Summed PET images of coronal (left) and horizontal (right) sections (frames 3–10, 48-min scan time). White tracing outlines outer brain contour based on individually coregistered MRI datasets depicted in A, which were subsequently superimposed onto PET datasets. Note significant tracer accumulation at tumor border (red arrows), coinciding with outer border of hypointense zone determined by MRI (red arrows in A). Other signals represent normal cerebral tracer accumulation and the tracer and its metabolites in blood vessels. (C) Ex vivo autoradiograph (left) taken from PET experiment shown in B confirms circumferential accumulation of 18F-CPFPX in tumor region at highest spatial resolution. Histogram (right) constructed from data measured along superimposed yellow line shows that accumulation of radiotracer at periphery of tumor (red arrows) clearly exceeds that in normal brain tissue. WW = wet weight. Scale bar in all panels = 10 mm.
A PET study of a 43-y-old patient with histologically proven recurrent glioblastoma multiforme revealed a high accumulation of 18F-CPFPX at the circumference of the tumor and a lower accumulation in the center of the tumor (Fig. 4), corresponding to the findings from the experimental F98 glioma model.

Human PET study. (A) Coregistered planes of contrast agent–enhanced MR image (left) and 18F-CPFPX PET image (right) of recurrent glioblastoma multiforme in right temporal region. Circular zone (white arrowheads) in MR image indicates top of solid tumor and surrounding tissue. (B) Circular accumulation (boxed area) of 18F-CPFPX (right) corresponding to contrast agent–enhanced region in MR image (left). (C) High magnification of B. Adjacent to circular peritumoral ligand accumulation, a zone of gray matter, most likely temporal cortex, has been compressed and displaced by tumor (arrowheads).
DISCUSSION
In this study, we investigated peritumoral A1ARs as potential molecular targets for monitoring the cerebral response to glioma invasion. Reports of increased expression of A1AR mRNA in colorectal cancer and adjacent mucosa (13) have indicated that cancer-associated alterations in A1AR density are not restricted to brain tissue. This finding may indicate that a nonspecific factor contributes to A1AR upregulation. Microdialysis studies of human gliomas with a high grade of malignancy (14) have shown that extracellular adenosine levels are significantly lower in tumors than in control tissue. Thus, chronically low levels of endogenous adenosine may induce the upregulation of A1ARs on cells at the tumor periphery.
Besides nonspecific effects, changes in the cellular composition of the invasion zone may be responsible for increased A1AR density. Peritumoral tissue is invaded by tumor and vascular endothelial cells and infiltrated by activated macrophages, microglia, and reactive astrocytes. Our autoradiographic and immunohistochemical studies demonstrated that increased peritumoral A1AR density occurs mainly on GFAP-positive astrocytes. Activated astrocytes contribute significantly to tissue repair in the zone surrounding brain tumors as well as ischemic infarcts and trauma (15,16). Consistent with such a role, A1AR density is also increased at the borders of central necroses in experimental gliomas.
Besides its potential role in the local cerebral response to tumor invasion, a change in cerebral A1AR density may have implications for tumor-associated epilepsy. Adenosine, acting through both pre- and postsynaptic A1ARs, is a highly potent antiictal neuromodulator (17). Because epilepsy occurs frequently in cerebral tumors (18), A1ARs at tumor borders may represent potential targets for the treatment of this type of epilepsy.
Investigating the potential diagnostic and therapeutic consequences of peritumoral A1AR upregulation will inevitably require in vivo studies, because the complexity of interactions between the tumor and the reactive zone can hardly be emulated in vitro. We demonstrate that A1ARs in the peritumoral zone can be identified in vivo by 18F-CPFPX PET in both experimental rat brain tumors and human gliomas. Thus, molecular imaging with 18F-CPFPX PET will both allow longitudinal animal studies of pharmaceutical modulation of peritumoral A1ARs and permit clinical investigations to collect data on tumor invasion in humans.
CONCLUSION
In this study, we investigated cerebral A1ARs as potential indicators of the cerebral response to glioma invasion. For all imaging modalities, A1AR signal intensity was increased in a zone surrounding experimental tumors in a rat glioma model. The results of the first 18F-CPFPX PET study on a patient with recurrent glioblastoma confirmed the findings of animal experiments indicating that A1AR participates in the cerebral response to tumor invasion. Molecular imaging with 18F-CPFPX PET thus may open novel possibilities for gaining experimental and clinical insights into the cerebral response to tumor invasion.
Acknowledgments
The excellent technical assistance of Markus Cremer is gratefully acknowledged. This work was supported by grants from the Hermann von Helmholtz-Gemeinschaft Deutscher Forschungszentren, the American Heart Association—Edward C. Wright Chair in Cardiovascular Research, the University of South Florida, and the German Federal Ministry of Education and Research (Brain Imaging Center West).
Footnotes
Received Aug. 11, 2004; revision accepted Sep. 30, 2004.
For correspondence or reprints contact: Andreas Bauer, MD, Institute of Medicine, Research Center Jülich, 52425 Jülich, Germany.
E-mail: an.bauer{at}fz-juelich.de


