


Abstract
The importance of accurate attenuation correction, especially for imaging of the thorax region, is widely acknowledged. Appropriate compensation methods have been developed and introduced into clinical practice. Most of these methods use attenuation maps obtained using various transmission scanning systems. However, when maps are inaccurate, the correction procedure may introduce artifacts into the final images that can be difficult to identify and might inadvertently alter diagnosis and study outcome. As a result, attenuation correction is often avoided in clinical practice. Our objective was to examine issues related to the quality of attenuation maps and the effects that map artifacts may have on attenuation-corrected emission images. Methods: The topics that are investigated include the problem of low transmission counts, cross-talk contributions from the emission isotope, truncation of the transmission data, and methods of map reconstruction and segmentation. Examples of patient studies displaying specific problems guided our investigations, but, because truth in these studies is seldom known, analytic and Monte Carlo-simulated data were used in the analysis. Attenuation maps and final emission images were visually checked for artifacts and for the presence of perfusion defects. In addition, quantitative evaluation of map uniformity, defect visibility, and size variation was performed. Results: The statistical paired-sample t test showed significant (P < 0.05) improvement of relative SD for attenuation maps reconstructed with iterative methods as compared with filtered backprojection and for maps created with higher photon fluxes. When maps with artifacts were used to correct emission data, an increase in myocardial infarct size and creation of false heart defects were observed. Conclusion: Our study strongly recommends that at least a visual inspection of the quality of attenuation maps be performed before their use in compensation procedures. To improve image quality, remove artifacts, and increase diagnostic confidence, attenuation maps used in the correction procedure must be accurate and free of artifacts.
The importance of accurate compensation for attenuation effects in SPECT is already widely recognized. Attenuation may lead to artifacts and inaccuracies in reconstructed images, occurrences that are particularly disturbing in myocardial perfusion scans because of the highly nonuniform distribution of tissue in the thorax region (1–5). Several studies have demonstrated that image quality can be considerably improved by incorporating attenuation correction into an iterative reconstruction method (6–8).
To make the correction properly, attenuation maps containing detailed information about density distribution in the body are required. In principle, these maps can be computed using only emission data, but this approach is still too complex and time consuming for routine use (9,10). The majority of clinical attenuation compensation techniques, therefore, use maps reconstructed from data obtained in transmission scans. Such patient-specific compensation methods, based on experimentally measured maps, should create substantially improved images, but there have been serious problems with the technique, creating distrust and leading to heated debates about the value of attenuation correction. Several reviews have shown that attenuation correction methods that are currently available on clinical cameras can introduce artifacts that may be difficult to identify and might inadvertently alter diagnoses and study outcomes (4,11). As a result, the attenuation correction option is often avoided in clinical practice, even in those centers that have all the necessary equipment.
Several different transmission systems have been proposed, such as: (A) a single line source with symmetric (12) or asymmetric (13,14) fanbeam geometry, (B) a scanning line source with parallel-hole collimator (15), (C) a multiple line source system (16), (D) a scanning high-energy point source, and (E) a CT system operating on the SPECT camera (17).
The most popular of these are B and C, with a 153Gd source emitting 100 keV photons; system D, using a 133Ba source with 356 and 383 keV photons; and E, using a broad energy spectrum of x-rays.
The need for strict quality control and appropriate testing protocols for transmission systems has long been identified (2). Creation of such protocols is, however, a difficult task because of the wide variety of transmission systems, each with its own characteristics and different calibration and correction requisites. For example, some systems perform transmission and emission scans in sequence, others simultaneously. However, in both situations, scattered emission photons recorded in the transmission energy window (cross-talk effect) create a problem that is only reduced, not eliminated, by electronic collimation used in scanning line systems. Some use static and others tomographic blank scans. The shapes, energies, and intensities of the transmission photon beams also vary.
Regardless of the system used, the final result of the transmission scan is an attenuation map of the patient, and the accuracy of this map is of paramount importance for the correction procedure. In everyday clinical practice, the maps are seldom viewed or checked for artifacts. Additional quality control problems arise when clinical software includes other (often approximate) corrections to compensate for such effects as scatter and collimator blurring. As a result of applying some or all of these, the relationships among the initial data, map quality, and accuracy of the final corrected image are quite complex. An investigation of all these issues would be especially difficult for clinical images because of the wide range of variations in patient anatomy and lack of information about the truth.
This study focuses on the complex relationships between the quality of the map and the accuracy of the attenuation correction and investigates the effects introduced by map artifacts into the attenuation-corrected emission images without any scatter correction. Present work is restricted to isotope-based transmission systems, and CT systems will be investigated in the future. We strongly believe that attenuation correction substantially improves the accuracy of emission images but only when it is properly performed. Our aim is to raise users’ awareness by demonstrating that incorrect maps may indeed produce false perfusion defects. By showing this, we want to prove the need for stricter quality control and motivate the user to check the accuracy of the attenuation map before reading attenuation-corrected images. We investigated the following issues: low or missing counts in the transmission data, cross-talk correction for scattered emission photons, truncation of the attenuation map, the method used for map reconstruction, and effects related to the use of a segmented map.
Qualitative and quantitative analyses of attenuation maps and of attenuation-corrected emission images were performed using simulations with the thorax mathematic cardiac torso (MCAT) phantom, because this approach allowed us to control the data and also to know the “truth” (18). Examples of patient attenuation maps displaying specific problems from clinical myocardial perfusion studies were used to guide the study and to illustrate different issues. Examples of such maps are presented in Figure 1, often with more than a single effect contributing to the final strongly altered density distribution.
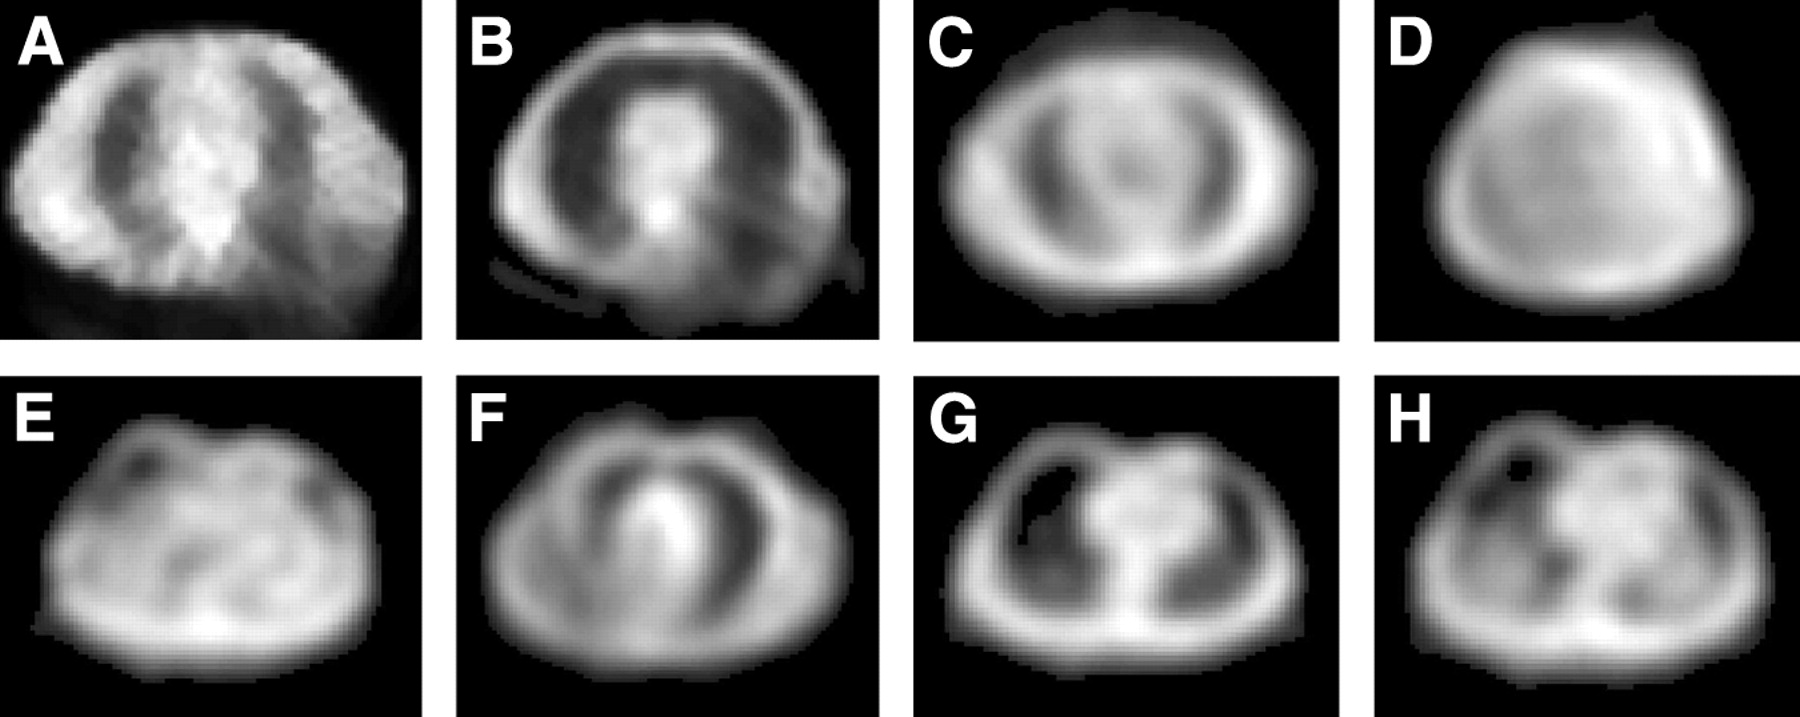
Examples of patient attenuation maps displaying problems discussed in this study: truncation from Beacon system seen in posterior torso (A and B), area of decreased attenuation in center of thorax (C), truncation from Profile system seen as large variation in attenuation coefficient across abdomen (D), appearance of “false” lungs near anterior abdominal surface (E), right lung appears as 2 lungs (“third lung” effect) (F), anterior wall of chest showing attenuation coefficients appreciably lower than those in central and posterior regions (G and H).
MATERIALS AND METHODS
Transmission Data Simulations
Transmission and blank data were created using our Analytic Transmission Simulator (ATS) (19). This program generates 2-dimensional (2D) transmission projections for different geometries of the source using a density distribution map of the object and taking into account collimator acceptance angles on the source and detector sides. A 153Gd source was used in these simulations. Scatter of transmission photons was not simulated, because our earlier study showed scatter to have a less than 1% contribution to the primary events (20). Two shapes of transmission photon beams were investigated: (A) uniform: a uniform photon flux distribution, such as that produced by a scanning line source (for example, the VantagePro system by Philips Medical Systems), and (B) profile: a parabola-like shape of the photon flux, such as that as created by a multiple-line system (for example, the Profile system by Siemens Medical Solutions).
Poisson-type noise was added to these data to model transmission scans with maximum photon fluxes ranging from 200 to 10,000 counts/pixel per projection. These numbers must be related to those observed in clinical transmission systems. A newly installed set of line sources for the Siemens Profile has a total activity of 3,700 MBq (100 mCi), with the strongest lines measuring 740 MBq each. This activity produces approximately 650 counts in a maximum pixel for a 20 s projection scan as used in a standard rest sestamibi heart perfusion study. The Profile source system is allowed to decay to half of its initial activity before the weakest sources are removed while the 2 central line sources are replaced by new ones and the old sources are shifted to more outside positions. By the time of source exchange, counts in a 20 s scan drop to a level of 300–350 in a maximum pixel. A newly installed line source in the VantagePro system has an activity of 7,400 MBq (200 mCi), and, initially, absorbers are used to lower the intensity of the photon flux. The empirically determined count level produced by the new scanning line source is about 380–400 counts per pixel in a 20 s projection and drops to about 200 before the source exchange. Therefore, the 200 and 500 count levels used in our simulations correspond to transmission studies performed with old and almost newly installed sources, respectively. The 2,000 and 10,000 count levels correspond to high and very high statistics modeling, which we consider as a “very good” and an “ideal” case, respectively. As will be discussed later, transmission systems producing such counting rates would be clinically viable.
The full range of photon flux values was used only in tests of the missing count problem. Other studies were performed for 500 and 2,000 counts/pixel to model the strengths of currently available transmission sources and to compare with ones that almost never create missing counts.
The MCAT phantom was used as the attenuator. A female phantom was chosen to provide enhanced attenuation from breast tissue. The camera system had a 40 × 50 cm detector equipped with a parallel-hole, high-resolution (HIRES) collimator, with the acceptance angle equal to 2.7°. The energy resolution of the detector was assumed to be 10%, with a 3 mm intrinsic spatial resolution. The distance between the detector and the transmission source was set at 115 cm, and the source collimator had a 5.3° opening angle. Projections were created in a 128 × 128 matrix with a pixel size of 0.36 cm. The simulated acquisition was performed using a standard 180° cardiac rotation protocol with a circular orbit, radius of rotation of 32 cm, and a total of 64 projections.
In all cases except where specified, attenuation maps were reconstructed using 2 methods: filtered backprojection (FBP) and ordered subsets transmission gradient (OSTG) (19). The OSTG algorithm corresponds to a modified version of the maximum likelihood transmission gradient (MLTG) method (21,22). The OSTG algorithm is expressed as:
 Eq. 1 where μjk+1 is the value of attenuation coefficient at pixel j obtained in the k + 1 iteration step. The iteration procedure uses cyclic ordering with n = k(mod(Nsub)) + 1, where the number of subsets Sn is equal to Nsub. The length of the intersection of the line of response corresponding to camera bin i with pixel j is lij, and ci and Ti are the counts measured in projection bin i in the blank and transmission scans, respectively.
Emission Data Simulations
The same MCAT phantom was used to model the activity distribution in the thorax. Three different phantoms were created: with a normal heart (total volume, 152 mL) and with perfusion defects (21 mL) located in the inferior wall and the septal wall of the myocardium. The thickness of the apex of the myocardium was reduced to a thickness half that of the remainder of the left ventricular myocardium to reflect the usual clinical situation, but no defect was simulated in the apex. The activity distribution was modeled on a standard clinical sestamibi stress study, with a 99mTc activity of 925 MBq, 5% of it localizing in the heart. The activity concentration in the healthy myocardium was equal to 148 kBq/cm3, with infarcts containing 60 kBq/cm3, the surrounding background tissue containing 37 kBq/cm3, and the lungs containing 18.5 kBq/cm3. A matrix size of 128 × 128 × 47 was used.
The projection data were generated with the Monte Carlo code (23). The emission acquisition was performed with the true MCAT density distribution map. The detector characteristics and HIRES collimator response function were the same as those used in transmission simulations. In all, 64 projections evenly spaced over 180° were acquired for 20 s each. The projection matrix size was 128 × 128 with 0.36 cm bins.
The emission data were reconstructed with ideal attenuation maps and with ones containing artifacts resulting from the various investigated problems. The ordered subset expectation maximization (OSEM) method with 3D resolution recovery was used (24).
Investigated Problems
Missing Count Problem.
As mentioned, transmission data were generated for source strengths producing maximum fluxes ranging from 200 to 10,000 counts/pixel for both transmission systems. Because in the low-count simulations some of the bins in the transmission projections did not record any counts, these data were used to investigate the missing count effect and its impact on the accuracy of the emission images. For FBP reconstruction, the transmission sinogram values 1n(N/N0), corresponding to pixels with zero counts, were replaced with zeros. For iterative reconstructions (see Eqs. 1 and 2) the true values were used. The high-count simulations served as a reference in these studies.
Cross-Talk Problem.
The cross-talk effect relating to scattered 140 keV emission photons contributing to the 100 keV transmission window was investigated only for the profile system, because the scanning line source system uses an electronic mask to block the majority of cross-talk photons from being recorded. For this study, transmission projections were combined with emission data as they would be in a real clinical case. Emission projections in 4 energy windows were created similar to those used in the Siemens Profile system: (a) emission 20% window centered at 140 keV, (b) transmission 20% window centered at 100 keV, and (c) and (d) cross-talk scatter estimate windows of 8% centered at 86 keV and 12% centered at 116 keV. To model cross-talk effects as they would occur in a real clinical study, the emission projections generated in window (b) were added to the ATS transmission projection (transmission + cross-talk).
Three approaches to cross-talk correction were investigated: no correction reconstructed with FBP, a simple dual-window subtraction method reconstructed with both FBP and OSTG, and a correction incorporated into the OSTG iterative algorithm (OSTG-S) (21,25). In the subtraction method, the cross-talk estimate corresponding to the projection data in the summed energy windows (c) and (d) were scaled by a factor of 1.1 and subtracted from the transmission + cross-talk projections. The OSTG-S approach incorporated the cross-talk estimate from summed windows (c) and (d) directly into the iterative OSTG algorithm. The OSTG-S algorithm is a modified version of the OSTG method:
 Eq. 2 where si corresponds to cross-talk counts measured in the projection bin i.
Truncation Effects.
Two types of truncation effects were investigated, because both occur in real clinical studies and result in different map artifacts. The first type may occur in the Profile transmission system and is caused by suboptimal positioning of the patient relative to the maximum of the transmission beam. The basic requirement of this system is that the center of the parabola-like photon flux should pass through the center of the patient. If this is not the case, then, especially for large patients, one side of the body gets too few photons, creating a missing count problem and an artifact in the map. A particularly dramatic case of missing counts could result in a map with a “circular” lung (not shown), whereas slightly less truncation creates a “third lung,” as shown in Figures 1D and 1F. In our study, however, only medium-size artifacts, such as those often seen in clinical studies, were modeled. Truncation was created by shifting the MCAT phantom by 5 cm relative to the maximum of the profile photon beam in the ATS simulator.
The second type of map truncation is the result of incomplete rotation of an asymmetric fanbeam transmission photon beam, such as is produced by the Beacon system (Philips, previously Marconi). In principle, for this type of transmission system (asymmetric fanbeam or cone-beam), a full set of projections, as acquired over a 360° camera rotation, is needed to reconstruct an artifact-free attenuation map. However, to save time, the current clinical protocol recommends less than a full rotation. This results in incomplete data and in maps truncated in the area corresponding to the back of the patient (Figs. 1A and 1B). This effect was modeled by creating an area with very low attenuation (μ = 0.01 cm−1) at the posterior section of the thorax in the normal attenuation map.
For both types of truncation, all 3 MCAT phantoms were tested (normal heart, defects in the inferior wall and septal wall) with the transmission photon flux equal to 500 and 2,000 counts/pixel. Each of these combinations had maps reconstructed with FBP and OSTG, resulting in 12 studies for each truncation type.
Map Segmentation.
In situations in which maps are of poor quality the use of map segmentation has been suggested (26). The segmentation process uses the measured patient map to find the external boundaries of the body and the internal boundary between the lung and the soft tissue. The segmentation procedure often employs a simple 50% threshold of the maximum μ value in the map. Then a water attenuation coefficient of 0.12 cm−1 is assigned to all areas of the body except the lung region, which is usually given the value of zero. Finally, a smoothing filter is applied to the segmented map to avoid artifacts that would be created by sharp boundaries.
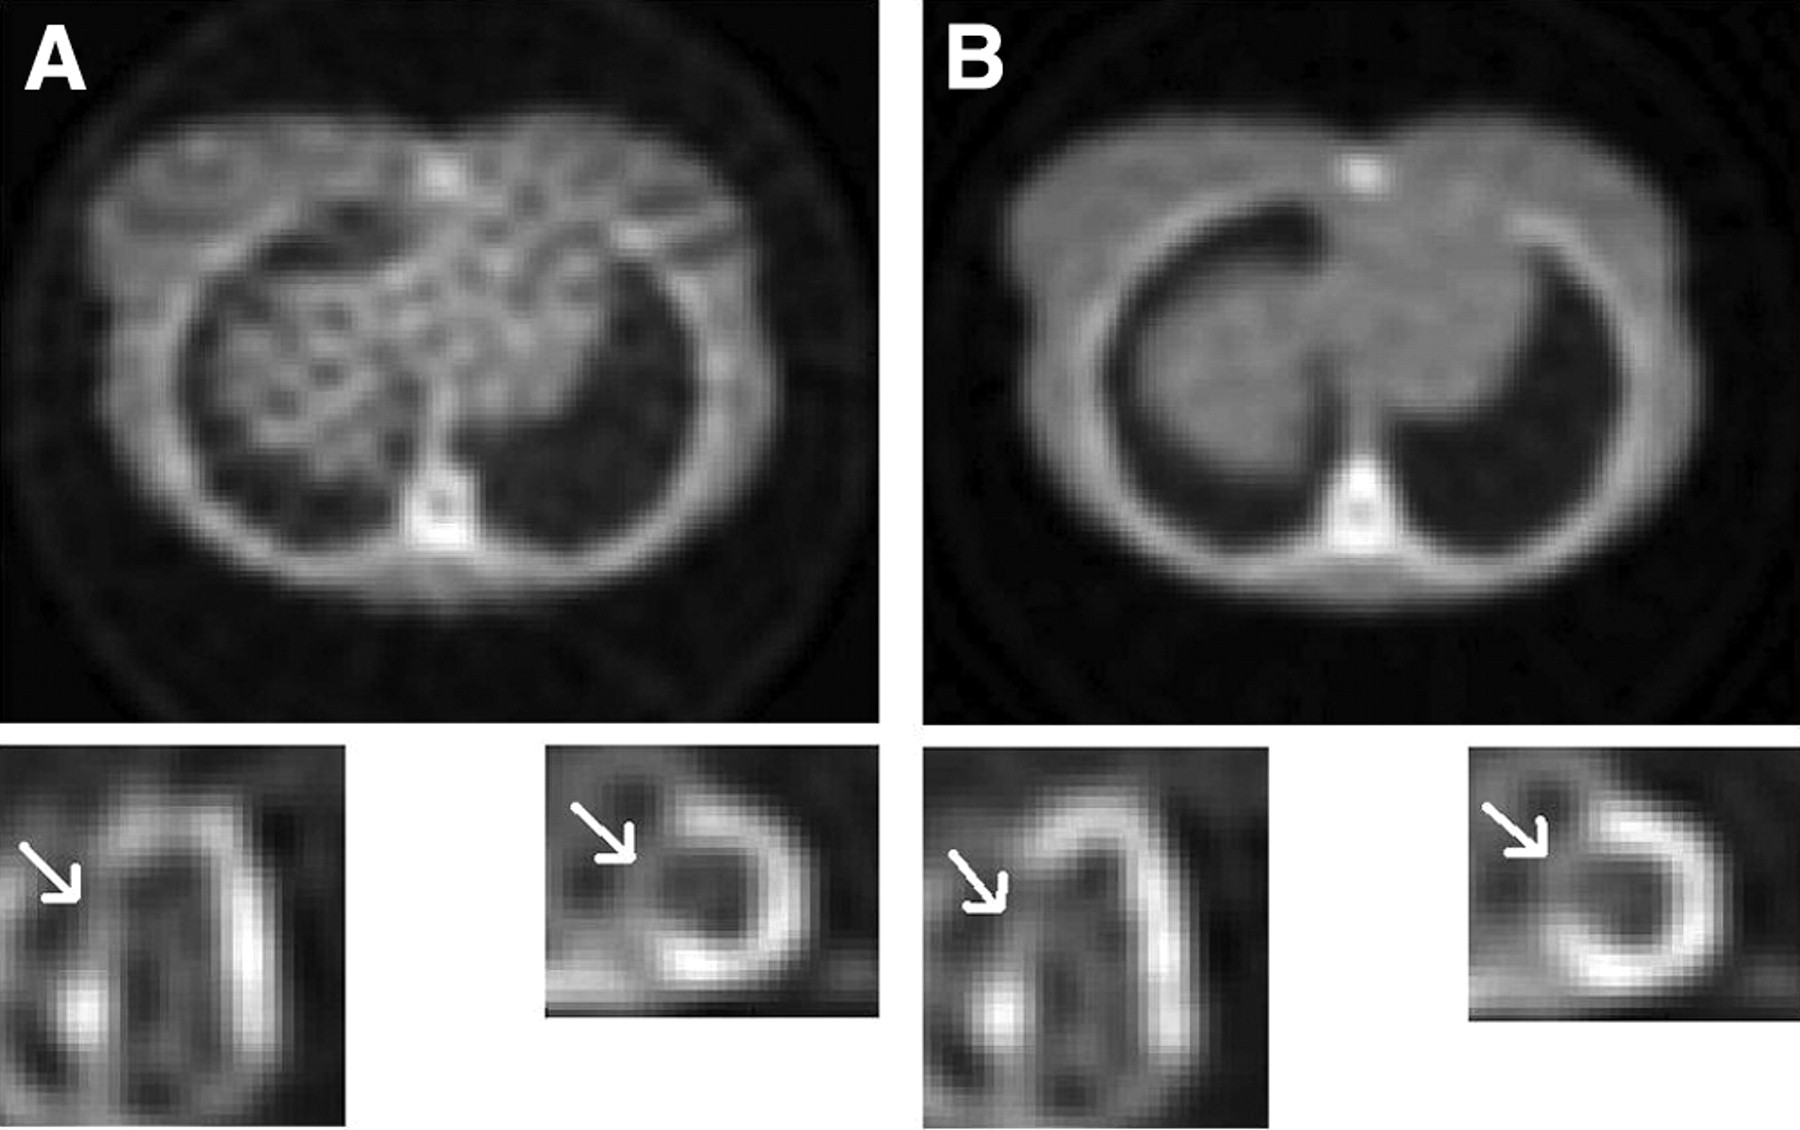
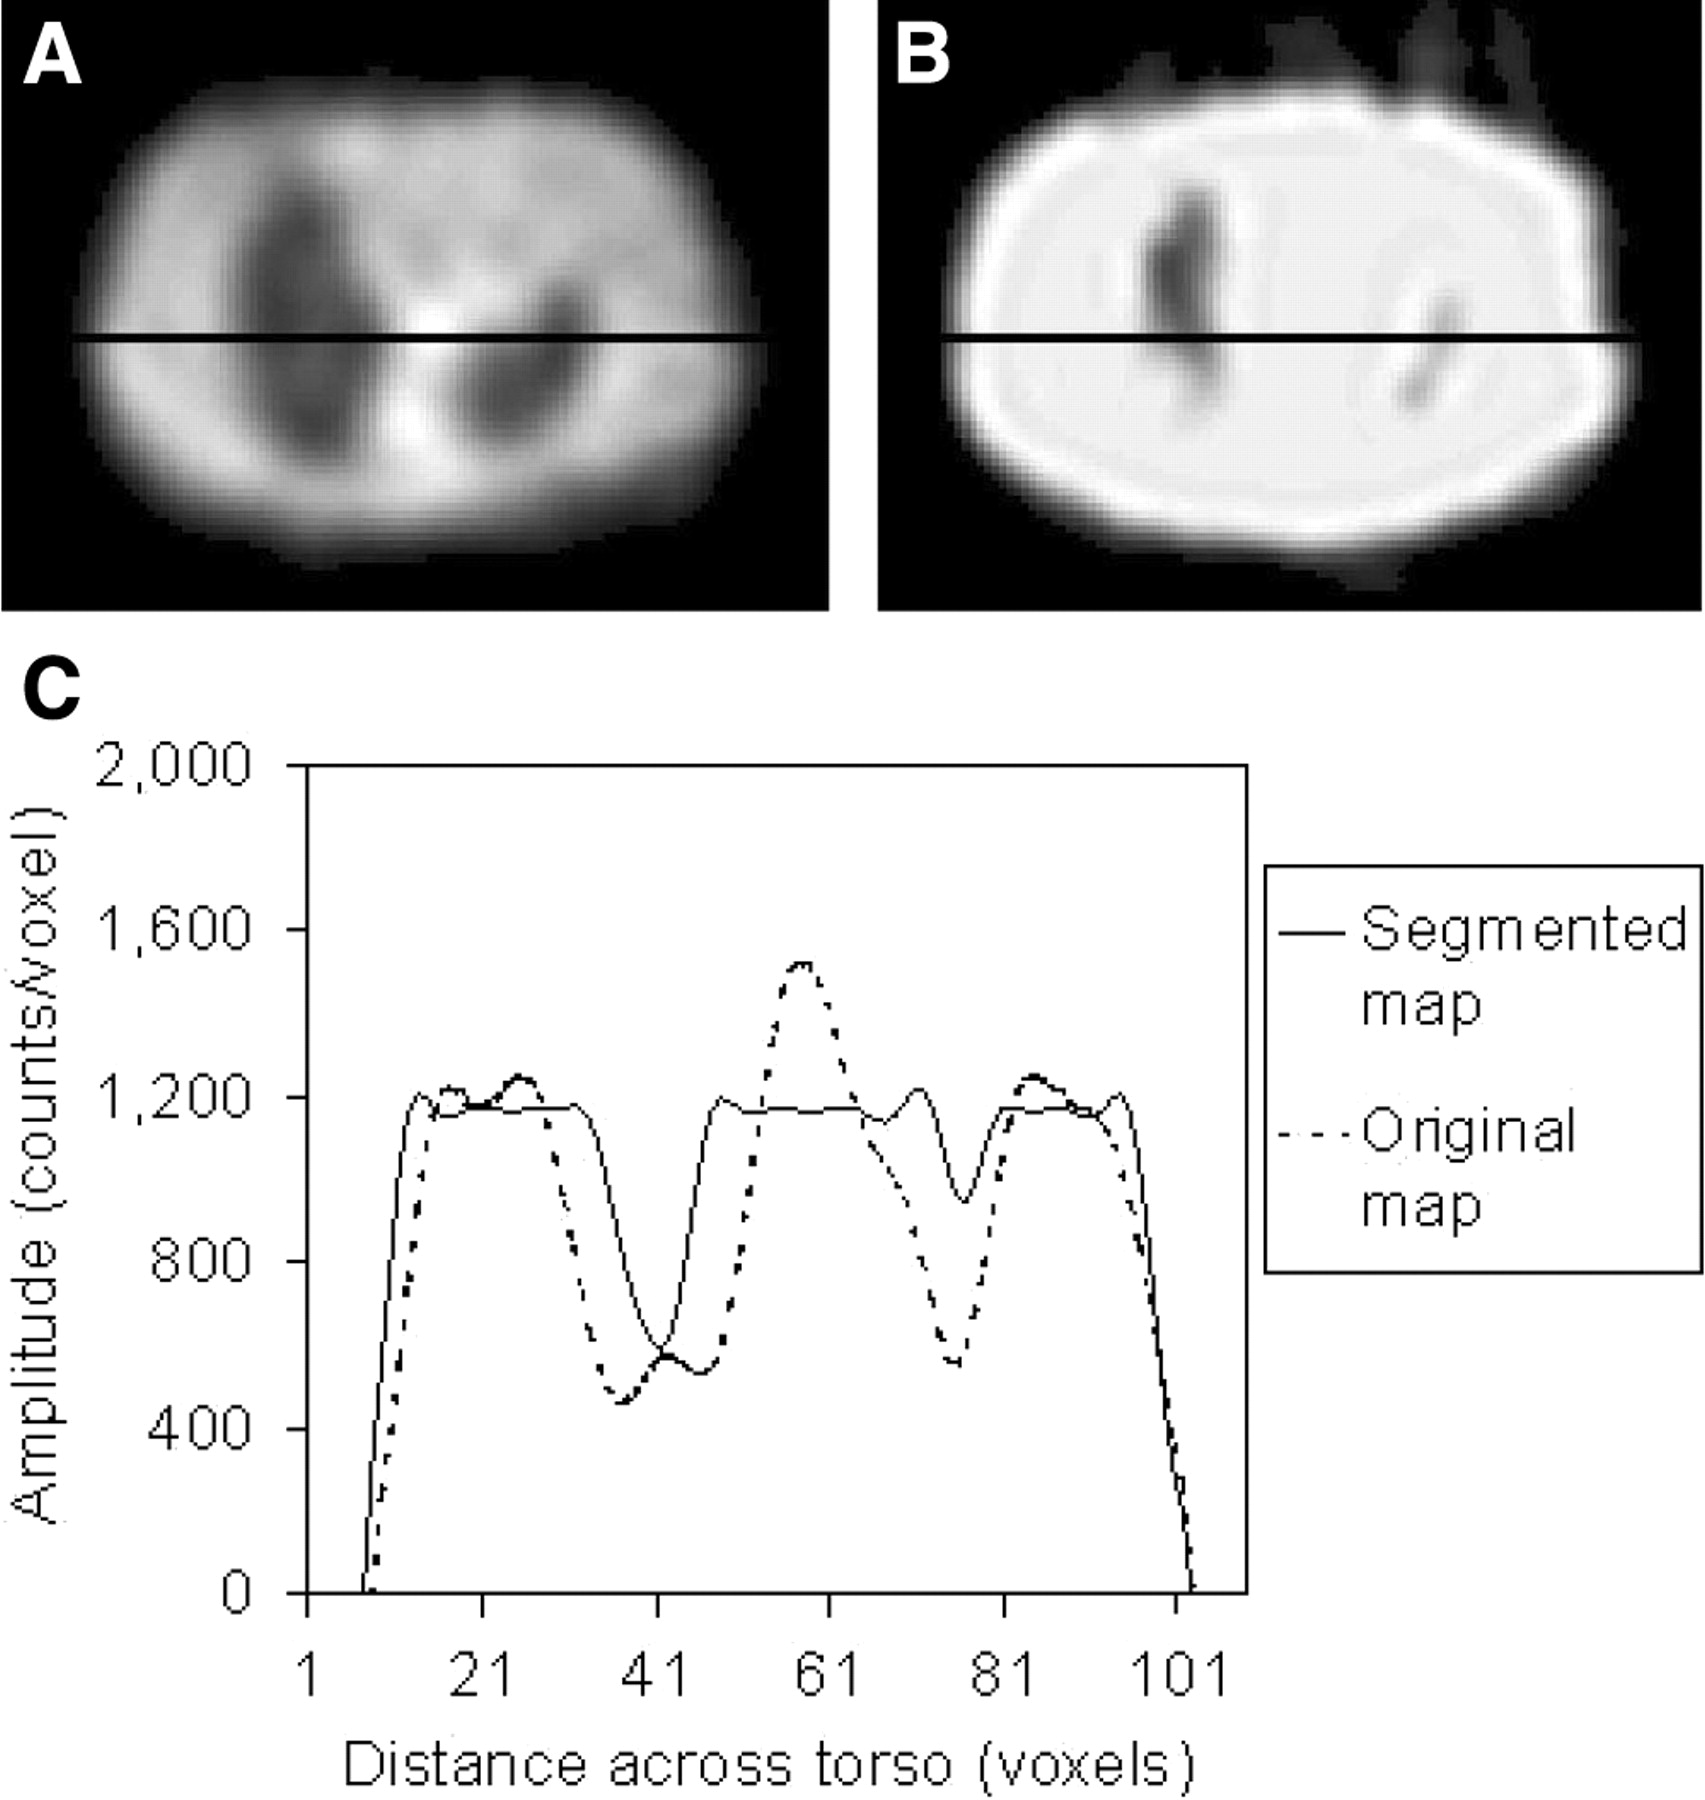
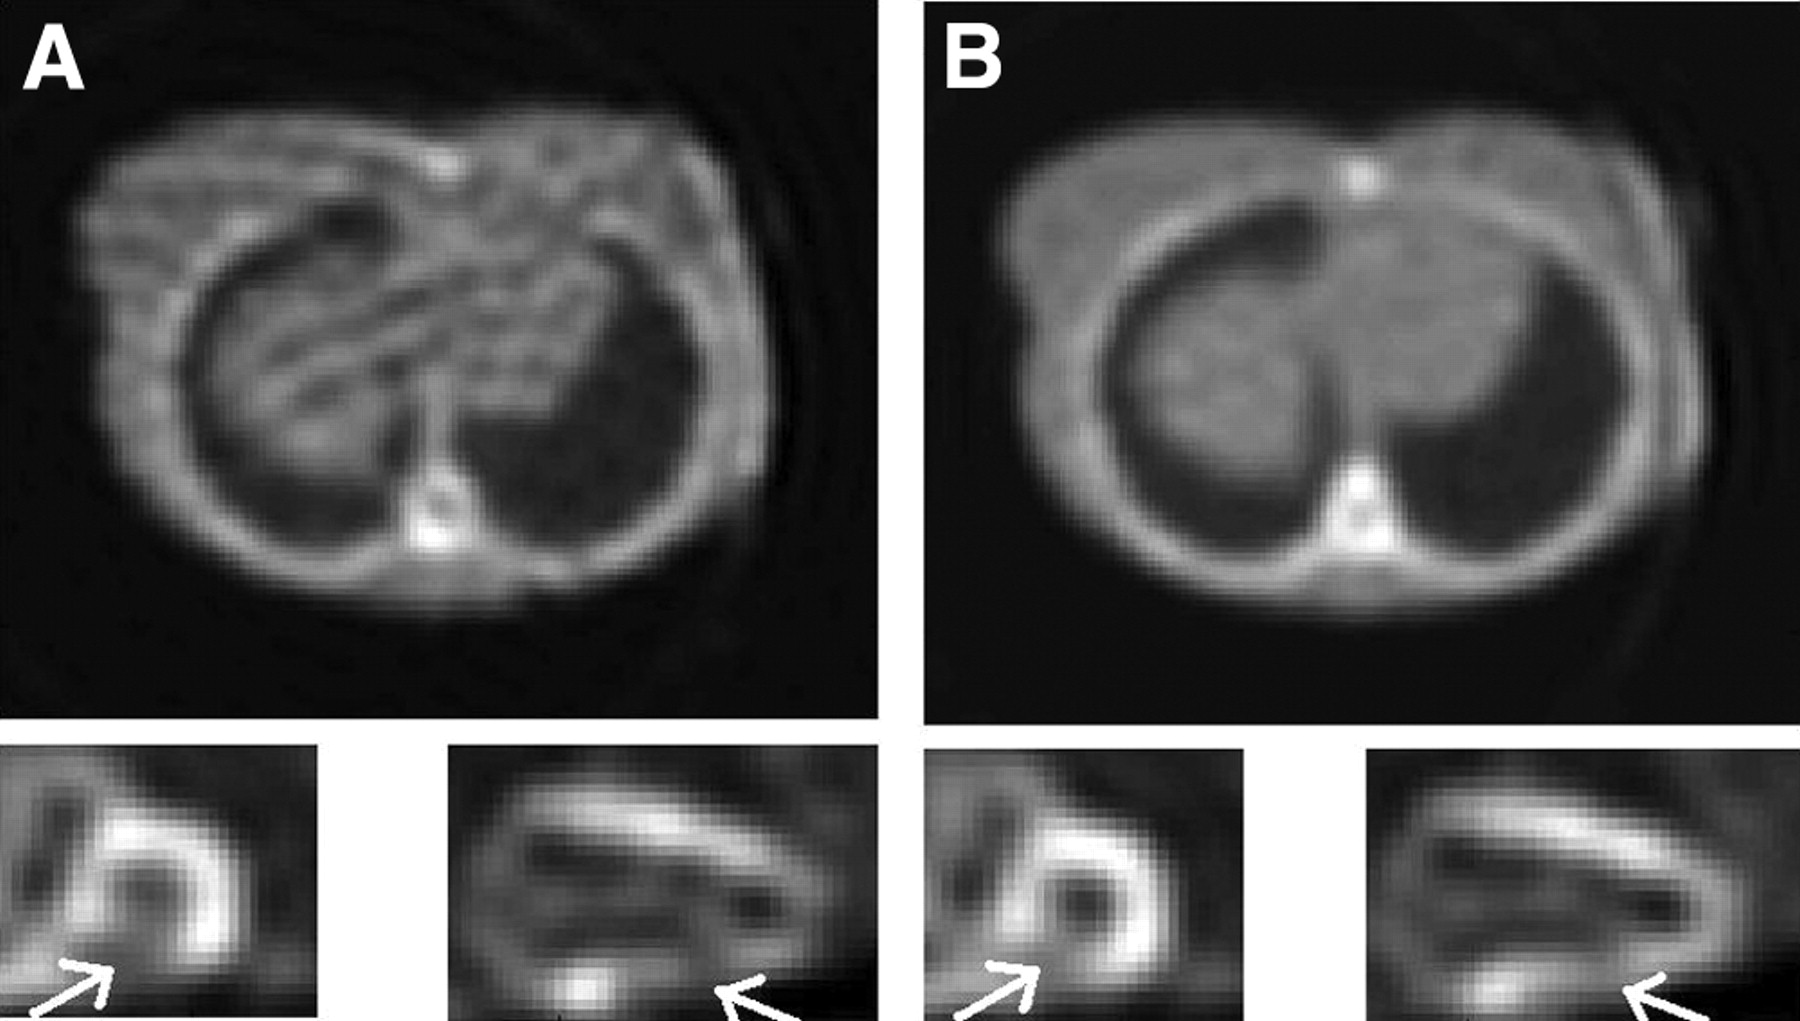
This procedure often yields better results than the original map. However, because transmission projections that contain several bins with very low or missing counts produce falsely high attenuation values, segmented areas corresponding to the lungs may appear much smaller than their true extent. A clinical example of such a situation is presented in Figure 2. The profiles drawn through the center of the true and segmented maps show substantial mismatch of boundaries. A more sophisticated segmentation algorithm would be better in this case; nevertheless, in our study, the maps were segmented at a 50% threshold to study the effects of the simple segmentation procedure that is currently being used in our department.

Example of poor-quality patient attenuation map (A) and same map after segmentation (B). Profiles drawn through center of each map show effect of considerable mismatch in determination of lung boundaries (C).
The tests were performed on a sample of the 2 cases yielding poor-quality attenuation maps. They corresponded to the following situations: (a) septal defect, profile transmission system, 500 counts/pixel, and FBP μ map reconstruction, and (b) inferior defect, profile transmission system, 500 counts/pixel, and OSTG attenuation map reconstruction, truncated map.
In each case, the maps were segmented and then smoothed with the Butterworth filter (order 5, cutoff 0.3) before being applied in the attenuation correction procedure. It is important to note that these poor-quality maps were created with 500 counts/pixel, which corresponds to the clinical situation with a “new” transmission source. Much stronger effects would be seen if an “old” source, emitting only 200 counts/pixel, were used. The resulting emission images were visually compared with those obtained with original (unsegmented) maps, and the change in the defect size was calculated.
Data Analysis
Analysis of the attenuation maps and final emission images for simulated data included visual checks for artifacts and checks of myocardial uniformity. In addition, quantitative analysis of the accuracy of reconstructed attenuation maps was performed by calculating individual relative standard deviation (RSD) for each tissue region K, using the following formula:
 Eq. 3
Eq. 3
The summation is performed over all pixels i in the region K containing a given type of tissue (muscle, lung, or bone), μi is the reconstructed attenuation coefficient in pixel i, μi,K is its true value, μ̄K is the mean attenuation coefficient for region K, and NK is the number of pixels in that region. Using a mean value, μ̄K takes into account the partial-volume effect occurring at the boundaries of the regions.
A total RSD σT is defined as the sum of the individual RSDs σK weighted by the number of pixels in each region:
 Eq. 4
Eq. 4
The emission images reconstructed using correct attenuation maps and using maps with artifacts were compared. The visibility of perfusion defects and quantitative evaluation of their sizes were done using our iQuant program. The iQuant method uses a 3D determination of the viable myocardium as defined by a fixed threshold of 79% of the maximum myocardium counts calculated as an average of 30 voxels. This threshold was determined as that required to give the correct size of the healthy myocardium phantom. The shape of the viable myocardium together with a lower threshold enabled the operator to measure the size of perfusion defects (27). We have recently established that iQuant has an accuracy corresponding to an average absolute error of 0.41 ± 0.44 mL (or relative error of 2.0% ± 2.1%) for a 21.0-mL myocardial infarct.
In addition, the statistical paired-sample t test of the results was performed, and P < 0.05 was considered to be significant. In patient studies the truth is not known; therefore, patient images were used in the analysis only to illustrate the effects of different problems.
RESULTS
Missing Count Problem and Map Reconstruction
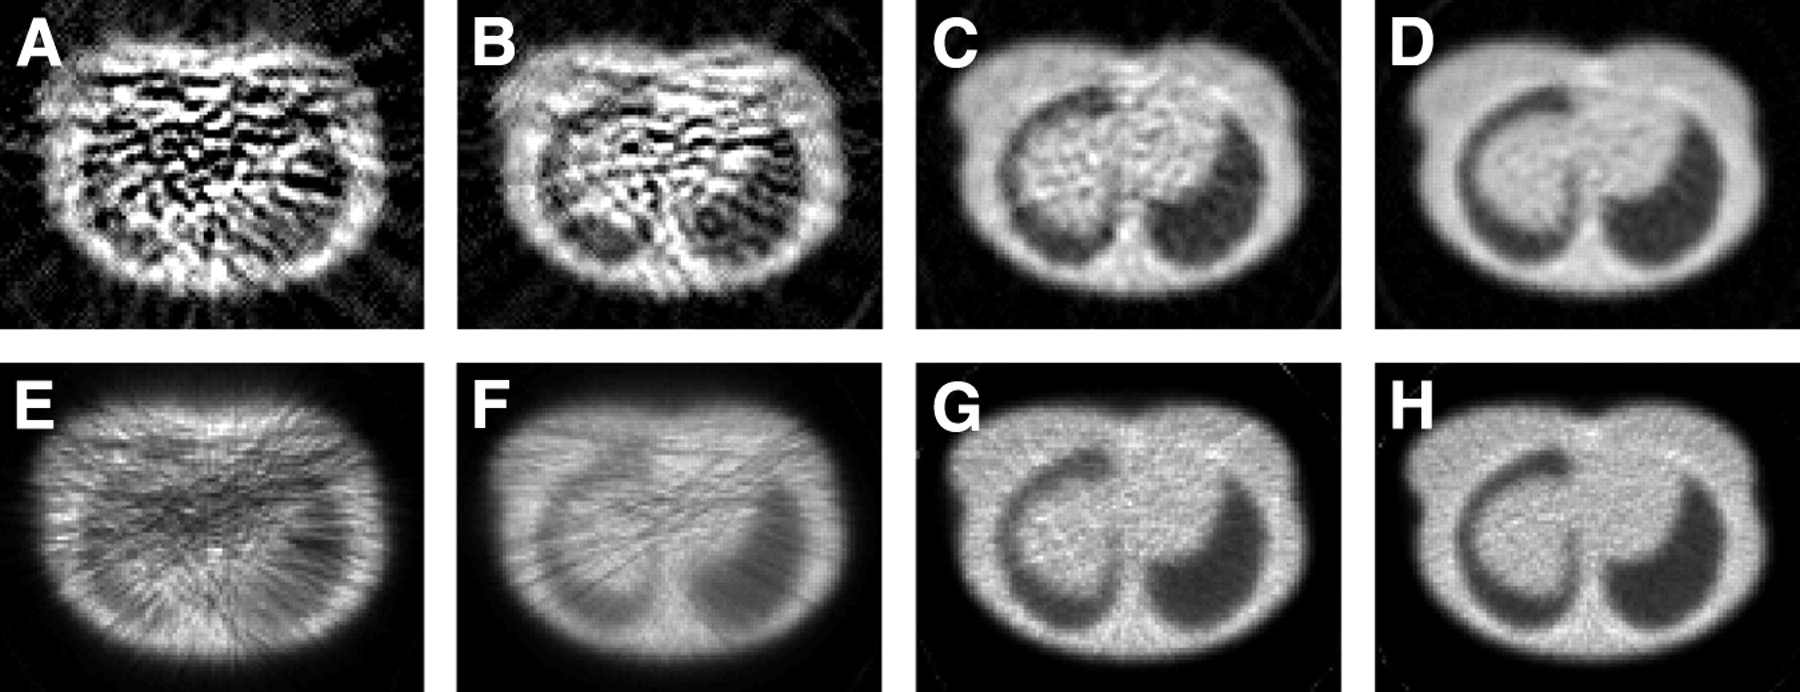
Attenuation maps reconstructed from the transmission data corresponding to profile blank scans with 200–10,000 counts/pixel per 20 s projection are shown in Figure 3. The maps were reconstructed with FBP and OSTG with a Butterworth filter (order 5, cutoff 0.7). Maps resulting from the uniform transmission system were very similar to these and are not shown. Attenuation maps reconstructed from insufficient counts (Figs. 3A and 3E) show strong artifacts for both reconstruction methods, although OSTG performed better. The uniformity of the map improved with higher photon flux, which was further illustrated by the calculated RSD values. Although the values of σK for muscle are at the level of 0.4 with OSTG and 0.6 with FBP for maps created with 200 counts/pixel, they decrease by a factor of almost 2 for 500 counts/pixel and another factor of 2 for 2,000 counts/pixel scans.

Attenuation maps reconstructed using FBP (top row) and OSTG (bottom row) from transmission data with 200 counts (A and E), 500 counts (B and F), 2,000 counts (C and G), and 10,000 counts (D and H) per pixel in blank scan.
The statistical analysis of σT and σK for tissue, lung, and bone regions for the four strengths of the transmission photon flux and for both methods of map reconstruction showed no significant differences between the profile and uniform systems. A significant difference was found in RSD values between FBP and OSTG in all regions of the maps for a photon flux of 200 counts/pixel. For all other count levels, the region corresponding to muscle and soft tissue showed significantly lower σK when reconstructed with FBP than with OSTG. Although the same effect was not seen for regions corresponding to lungs and bone, the muscle and soft tissue made up the majority of the map and were mainly responsible for the extent of attenuation correction. In addition, there was a significant difference in map quality between every count level for both methods of map reconstruction.
The results of the measurement of infarct size in the attenuation-corrected emission images for profile system are summarized in Table 1. Figures 4A and 4B present examples of images of the septal defect and were obtained with FBP-reconstructed maps from data created with the profile system. The left and the right parts of the figures show attenuation maps and corresponding heart images obtained from 500 and 2,000 counts/pixel scans, respectively. Our experiments showed that important variations in the infarct size for true septal and inferior myocardial wall defects may be caused by insufficient counts in the transmission scan. The largest increase in the defect size was seen in maps reconstructed using FBP. There was no difference between the results obtained with the profile and uniform transmission systems, providing the same maximum counts/pixel were used.
Attenuation maps and corresponding emission images of myocardial perfusion study showing increased sizes of true septal defect (A has larger defect than B) caused by insufficient counts in maps. Maps were reconstructed using FBP from 500 counts/pixel (A) and 2,000 counts/pixel (B) from transmission data obtained with profile system.
Effect of Map Reconstruction Technique and Photon Flux Intensity on Myocardial Defect Size in Attenuation-Corrected Emission Image for Profile Transmission System
Cross-Talk Problem and Corrections
Inadequate correction for cross-talk effect created problems in the attenuation maps similar to those caused by low counts acquisitions, especially when the simple subtraction method was used. Figure 5 presents examples of attenuation maps obtained from the data created with the profile system with 500 and 2,000 count/pixel scans. These maps were reconstructed using FBP with no cross-talk correction (Figs. 5A and 5E), using FBP (Figs. 5B and 5F) and OSTG (Figs. 5C and 5G) with simple subtraction of the scatter data acquired in the cross-talk windows, and reconstructed with the OSTG-S iterative algorithm (Figs. 5D and 5H).

Attenuation maps reconstructed using 500 counts/pixel (top row) and 2,000 counts/pixel (bottom row) transmission data with no correction (A and E), cross-talk subtraction and FBP reconstruction (B and F), cross-talk subtraction and OSTG reconstruction (C and G), and OSTG-S reconstruction with cross-talk incorporated in iterations (D and H).
Maps with no cross-talk correction appeared to be smoother than those obtained with the cross-talk subtraction method. The reason is that subtracting cross-talk contribution from each bin of the transmission projection substantially increased the statistical noise in the data. Obviously, the noise amplification effect was the strongest for the 500 counts/pixel study and FBP reconstruction. When comparing OSTG reconstruction with FBP, improvement in map accuracy was more dramatic for 500 counts/pixel source intensity than for 2,000 counts/pixel. Further improvement was achieved when a scatter estimate was incorporated into the OSTG-S iterative process. In general, the RSD for each region decreased by about 50% for FBP and 30% for OSTG when the photon flux intensity increased from 500 to 2,000 counts/pixel. The difference was the smallest for OSTG-S and amounts to about 20%.
Statistical analysis was performed for the profile system with 500 and 2,000 counts/pixel, to compare σT and σK values for different methods of map reconstruction. For every method of reconstruction and for each region, there was a significant difference seen in RSD values between 500 and 2,000 counts/pixel. At the photon flux of 500 counts/pixel level a significant difference was seen between FBP and the OSTG and between FBP and OSTGS reconstructions. At the 2,000 counts/pixel level a significant difference was seen between FBP and OSTGS but not between FBP and OSTG. At both levels of photon flux no significant difference was found between OSTG and OSTGS.
Truncation Effects
Visual and quantitative analysis of emission scans reconstructed with maps that have been truncated show false defects within the myocardium and interference from activity in other locations. In all of the studied cases, normal (not truncated) attenuation maps reconstructed using OSTG and FBP provided emission scans with no detectable false defects and no interference from other activity. However, in cases when truncated maps were used, false defects appeared in the myocardium.
For the profile transmission source configuration, truncation occured at one side of the attenuation map when the patient was mispositioned relative to the source distribution (Fig. 1D). All truncated maps produced false inferior or lateral defects in the emission images. Six of 12 maps produced false inferior defects, and 7 of 12 produced false lateral defects (in a single case both effects were seen). The true defects were increased in size, as can be seen in Figure 6. We found no correlation between the type of reconstruction method and the intensity of the photon flux and the creation of the false defects in the myocardium. In addition, 3 of 12 maps produced emission images that showed an increase in the activity of the right ventricle, which was not seen in images reconstructed with untruncated maps.

Attenuation maps and corresponding emission images of myocardial perfusion study for truncated attenuation map (visible on right side of maps). Data created with profile transmission system and 500 counts/pixel (A) and 2,000 counts/pixel (B). Inferior defect is closer to its true size in image B.
The Beacon transmission system often produced a posterior truncation artifact (Fig. 1A and 1B). All truncated attenuation maps reconstructed using OSTG and FBP produced false lateral defects in the emission images (Fig. 7). In addition, 6 of 12 images showed an increase in activity of the liver and a decrease in separation between liver and heart, resulting in interference from the liver to the myocardium. Again, there was no correlation with the type of reconstruction method or the intensity of the photon flux.

Attenuation maps and corresponding emission images of myocardial perfusion study for normal attenuation map (A) and truncated map (B) as may be created using incomplete rotation of Beacon system. Heart image in B shows excessive size of true inferior and false lateral defects. Data created with 2,000 counts/pixel and uniform transmission systems.
The true defects, which were placed in the septal and inferior walls of the heart in the emission data, all had their sizes altered as a result of map truncation for both types of truncation studied. Table 2 demonstrates the variation of the defect size resulting from map truncation calculated for both types of truncation and both intensities of transmission photon flux.
Effect of Truncation of Attenuation Map (OSTG Reconstruction) and Photon Flux Intensity on Myocardial Defect Size in Attenuation-Corrected Emission Image
Map Segmentation
Our results indicate that the size of a real defect is largely improved when a poor-quality attenuation map is segmented (Table 3). It should be noted that visual analysis of emission images reconstructed with these poor-quality attenuation maps showed numerous false defects within the myocardium, whereas images reconstructed with the segmented attenuation maps showed only 1 small false defect in the basal section of the lateral wall. Because the maps reconstructed with OSTG are in general of better quality than those obtained with FBP, there is less advantage in using segmentation in this case.
Effect of Map Segmentation on Myocardial Defect Size
DISCUSSION
We have found that small nonuniformities and artifacts in attenuation maps have only limited impact on the accuracy of the corrected emission images. This may be explained by the “averaging” effect on the final image, caused by the process of combining attenuation contributions along the projection ray during reconstruction. Such small map artifacts may be caused, for example, by nonuniformities of the blank scan as acquired for different angular camera positions, mismatch between blank and transmission projections, or by a small number of pixels with missing counts in the transmission data. However, when missing or low counts extend over several pixels in the transmission projections, maps reconstructed from such data may have large areas with artificially high attenuation. This, in turn, can create areas with increased activity or even false hot-spots in the reconstructed emission images. These may hide or alter the appearance of perfusion defects or give rise to apparent false defects.
The use of the iterative reconstruction OSTG method was found to produce maps substantially better than those created by the FBP technique. An additional advantage of this approach is that cross-talk correction can be included in the iterative process. Quantitative analysis of map reconstruction with iterative cross-talk correction showed that the overall accuracy of attenuation maps (total relative SD) improved by a factor of 2 when the OSTGS method incorporating correction into iterations was used rather than FBP and subtraction. Map segmentation can improve the situation when low count maps are acquired, but a segmented map should be used only with caution, because this procedure may substantially alter the position of boundaries between regions with different attenuation.
Because low transmission counts can cause serious problems, we recommend using transmission systems only when the activity of the source is sufficient. A test should be used to verify that there are no pixels or there are, at most, only a few pixels in the transmission projections with zero content. Because this will depend on the size and density of the attenuating object, such a test should be included in the software, checking the data for every single patient and, where appropriate, displaying a warning message for the user.
To prevent low counts, the activity of the transmission source could be increased. Such an increase will not have any important implication for the patient dose. The typical patient dose associated with a transmission scan is estimated to be at a level of 8 × 10⁻⁵ mSv for a 30 min scan with the current activity of the Profile transmission system. This corresponds to approximately 1/40,000 of the patient dose from a sestamibi injection for a standard cardiac study. Therefore, even a 20-fold increase in the transmission source activity would not contribute substantially to the patient dose. Factors that may prevent manufacturers from using stronger sources are probably associated with the higher price of such a system and possible problems with handling and shielding of higher activities.
In this respect, our comparison of the profile and uniform systems showed the advantage of the former. In general, maps created by both systems were almost identical, but, because of different shapes of photon beams, the total number of photons used by the profile system amounted to only 66% of the photons used by uniform, which translated into lower activity of the profile source being needed to produce attenuation maps of a given quality.
CONCLUSION
In this study we have shown various type of errors, analyzed their causes, and suggested ways they could be avoided. The most important problem, resulting in inaccurate attenuation correction, is count deficiency in transmission data. Comparison of emission images reconstructed using low- and high-count maps showed differences that might lead to serious diagnostic errors. Similarly, incorrect images could be created by inadequate cross-talk removal, because, in this case, maps contained areas with attenuation coefficients lower than their true values and emission images reconstructed with such maps had only part of the attenuation effect compensated. Truncation of transmission data should be avoided, because maps reconstructed from such data do not represent true density distributions and using them may substantially alter the distribution of activity in the emission images.
Situations will vary, depending on the scope of the artifact and the sizes of the attenuation map and the activity distribution map. Because patients are dissimilar, with different shapes and sizes of body and internal organs, resulting artifacts may differ from person to person. However, irrespective of all these factors, maps must be correct to produce a correct attenuation compensation procedure. It is most important that the attenuation maps always be viewed and checked for artifacts before attenuation-corrected images are fully trusted in the diagnostic process.
Acknowledgments
We acknowledge the support we have received from the Natural Sciences and Engineering Research Council of Canada.
Footnotes
Received Jan. 29, 2004; revision accepted Sep. 27, 2004.
For correspondence contact: Anna Celler, PhD, Division of Nuclear Medicine, Vancouver Hospital and Health Sciences Centre, 899 W. 12th Ave., Vancouver, British Columbia, Canada.
E-mail: aceller{at}physics.ubc.ca


