


Abstract
18F-FDG uptake in malignant tumors largely depends on the presence of facilitated glucose transporters, especially type 1 (Glut 1) and a rate-limiting glycolytic enzyme, hexokinase (HK) type II. Low expression of Glut 1 was reported in hepatocellular carcinoma (HCC), whereas high expression was found in cholangiocarcinoma. Immunohistochemistry and proteome analysis were performed to obtain a detailed evaluation of the mechanisms involved in glucose uptake and use in these tumors. Methods: Tumor tissues obtained from both HCC (n = 7) and mass-forming cholangiocarcinoma patients (n = 7) who showed increased 18F-FDG uptake on PET were used. Immunohistochemistry for Glut 1 and HK I–III was performed in all tumor tissues. To identify proteins that regulate carbohydrate metabolism, a proteome analysis with matrix-assisted laser desorption ionization–time of flight and enzymatic digestion in-gel were performed using 8 available tumor samples and 3 normal liver tissues. Of the 8 tumor samples, 4 were HCCs; one was an intermediate phenotype HCC, and 3 were cholangiocarcinomas. The spot intensity of the proteins was calculated using proteome data; the tissues then were divided into 2 groups on the basis of the protein expression pattern, because the protein expression pattern of the intermediate-phenotype HCC was close to that of the cholangiocarcinomas. Group A included the HCCs and group B included the intermediate-phenotype HCC as well as the cholangiocarcinomas. Results: Immunoreactivity for Glut 1 was positive in all cholangiocarcinomas, but was negative in all HCCs except the one intermediate phenotype. However, HK II was positive in HCCs but was negative in 6 of the 7 cholangiocarcinomas. A total of 331 protein spots with a P value of <0.05 were identified by proteome analysis. Thirteen of these proteins that regulate carbohydrate metabolism were selected. The pentose phosphate pathway was increased in both groups, but more significantly in group B. Gluconeogenesis enzymes were decreased in both groups, but the tricarboxylic acid cycle–regulating enzyme expression was variable. Conclusion: HCCs have different glucose-regulating mechanisms from those of cholangiocarcinomas, even though both tumors showed increased 18F-FDG uptake on PET scans. Further studies are required with regard to energy metabolism and 18F-FDG uptake patterns in association with various oncogenic alterations regulating multiple steps of the glycolytic pathways.
In past years, 18F-FDG PET has been widely used clinically in the field of oncology because of its high sensitivity and specificity, and it also has significant potential for assessing therapy response (1). Because cancer cell growth is heavily dependent on glucose metabolism as a major energy substrate, the 18F-FDG uptake pattern on PET scans that reflects glycolytic activity could be an indicator of the prognosis and aggressiveness of the tumors. In addition, the association of neoplastic growth with increased aerobic glycolysis has been known as the Warburg effect for more than 7 decades (2). However, 18F-FDG uptake patterns in primary hepatic tumors are variable. Increased uptake can be seen in only half of hepatocellular carcinoma (HCC) patients (3); mass-forming intrahepatic cholangiocarcinomas show intense 18F-FDG uptake, whereas hilar cholangiocarcinomas show only mild uptake (4).
In our previous study, the 18F-FDG uptake was closely correlated with the pathologic grading in HCC. HCCs with increased 18F-FDG uptake showed molecular features of more aggressive biologic properties than those with a low 18F-FDG uptake (5). However, the glucose uptake pattern and its clinical implications have not been evaluated in cholangiocarcinomas.
18F-FDG uptake in malignant tumors depends largely on the presence of facilitated glucose transporters, including type 1 (Glut 1) and a rate-limiting glycolytic enzyme, hexokinase (HK) type II (6). In previous reports, it was demonstrated that Glut 1 is highly expressed in cholangiocarcinomas but rarely expressed in HCCs (7, 8). In contrast, HK II expression is increased in HCCs (9) but unknown in cholangiocarcinomas. These findings suggest that glucose uptake and glycolytic mechanisms could differ between HCCs and cholangiocarcinomas, even though both tumors use glucose as a major energy source. To explore the differences of mechanisms involving glucose uptake and glycolysis in these tumors, immunohistochemistries for Glut 1 and HK I–III were performed as well as proteome analysis of the enzymes regulating the glucose metabolism using the tumor tissues obtained from HCC and mass-forming cholangiocarcinoma patients showing increased 18F-FDG uptake on PET scans.
MATERIALS AND METHODS
Tissue Specimens
Tumor tissue specimens from 14 patients (7 HCCs and 7 cholangiocarcinomas) who had undergone partial hepatectomy were obtained and stored in a deep freezer (−70°C) for proteomic analysis or embedded in paraffin for hematoxylin–eosin staining and immunohistochemistry. The age of the patients ranged from 40 to 73 y. All tumor tissues demonstrated increased 18F-FDG uptake on a PET scan (standardized uptake values [SUVs] of 18F-FDG ranged from 3.2 to 17.4). Approval was obtained from the Ethical Committee in our institute for this study.
PET Procedure
Before surgery, all patients were examined with a whole-body PET camera (Advance; GE Healthcare). Before scanning, patients fasted for at least 6 h, and their plasma glucose concentrations were measured. The blood glucose level was <140 mg/dL. Approximately 370 MBq 18F-FDG were injected intravenously, and the emission scan (5 min/bed) was started from the neck to the knee in 2-dimensional (2D) mode 50–60 min after the injection. Patients then underwent a transmission scan (3 min/bed) with rotating 68Ge sources. The images were reconstructed with the attenuation-corrected ordered-subset expectation maximization algorithm (number of subsets, 16; number of iterations, 2). The PET scans were compared with the corresponding CT or MR images for an accurate localization of the tumors. The coronal, sagittal, and axial images of the patients were qualitatively evaluated to determine whether the 18F-FDG uptake in the tumor was higher than that in the surrounding noncancerous hepatic tissue. For a semiquantitative evaluation, a small region of interest (8 pixels) was placed over the area of maximum 18F-FDG uptake in the tumors and the maximum SUV (SUVmax) normalized to body weight was calculated.
Immunohistochemistry
Hematoxylin–eosin staining of 5-μm-thick paraffin sections was performed and sections were then deparaffinized and rehydrated for immunohistochemistry. After wax removal and dehydration, sections were pretreated in a 0.01 mol/L citrate buffer (pH 6.0) using a microwave oven (820 W, 15 min) for antigen retrieval. They were then incubated with primary antibodies at 4°C overnight. These primary antibodies were polyclonal human anti-Glut 1, rat antihexokinase type II, monoclonal anti-HK type I and type III (Chemicon International Inc.), and monoclonal anticytokeratin (CK)-19 (Dako). The antibodies were diluted to 1:1,000, 1:5,000, 1:100, 1:200, and 1:50, respectively. Endogenous peroxidase activity was blocked by incubation in H2O2 for 10 min. After washing, signals were detected using an EnVision Kit (Dako) and diaminobenzidine. The presence of membrane-bound Glut 1 and intracytoplasmic HK I–III was examined for all tumor tissues, and CK-19 was evaluated in HCCs for further classification of HCCs into a primary HCC and an intermediate (hepatocyte-cholangiocyte) phenotype (10). Sections incubated with preimmune serum served as negative controls. Red blood cells present in the tissues and rat skeletal muscle served as positive controls for Glut 1 and hexokinases, respectively.
Proteome Analysis
An adequate amount of protein was obtained from 8 tumor specimens (5 HCCs and 3 cholangiocarcinomas) and 3 adjacent normal tissues. Proteome analysis was undertaken using these samples.
Reagents.
Urea, thiourea, 3-([3-cholamidopropy]dimethyammonio)-1-propanesulfonate (CHAPS), dithiothreitol (DTT), benzamidine, Bradford solution, acrylamide, iodoacetamide, bisacrylamide, sodium dodecylsulfate (SDS), acetonitrile, trifluoroacetic acid, and α-cyano-4-hydroxycinnamic acid were purchased from Sigma-Aldrich. Pharmalyte (pH 3.5–10) was from Amersham Biosciences and immobilized pH gradient (IPG) DryStrips (pH 4–10; nonlinear, 24 cm) were from Genomine Inc. Modified porcine trypsin (sequencing grade) was from Promega.
Protein Sample Preparation.
Tissue samples were washed twice in ice-cold phosphate-buffered saline, blotted to dry, and directly homogenated using a motor-driven homogenizer (Fisher Scientific) with a sample buffer containing 7 mol/L urea, 2 mol/L thiourea (containing 4% [w/v] CHAPS, 1% [w/v] DTT, and 2% [v/v] pharmalyte), and 1 mmol/L benzamidine. Proteins were extracted for 1 h at room temperature. After being centrifuged at 15,000g for 1 h at 15°C, the insoluble material was discarded and the soluble fraction was used for a 2D gel electrophoresis. In addition, a membrane fraction was obtained after centrifuging the sample at 1,400g. Protein loading was normalized using a Bradford Assay (11).
2D Polyacrylamide Gel Electrophoresis (PAGE).
IPG dry strips were equilibrated for 12–16 h with sample buffer containing 7 mol/L urea and 2 mol/L thiourea (containing 2% CHAPS, 1% DTT, and 1% pharmalyte) and loaded with 200 μg of sample. Isoelectric focusing (IEF) was performed at 20°C using a Multiphor II electrophoresis unit and an EPS 3500 XL power supply (Amersham Biosciences) following the manufacturer’s instructions. For IEF, the voltage was increased linearly from 150 to 3,500 V for 3 h to allow for sample entry. This was followed by a constant 3,500 V, with focusing complete after 96 kVh. Before the second dimension, strips were incubated for 10 min in an equilibration buffer (50 mmol/L Tris-Cl, pH 6.8, containing 6 mol/L urea, 2% SDS, and 30% glycerol), first with 1% DTT and then with 2.5% iodoacetamide. The equilibrated strips were inserted into SDS–PAGE gels (20–24 cm, 10%–16%). SDS–PAGE was performed using the Hoefer DALT 2D system (Amersham Biosciences) following the manufacturer’s instructions. Two-dimensional gels were run at 20°C for 1.7 kVh and then silver stained as described by Oakley et al. (12).
Image Analysis.
A quantitative analysis of digitized images was performed using PDQuest software, version 7.0 (BioRad). The quantity of each spot was normalized by total valid spot intensity.
Enzymatic Digestion of Protein In-Gel.
Protein spots were digested in-gel using modified porcine trypsin in a manner similar to that previously described by Shevchenko et al. (13). The gel pieces were washed with 50% acetonitrile to remove any remaining SDS, salt, and stain, Next, the pieces were dried to remove any solvent, then rehydrated with trypsin (8–10 ng/μL) and incubated for 8–10 h at 37°C. The proteolytic reaction was terminated by the addition of 5 μL 0.5% trifluoroacetic acid. Peptides were recovered by combining the aqueous phases obtained from extracting pieces of gel with 50% aqueous acetonitrile. After concentration, the peptide mixture was desalted using C18ZipTips (Millipore) and eluted in 1–5 μL of acetonitrile. An aliquot of this solution was mixed with an equal volume of a saturated solution of α-cyano-4-hydroxycinnamic acid in 50% aqueous acetonitrile, and 1 μL of the mixture was spotted onto a target plate.
Matrix-Assisted Laser Desorption Ionization–Time-of-Flight (MALDI–TOF) Analysis and Database Search.
A protein analysis was performed using MALDI–TOF (Amersham Biosciences). Peptides were evaporated with an N2 laser at 337 nm using a delayed extraction approach. They were accelerated with a 20-kV injection pulse to analyze the time of flight. Each spectrum was the cumulative average of 300 laser shots. The search program ProFound, developed by Rockefeller University (http://129.85.19.192/profound_bin/WebProFound.exe), was used for protein identification using peptide mass fingerprinting. Spectra were calibrated with the trypsin autodigestion ion peaks m/z (842.510, 2211.1046) as internal standards.
Data Analysis.
Tumor specimens were divided into 2 groups on the basis of their protein expression patterns. HCCs were part of group A, whereas group B included the intermediate-phenotype HCC and the cholangiocarcinomas, because the protein expression pattern of the intermediate-phenotype HCC was close to that of the cholangiocarcinoma group (Figs. 1A and 1B). Comparisons between the 2 characteristics (normal vs. group A, normal vs. group B, and group A vs. group B) were assessed using a Student t test, and relationships were considered statistically significant when P < 0.05. Relative spot intensity (tumor/normal) was calculated in each group for comparison.

(A) Two-dimensional gel electrophoresis map of human liver tumor tissue demonstrates numerous protein spots. (B) Proteome analysis enables grouping of tumors (normal, HCC, and cholangiocarcinoma groups) as seen on distance tree mapping of protein expression profiles. However, protein expression pattern of intermediate phenotype of HCC group (patient 7) is close to cholangiocarcinoma group.
Reverse Transcription–Polymerase Chain Reaction (RT–PCR)
Total RNA was successfully isolated from 2 HCCs including the intermediate phenotype, 2 cholangiocarcinomas, and 3 adjacent normal liver tissues using a Trizol reagent (Introgen) as directed by the manufacturer’s protocol. Messenger RNA (mRNA) expression of the first reaction enzyme in the pentose phosphate pathway (PPP)—that is, glucose-6-phosphate dehydrogenase (G6PDH)—was evaluated. First-strand complementary DNA was synthesized from 3 μL of the total RNA using random hexamer and Superscript II reverse transcriptase (Life Technologies). One microliter of the reverse transcription reaction mixture was amplified with primers specific for G6PDH, and glyceraldehyde 3-phosphate dehydrogenase (GAPDH) as an internal control in the total volume of 50 μL. Linearity of the PCR was tested by amplification cycles between 25 and 30. Primers used in PCR were as follows:
G6PDH-sense, 5′-ACCTGGCCAAGAAGAAGATC-3′
G6PDH-antisense, 5′-TAGGAGGCTGCATCATCGTA-3′
GAPDH-sense, 5′-ACCAC AGTCC ATGCC ATCAC-3′
GAPDH-antisense, 5′-TCCAC CACCC TGTTG CTGTA-3′
RESULTS
Immunohistochemistry
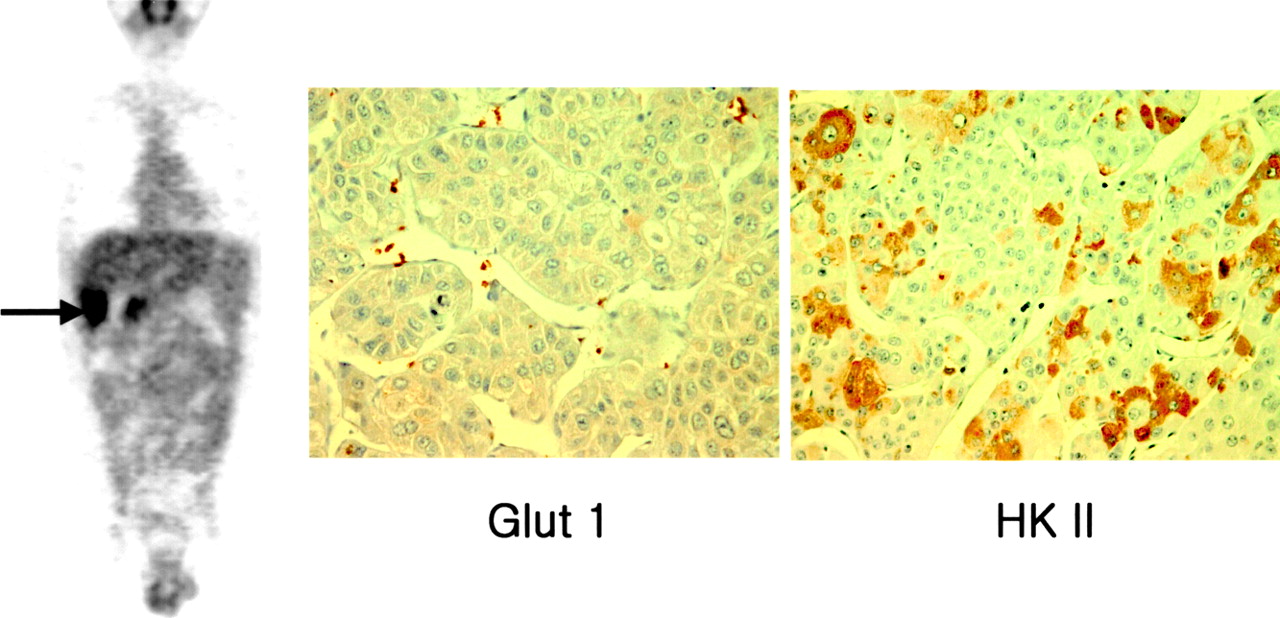
Immunoreactivity for Glut 1 was positive in all cholangiocarcinomas but was negative in all HCCs except one (Table 1). In contrast, HK II was positive in HCCs but was negative in 6 of 7 cholangiocarcinomas (Figs. 2 and 3). CK-19 was positive only in the HCC, which had positive reactions for both Glut 1 and HK II. This is consistent with the intermediate phenotype of HCC (Fig. 4).

Nodular HCC (Edmondson grade II–III) in right lobe of liver, inferior segment, shows increased 18F-FDG uptake on PET scan (patient 3). Immunohistochemical staining shows a negative reaction for Glut 1 but a positive reaction for HK II (×400).

Mass-forming cholangiocarcinoma in right lobe of liver, inferior segment, shows intense 18F-FDG uptake (patient 10). Pathologically, tumor shows a strong positive reaction for Glut 1 along cell membrane but a negative reaction for HK II (×400).

Mass with intense 18F-FDG uptake as seen in Figures 2 and 3 shows a positive reaction for both Glut 1 and HK II and, additionally, the biliary marker CK-19 (patient 7) (×400). Morphologically, lesion is classified as an HCC; however, biologically, it has both HCC and cholangiocarcinoma phenotypes.
Clinical and Pathologic Data
HK I was weakly positive in only one HCC, and HK-III was weakly positive in one HCC and 2 cholangiocarcinomas.
Protein Expression Profiles
A total of 331 protein spots that had a P value of <0.05 were selected for identification. Thirteen proteins involved in the metabolism of carbohydrates were chosen from this total for comparison and were classified as shown in Table 2.
Proteins Involved in Carbohydrate Metabolism
PPP.
The expression of 6-phosphogluconolactonase, the second step enzyme in the PPP, was markedly increased in group B (Fig. 5). Although G6PD, the first step-regulating enzyme, was not identified on proteome analysis, mRNA expression on the RT–PCR significantly increased as the 6-phosphogluconolactonase protein expression pattern (Fig. 6).

Protein expression level of glutathione peroxidase (GPO) and especially 6-phosphogluconolactonase (6-PGL) is increased in both HCC and cholangiocarcinomas, more in cholangiocarcinoma group. (Group A includes HCCs; group B includes intermediate phenotype of HCC and cholangiocarcinomas.).

mRNA expression of glucose-6-phosphate dehydrogenase (G6PDH) is markedly increased in intermediate-phenotype HCC and cholangiocarcinomas (Cholangio) compared with normal and HCC.
Tricarboxylic Acid (TCA) Cycle.
Six enzymes of 8 successive reaction steps in the TCA cycle were differentially expressed. Isocitrate dehydrogenase (3rd-step reaction enzyme) and β-succinyl CoA synthetase (5th-step reaction enzyme) were increased, whereas α-ketoglutarate dehydrogenase (4th-step reaction enzyme), succinate dehydrogenase (6th-step reaction enzyme), and fumarase (7th-step reaction enzyme) were decreased in both groups, more significantly in group B. Pyruvate carboxylase involving in anaplerotic reaction increased in group A but decreased in group B.
Gluconeogenesis.
Glyoxalate reductase/hydroxypyruvate reductase was decreased in group B, and phosphoenolpyruvate carboxykinase (PEPCK) was decreased in both groups, but was more pronounced in group A.
Others.
Pyruvate kinase, mannosephosphate isomerase, citrate lyase, and ketohexokinase decreased in both groups. Glutathione peroxidase (GPO), which is essential in the normal detoxification of H2O2, was increased in both groups. This increase was higher in group B (Fig. 5).
Glut 1 and HK proteins could not be identified on proteome analysis, possibly due to technical difficulties encountered during the extraction of membranous proteins (14).
DISCUSSION
Hepatocyte origin HCCs and bile duct origin cholangiocarcinomas are the major primary hepatic carcinomas. Although both high-grade HCCs and intrahepatic mass-forming cholangiocarcinomas showed high rates of glycolysis—that is, increased 18F-FDG uptake on PET scans—our results demonstrated that the mechanisms involved in glucose uptake and glycolytic metabolism appear to be different from each other.
Although most malignant cells highly express glucose transporters, especially Glut 1 (6, 15), it is not increased in HCCs (7), as was seen in our study. The exact mechanisms have not been fully evaluated, but previous reports have revealed that the growth of HCCs is glutamine dependent (16, 17), and fatty acids are the major energy source in HCC cells (18). These findings might be possible explanations for the low incidence of Glut 1 expression and lower 18F-FDG uptake in HCCs compared with cholangiocarcinomas.
In addition to Glut 1, HKs—the first rate-limiting enzymes of the glycolytic pathway—also play a pivotal role in 18F-FDG uptake and glycolytic pathways in malignant cells. Among the 4 hexokinase isozymes in mammalian tissues (HK I–IV), HK II is markedly increased in rapidly growing, highly malignant tumors, including HCCs (19, 20). Additionally, an isozyme shift from type IV (glucokinase) to HK II has been observed in HCCs (21, 22). However, most of the cholangiocarcinoma tissues did not demonstrate increased expression of HK II despite high 18F-FDG uptake. The mechanisms of low expression of HK II in cholangiocarcinoma were not investigated, but previous data demonstrated that glucose-6-phosphate production depends more on the phosphorylating enzyme activity of HK II than on the protein expression level (23) and hexokinase is inhibited by the increased concentration of intracellular glucose-6-phosphate, which suggests that 18F-FDG uptake does not always parallel the HK protein expression level. However, in conditions in which carbohydrates are limiting, as is seen in HCCs (24), it is important to have an increased amount of HK II protein, especially the mitochondrial bond form for efficient glucose use in cancer cells. In fact, mitochondrial-bound hexokinase accounts for as much as 70% of the total cellular hexokinase in hepatoma cells, whereas the amount found on the mitochondria in normal liver cells is negligible (25). HK II bound to porins on the outer mitochondrial membrane prevents apoptosis via Bax-induced inhibition of cytochrome c release (26), Bax conformation change, and BID cleavage in association with activated serine/threonine kinase Akt/PKB (Akt) (27, 28).
Glucose-6-phosphate produced by HK II can be used for lactate production, glycogen synthesis, the PPP for lipid or nucleotide synthesis, and also reduced nicotinamide adenine dinucleotide phosphate (NADPH) generation to maintain the redox state of the tumor cells under oxidative stress. However, use of glucose-6-phosphate for oxidative phosphorylation via the TCA cycle is relatively lower than for glycolysis or the PPPs as described previously (29–31).
In our study, both tumors showed an increase in the expression of the second-step enzyme, 6-phosphogluconolactonase, in terms of the PPP. The increase was greater in group B. Although the first-step enzyme, G6PDH, was not identified by proteome analysis—probably due to failure in protein solubilization during the IEF step (14)—mRNA expression was markedly increased in group B on RT–PCR. These findings may support the fact that the PPP plays an important role in cancer cell survival in cholangiocarcinomas or intermediate-phenotype HCCs. NADPH generated by enhanced pentose phosphate shunt produces the reduced form glutathione (GSH) from the oxidized form (GSSH); therefore, it further activates 6-phosphogluconolactonase activity (32). Moreover, glutathione peroxidase, which renders the cells resistant to H2O2, was overexpressed in our study, particularly in group B. This appears to be an additional cellular protective mechanism against oxidative stress.
The enzyme expression pattern involved in the TCA cycle was variable. Fluctuation in the concentration of key metabolites such as glutamine and glutamate, which reflect the cellular balance between adenosine triphosphate production and consumption, could have caused these enzyme expression variations. The clinical implications of metabolic regulations in the TCA cycle were not fully investigated in these tumors. Further studies are required.
Gluconeogenic enzymes such PEPCK were diminished in both groups, which is concordant with a previous report (33), and activation of Akt is known to be sufficient to repress the glucocorticoid and cyclic adenosine monophosphate–stimulated increase in PEPCK gene transcription (34).
An intriguing finding in our study was that the protein expression pattern in the intermediate phenotype of HCCs was quite close to that of cholangiocarcinomas. Detailed molecular and biologic analysis in this particular type of cancer is required for a better understanding of the tumor characteristics and behaviors.
CONCLUSION
HCCs have different glucose-regulating mechanisms and enzyme expression pattern than those of cholangiocarcinomas, even though both tumors show similarity in the enhanced glucose uptake pattern on PET scans. Further studies are required with regard to the energy metabolism and 18F-FDG uptake patterns in association with various oncogenic alterations, because the tumor-suppressor genes p53, H-ras, HIF-α, c-myc, and Akt regulate glucose use in multiple steps of the glycolytic pathways (35).
Acknowledgments
This study was supported by the Brain Korea 21 Project in Medical Science, a faculty research grant of Yonsei University College of Medicine for 2003 (no. 6-2003-1033), the National Core Research Center for Nanomedical Technology (grant R15-2004-024-02002-0), and a nuclear research and development project, Ministry of Science and Technology, Korea
Footnotes
Received Apr. 5, 2005; revision accepted Jun. 27, 2005.
For correspondence or reprints contact: Jong Doo Lee, MD, PhD, Division of Nuclear Medicine, Department of Diagnostic Radiology, Yonsei University College of Medicine, 134 Shinchon-dong, Seodaemun-gu, Seoul, 120-752, Korea.
E-mail; jdlee{at}yumc.yonsei.ac.kr.
REFERENCES
In this issue


Jump to section
Related Articles
Cited By...
- A Continuously Infused Microfluidic Radioassay System for the Characterization of Cellular Pharmacokinetics
- Fructose Protects Murine Hepatocytes from Tumor Necrosis Factor-induced Apoptosis by Modulating JNK Signaling
- Evaluation of the Role of Hexokinase Type II in Cellular Proliferation and Apoptosis Using Human Hepatocellular Carcinoma Cell Lines
- Clinical applications and advances of positron emission tomography with fluorine-18-fluorodeoxyglucose (18F-FDG) in the diagnosis of liver neoplasms
- Under normoxia, 2-deoxy-D-glucose elicits cell death in select tumor types not by inhibition of glycolysis but by interfering with N-linked glycosylation