


Abstract
Activity determination from scintillation camera images using the conjugate view method may be inaccurate because of variation in scattered radiation from adjacent organs and activity from overlapping tissues. The aim of this study was to simulate patient scintillation camera images and from these evaluate the accuracy of 2 correction methods. The contribution from overlapping tissue activity was also calculated for some organs. Methods: Biokinetic data for 99mTc-sestamibi obtained in rats was used as input to simulate scintillation camera images with a voxel-based computer phantom using the Monte Carlo method. The organ activity was calculated using the conjugate view method with either the effective attenuation coefficient method or scatter correction using the triple-energy window (TEW) method combined with attenuation correction with a transmission factor image. Images were simulated with activity in organs one by one to evaluate the accuracy of the 2 correction methods and to evaluate the activity contribution from activity in adjacent or overlapping tissues. To allow comparison with the clinical situation, the total activity distribution from the animal study was used to simulate scintillation camera images at different points in time and the calculated activity was compared with both the input data and some patient data from the literature. Results: The combination of scatter and attenuation correction gave the most accurate calculated activity, ±10% of the true activity from the images with activity in one organ at a time. In the images similar to the clinical situation, the kidney activity was overestimated up to a factor of 34, mainly because of excretion of activity through the intestines. Conclusion: The scatter correction using the TEW method in combination with attenuation correction with the measured transmission factor resulted in the most accurate activity determination of the methods used. This study also shows that organ activity data calculated from scintillation camera images may be overestimated by >90% because of activity in overlapping tissues.
The absorbed dose from radiopharmaceuticals is determined primarily from planar 2-dimensional (2D) scintillation camera whole-body images acquired sequentially over a period of time. However, these images provide no depth information because they are measured projections. The standard method for quantification of organ activities and the redistribution with time between different organs is the conjugate view method (1). This method is based on measuring a source located at some effective depth, d, in a medium characterized by an attenuation coefficient, μ. The measurements are often conducted in an anterior view, CA, and in a posterior view, CP, which can be described by:
 Eq. 1 where L is the thickness of the patient in the particular section and C0 is the counting rate that would have been obtained if the source had been in air. The result will be independent of the source depth, d, when calculating the geometric mean of CA and CP:
 Eq. 2 The activity is determined from the system sensitivity (cps/MBq) in air, K, provided that the attenuation, described by the exponential term, can be obtained:
 Eq. 2 The source organ thickness can be considered in Equation 3 as follows:
 Eq. 4 in which l is the organ thickness. In patients, the attenuation coefficient that should be used is a weighted sum of the coefficients
 for all tissues, i, along the projection. This weighted sum of attenuation (or fraction of transmitted photons) can be measured by mounting a radioactive flood source on the opposite side of the patient and making a set of 2 measurements with the scintillation camera, one with and the other without the patient. A transmission factor image can then be obtained by calculating the ratio between these measured images on a pixel-by-pixel basis.
Scatter detected in the energy window is unwanted events in the projection. For practical purposes, an effective attenuation coefficient, μeff, which is lower than the tabulated linear attenuation coefficient, is often used in the attenuation correction. The purpose here is to balance the additional counts by reducing the magnitude of the attenuation correction.
Quantification of in vivo activity distributions with the conjugate view method is hampered by contributions from activity in overlapping organs, which is often incorrectly called background. These overlapping tissues require careful selection of a representative region of interest (ROI) for activity subtraction. When drawing a ROI around an organ, other overlapping organs and tissues should not be included or avoided as far as is possible. One solution is to use a smaller ROI and scale the number of counts by the total number of pixels covering the whole organ area.
The aim of this study was to evaluate the accuracy of the conjugate view method when applied to absolute quantification of the organ activity. We compare the activity determined from whole-body images with the actual activity content in the various organs. To investigate the stages of the quantification procedure, the study is based on Monte Carlo simulated scintillation camera images of a realistic voxel-based computer phantom. Time–activity distributions of 99mTc-sestamibi, obtained in a separate experimental rat study, were simulated in the present study. This radiopharmaceutical provides an example of a biodistribution that can give great errors in the activity quantification. It has a high activity uptake in the muscle and is excreted through the intestines; therefore, the influence of overlapping organs on the quantification of organ activity was of particular interest. In the clinical situation, it is difficult to make an accurate activity determination from planar scintillation camera images because of overlapping tissues. This is especially true for 99mTc-sestamibi. The organ activities calculated from the simulated images were compared with previously published patient data (2).
MATERIALS AND METHODS
Biokinetic Data
Biokinetic data for 99mTc-sestamibi (Cardiolite; DuPont de Nemours) was obtained earlier from an experimental rat study and was used as input for the Monte Carlo simulations. In this experimental study, a total of 61 Wistar rats (Moellegard Breeding Center Ltd.) were injected intravenously with 99mTc-sestamibi in the vena femoralis under anesthesia. The animals had access to standard laboratory food and tap water ad libitum. The radiochemical purity was checked as described by the manufacturer. Sacrifice and dissection were performed at 5 min, 30 min, 2 h, 6 h, 12 h, 18 h, and 24 h after injection (6–10 animals at each point in time). The major organs, including the gastrointestinal tract, were excised and the contents of the stomach and the intestines were separated from the gastrointestinal wall. The activity in the different tissues was measured with a NaI(Tl) well-counter detector (1282 Compugamma; Pharmacia LKB Wallac). The biodistribution of the activity at the various times used in the Monte Carlo simulations is given in Table 1.
Activity in Different Organs Obtained from the Laboratory Animal Study and Used for Image Simulations
Anthropomorphic Phantom
The Zubal voxel-based phantom (3) was used to simulate a patient. Several extensions, including the addition of arms and legs, have been made by Dawson et al. (4) and Sjögreen et al. (5) to provide a version of the phantom that is useful for simulation of whole-body images. This version of the phantom consists of 493 slices, each with a matrix size of 192 × 96. Each voxel value has a unique code that identifies the organ to which the voxel belongs. From its code, both the activity distribution and an accurate density distribution can be obtained. The size of the voxels was chosen to give a patient with a height of 170 cm.
Monte Carlo Simulations
Monte Carlo simulations were performed with the SIMIND code (6). The simulated scintillation system was a 9.35-mm NaI(Tl) scintillation camera with an energy resolution of 10.9% full width at half maximum at 140 keV, equipped with a low-energy, general-purpose collimator. The energy window was 20%. Anterior and posterior projections were simulated for a 192 × 512 matrix with a pixel size of 3.6 mm. Two additional 4-keV-wide energy windows were defined on each side of the main photopeak window to produce data for scatter correction using the triple-energy window (TEW) method (7). This method estimates the scatter from the average of the images obtained from the two 4-keV energy windows after first scaling them by the differences in the energy window sizes relative to the photopeak window. In addition, a transmission image of an uncollimated 99mTc flood source was simulated to obtain a transmission factor image for the attenuation correction. The transmission image matches the emission images and the spatial resolution is of the same magnitude. Only primary photons were simulated to avoid problems in the transmission image caused by the presence of scatter. A total 99mTc-sestamibi activity corresponding to that used in patient studies was used in the simulations. The number of counts in the tissues was high enough to keep the statistical error in all ROIs below 2%. Simulations were performed for the following cases.
Single Organs.
Separate images were simulated for brain, thyroid, heart, lungs, liver, pancreas, kidneys, small intestine, and spleen to compare the accuracy in the activity determination obtained with the 2 correction methods when no activity from overlapping organs or scatter from nearby tissues was present.
All Organs.
Images of activity distributed in all organs were simulated using the data obtained at the 7 points in time in the animal study. The same biodistribution was assumed in humans as in laboratory animals. No extrapolation of animal data was performed.
Overlapping Organs.
Ten images were simulated for each point in time to study the influence of overlapping tissues. The first 8 images consisted of the small intestine, colon, pancreas, liver, muscle, spleen, heart, and lungs and these organs were simulated separately. The ninth image included the bladder, stomach, testes, thyroid, brain, bone marrow, and blood pool. This image is called “other tissue,” and the tissues were grouped into one image as the activity uptake was <1% of the injected activity or because the tissue is distributed throughout the body resulting in a low activity concentration due to an activity uptake of <4%, such as the bone marrow and the blood pool. The remaining organs defined in the phantom were finally collected together to form image number 10 and denoted the “remainder of the body.” In all images we used the activity data obtained from the laboratory animal study.
Correction Methods
The activity in the organs was calculated using the conjugate view method and by 2 different scatter and attenuation correction methods. The following correction methods were used.
Effective Attenuation Coefficient (EAC).
This method employs a single effective attenuation coefficient, μeff = 0.13 cm−1 for the attenuation correction (2). The phantom was divided into 8 different sections of approximately equal body thickness used for attenuation correction.
Scatter Correction and Transmission Factor (SC-TF).
This method includes scatter correction of the anterior and posterior images using the TEW method, and attenuation correction is performed using the transmission factor image.
Organ and body thicknesses were measured from the transverse slices of the phantom. In addition, to evaluate the accuracy in the activity determined with the EAC and SC-TF methods, images were simulated without any photon interaction in the phantom but with camera limitations, such as energy resolution and collimator blur. This simulation, denoted NSA (no scatter or attenuation), represents the result when a perfect attenuation and scatter correction is applied; these images can therefore be regarded as reference images.
Data Evaluation
The simulated scintillation camera images were displayed using the public-domain program Osiris (8). We used a linear gray scale for display, and ROIs were manually drawn for the visible organs and saved using a computer program (EZ Macros 5.0a; American Systems) to ensure that the same ROIs were used in all images. For some of the organs, other tissues were included in the ROI, making it necessary to reduce the size of the ROI to only part of the organ to minimize the influence of overlap by other tissues. The organ activity was calculated from the counts obtained in this smaller ROI and then adjusted to the total organ area. Correction for activity contributions from over- and underlying tissues was made (9). Background counts were corrected for organ thickness before subtraction from organ counts, using a factor, F:
 Eq. 5 where l is the organ thickness and L is the body thickness at the source organ obtained as described.
The activity in each organ, as determined from the simulated images, was compared with the actual activity used for simulation. The organ activities obtained from the simulations were also compared with patient data (2) obtained with a scintillation camera with the same performance as that in the present Monte Carlo simulations.
The ROIs used were drawn in the images showing all organs simulated in the same image in analogy with the clinical situation. However, for the comparison of the different correction methods in the simulations of single organs, the ROIs were drawn in the NSA images with single organs where the “true” image of each organ was given. The ROIs were large enough to cover the organ of interest to ensure that the size of the ROIs did not affect the results of the comparison of correction methods.
To study the contribution to the kidney activity from adjacent and overlapping tissues, 10 images were simulated containing separate organs or several tissues in one image. A ROI was drawn over parts of the kidneys such that the influence of overlapping tissues was minimized, and this was then used in all images to calculate the contribution from each organ (or group of tissues) to the regions over the kidneys. The activity was calculated for this part of the organs only because the contribution of overlapping tissue activity varies in different parts of the organ. Similar calculations were performed for the liver and the heart.
RESULTS
Simulations of Single Organs
Images were simulated with single organs omitting overlapping tissues to evaluate the accuracy of the 2 correction methods described. From these images, the percentage of calculated activity relative to the known activity used in the simulations was calculated. For the NSA simulation, the activities were calculated with an accuracy within ±1.2% of the true activity, indicating that the uncertainty in the simulations was very small when the NSA was applied. Table 2 shows the results for the 2 correction methods. The EAC method overestimates the activity for most of the simulated organs. However, one exception is the thyroid, where the activity was underestimated by 24%. The activity in the other organs was overestimated by 15%–40%, except for the lungs and the pancreas.
Percentage Deviation from Actual Organ Activity for Organs Simulated Separately
The method including scatter correction in combination with a phantom-specific transmission factor gave the most accurate results. Using the scatter correction and transmission factor method, we obtained a difference from known activities in the range of −10% to +4%. The calculation of the brain activity resulted in the largest underestimation (−10%) using the SC-TF method.
Simulations of All Organs
Figure 1 shows simulated NSA images which match the kinetics obtained from the animal data at various points in time. The Figure also shows a transmission factor image of the phantom used in this study. Figure 2 shows the ratio between the calculated activity and the known activity for the kidneys, the heart, and the liver as a function of time. These organs are discussed separately here. The curves for the EAC and SC-TF corrections show in general the same pattern as the NSA images, but with greater deviations from the true activity. For these 3 organs, the calculated activity is higher for the EAC than for the SC-TF corrected images. Although the SC-TF correction slightly overestimates the activity, it gives a more accurate result than the EAC correction.
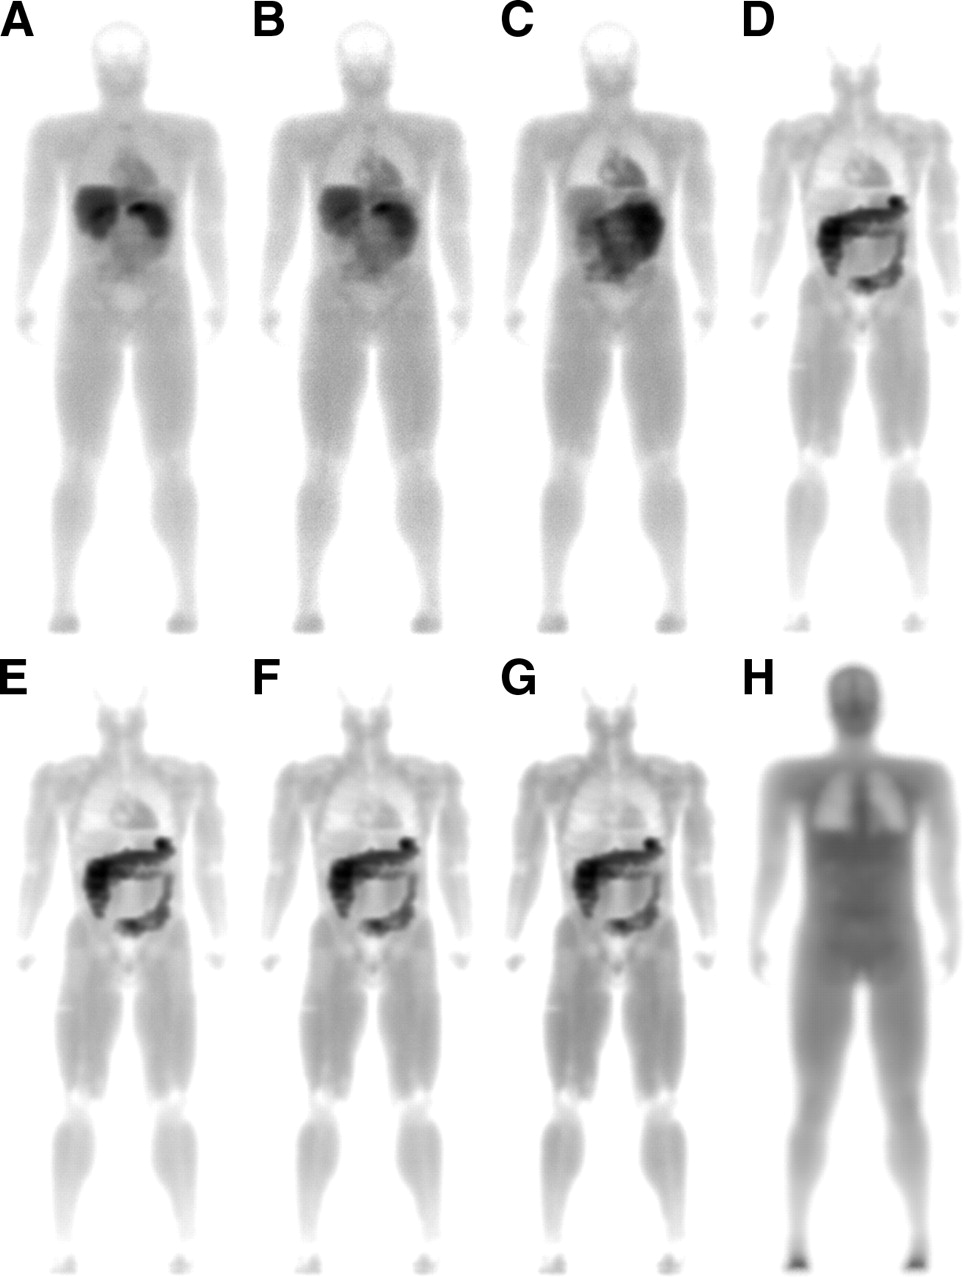
(A–G) NSA images at 7 different points in time (5 min, 30 min, 2 h, 6 h, 12 h, 18 h, and 24 h after injection). For viewing purposes, gray scale of each image has been normalized to maximum pixel value in each particular image. (H) Transmission factor image where darker areas represent values that are greater than unity and thus correspond to increased photon attenuation. Images have been modified by calculating the logarithm of the data for a better visualization.

Ratio between calculated (Calc.) activity and actual activity. Calculated activity for kidneys (A), liver (B), and heart (C) was obtained from simulated images where all organs contained activity according to biodistribution data from the animal study—that is, similar to the clinical situation. Activity was calculated using the NSA method (○), EA method (•), and SC-TF method (▴).
Kidneys.
The activity obtained from the kidney ROI is greatly overestimated (Fig. 2A). Five minutes after injection, the calculation of the activity is overestimated by 31% in the NSA case, reaching a maximum at 12 h after injection when the overestimation is a factor of 34.
Liver.
Figure 2B shows the activity ratio data for the liver. The activity was calculated with an accuracy of 11% for the 5-min image with the SC-TF method but when using the EAC method the activity was overestimated by 29%. For the time points after 6 h, the calculated activities were overestimated by up to a factor of 3.3 with the EAC method and up to a factor of 2.6 with the SC-TF method.
Heart.
The calculation of the activity uptake in the heart (Fig. 2C) resulted in 36% and 17% higher activity than the “true” activity for the first 2 time points in the NSA case, but for the images at 2 h and later the activity was determined with good accuracy (1%–8%). The SC-TF method results in an overestimation in the range of 9%–45%, which is similar to the results obtained with the NSA method. The corresponding results when using the effective attenuation coefficient method are in the range of 66%–137%.
Comparison with Patient and Animal Data
An image from the simulations and an image from a patient study are given in Figure 3 for comparison. The activity uptake in the muscle and the heart is similar in the images but there is a slight discrepancy between the activity distribution in the gastrointestinal tract shown in the simulated image and the patient image.
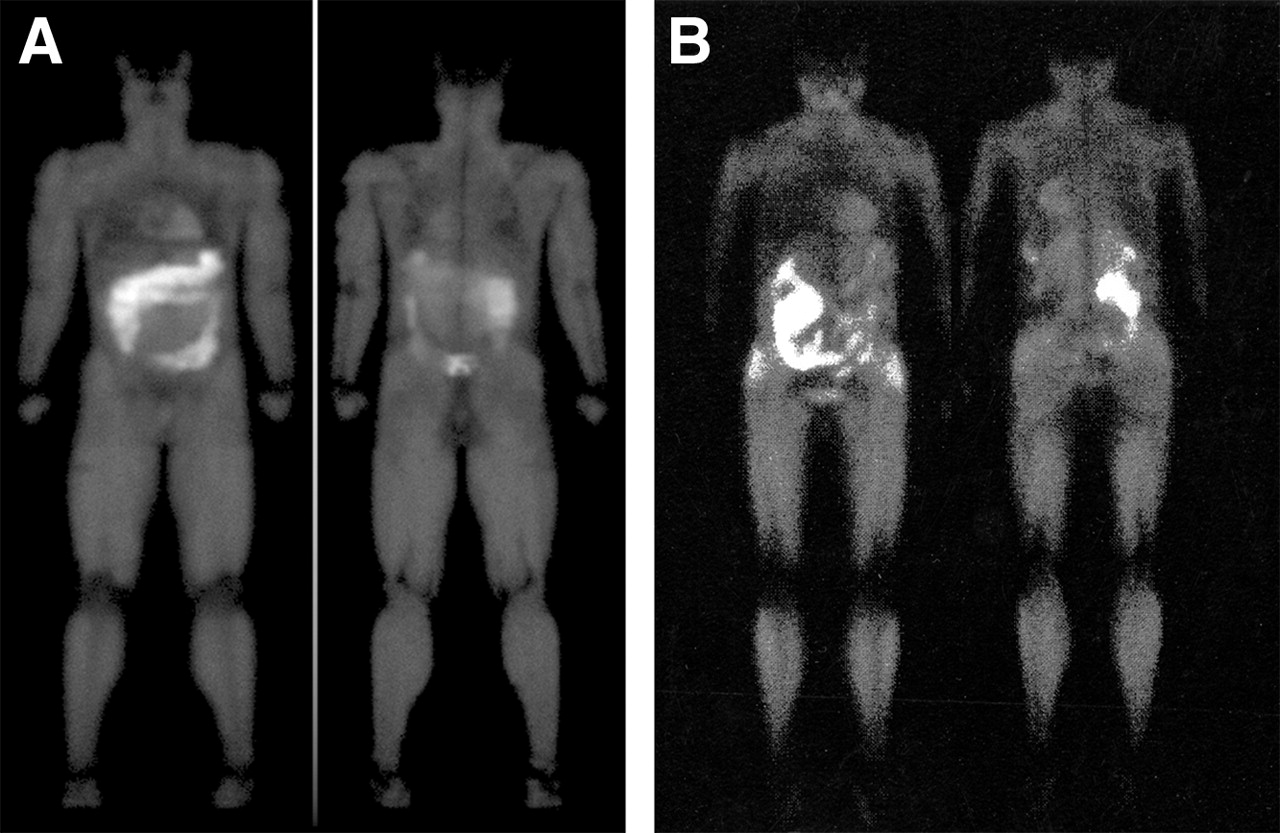
Simulated image (A) of 99mTc-sestamibi biodistribution using a voxel-based computer phantom and biodistribution data obtained in rats at 6 h after injection compared with a corresponding patient image (B). The simulated image corresponds to rest and the patient image was obtained at stress (courtesy of Sigrid Leide-Svegborn, Department of Medical Radiation Physics, Clinical Sciences, Malmö, Lund University).
Activity in the organs obtained from the animal study and the calculated activity from the simulated images (NSA, EAC, and SC-TF corrections) are given together with patient data (2) in Table 3 for 3 points in time (15 min, 6 h, and 24 h after injection) where the patient biodistribution data were available. Animal data were obtained at 5 and 30 min after injection The most relevant comparison with patient data was by using the 30-min data because the patient study started at 15 min will be finished at 25 min after injection. In general, the activity values obtained from the rat, the patient, and simulated images are on the same order of magnitude. The activity calculated from the kidney ROI at 15 min (30 min for the simulations) is the same as that for the patients and for simulated images (13% and 14% of injected activity) using the EAC correction. The NSA and the SC-TF corrections produce somewhat lower activities, 8.8% and 11%. For the remaining times, the activity obtained from the simulated images was found to be higher than those from both the rat data and the patient data. This was the case for all 3 simulations.
Comparison Between Activities Calculated by Simulations and Data Obtained from Laboratory Animal and Patient Studies
At 6 and 24 h after injection, the calculated activity for the liver was comparable between simulations and patient data (Table 3). The liver uptake at 6 and 24 h was found to be between 1.6% and 2.6% of the injected activity for the patients. This compares well with the 0.5%–1.6% value obtained from the various simulated images. At the earliest times in the patient measurements, there are greater differences between the patient data and data from both rats and simulations (7.7%–16%).
The activity in the heart is approximately the same in the rat data, the simulated images, and the patient data for all 3 time points, except for the simulation at 30 min calculated with the EAC method. In that simulation the calculated activity is a factor of 1.9 higher than for both rat data and patient data.
Simulations of Overlapping Tissues
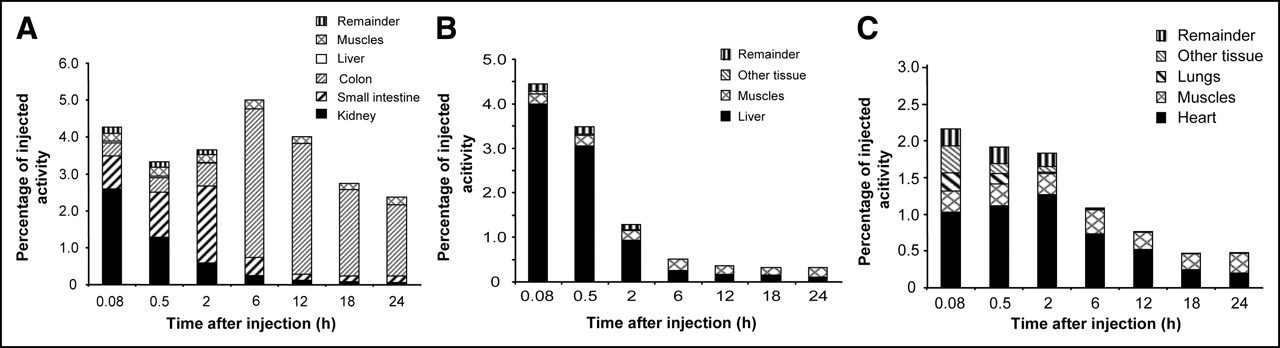
Figure 4A presents the contributions to the kidney ROI activity from overlapping tissues obtained with the NSA method. The activity in the small intestine and the colon is the major cause of the overestimation of the kidney ROI activity. The total activity in the kidney ROI is about 38 times higher than the known activity at 12–24 h after injection. These values are higher for the EAC method because of the contribution of scatter and give a total of 41 times higher activity. The pattern of the NSA, EAC, and SC-TF curves is similar, with only minor variations in the total overestimation and the contribution from each overlapping organ.

Contribution from different tissues to total organ activity calculated from ROIs in simulated scintillation camera images using NSA method. (A) Kidneys. (B) Liver. (C) Heart. Black portion of bars shows true activity.
The influence on the calculated liver activity from overlapping organs is relatively small for both the NSA (Fig. 4B) case and the 2 correction methods. The major contributors are the remainder of the body and the muscle. The ratio between the calculated and known activity is between 1.1 and 1.7 during the first 2 h after injection. At later times, the liver activity decreased to around 2 MBq and the contribution of the muscular activity to the liver ROI activity results in a ratio of 2.0–4.8 for the different calculation methods.
The heart activity increases slightly during the first 2 h after injection, giving the most accurate activity calculation at that time with an overestimation of 1.4 times for the NSA case (Fig. 4C). At most, the calculated activity is 3.2 times higher than the actual activity for the EAC correction 24 h after injection, because of activity in the muscle.
DISCUSSION
Simulation of Single Organs
The EAC method overestimates the activity for most of the organs. The reason for this could be 2-fold. First, this method includes an attenuation correction with a fixed body thickness, which means that for a human-shaped contour a correct patient thickness is not used for all locations. Second, the effective attenuation coefficient is experimentally determined but the coefficient is, by definition, spatially variant because it includes the scatter contribution, which strongly depends on the activity distribution. Correction with a single effective attenuation coefficient will therefore be accurate only for those regions for which the coefficient has been obtained. It is not specific to the actual ROI so care must be taken in the selection of a suitable value, because this is often determined from phantom experiments. The 24% underestimation of the activity in the thyroid is an example of a region that does not correspond to a correct attenuation coefficient because of the absence of surrounding scattering tissues. Hence, the effective attenuation coefficient used overcompensates for scatter in that region. Also, a relatively high fraction of the body thickness in this region is occupied by the high-density spinal column, which is not accounted for when using the effective attenuation coefficient.
The TEW scatter correction in combination with a phantom-specific transmission factor produces the most accurate results. However, the activity in the brain was underestimated by 10%. The correction for organ thickness in Equation 4 is based on only one single value for this thickness. Because the thickness of the brain together with the cerebellum varies from a few centimeters up to 18 cm in the computer phantom, one single thickness will not give the correct calculated brain activity.
Simulation of All Organs
The images in Figure 1 represent the dissection time, whereas in clinical measurements data acquisition is performed over a typical time period of 10 min. Thus, redistribution during the time interval is included in the real measurements but not in the simulated data. However, for most tissues, this is of less importance for this particular radiopharmaceutical, as shown by the biokinetic data in Table 1.
Although small ROIs were drawn over parts of the kidneys to minimize the influence from other tissues, the kidney activity is still not calculated with an acceptable accuracy. Because this is the case for the NSA images, it can be concluded that this overestimation originates from overlapping tissues and that excretion via the intestinal tract leads to serious problems in activity determination in the abdominal region.
The liver is a large organ with few adjacent and overlapping tissues and has a high initial activity uptake giving good agreement with the data used for the simulations. The increasing deviation from the known value is partially due to excretion from the liver, leading to an activity content of only 1.7 MBq 24 h after injection.
In the NSA simulation of the heart, the activity is overestimated by 36% and 17% at 5 and 30 min after injection, respectively. This may be caused by the difficulty in drawing a ROI representative of the tissues that overlap the heart—that is, lung tissue, muscle, and skeleton. As for the liver, the heart activity is low 24 h after injection and, therefore, the relative error is high, although the activity is calculated within 1 MBq with the NSA and SC-TF methods from 6 h and later.
Comparison with Patient and Animal Data
The discrepancy between the simulated image and the patient image in Figure 3 is partially explained by the lack of activity transportation through the colon in the voxel-based phantom.
For all images, the calculated organ activity is higher than the true activity. This indicates that in the clinical situation (here, the published patient data) the organ activities may be overestimated. Activity obtained from simulated images from animal data and patient activity data, both obtained from 2D images, may be in better agreement than patient image activity compared with animal data obtained from dissected tissues becauses these scintillation camera data are obtained under the same conditions.
The kidney activities obtained from the 6- and 24-h images are higher for the simulations than for the patient and animal data because the activity in the phantom is uniformly distributed throughout the colon. It was not possible to simulate the transport of activity through the intestine because it is impossible to simulate activity in only parts of an organ in the present computer phantom. This made it impossible to define a ROI over the kidneys without including counts from the intestines at these later points in time.
Simulation of Overlapping Tissues
The discrepancy between the kidney activities calculated from the simulation with all organs and from the simulation of overlapping tissues is attributed to the different sizes of the ROIs and the correction for overlapping tissues (so-called background correction) in the previous simulation. Furthermore, it can be seen that the left kidney ROI is less influenced by the intestinal activity than the right kidney ROI. The calculated activity in the right kidney ROI is around 60 times higher than the actual activity at 12–24 h, whereas the calculated activity in the left kidney ROI is about 10 times higher. This difference is because colon covers most of the right kidney. The absence of activity transportation through the colon results in a higher overlapping colon activity in the simulations than can be expected in patients. Figure 4A shows the contribution from the colon to the activity in the kidney region. From 6 to 24 h after injection, the colon represents around 80% of the kidney region activity in the simulations. Assuming that colon activity only affects one kidney at a time in the patient situation, a reduction of 80% in the kidney activity in the simulated images would result in data comparable with the published patient data (Table 3).
The drawback when quantifying the organ or tissue activity with the conjugate view method lies in the difficulty in distinguishing between tissues and drawing an accurate ROI to avoid overlapping tissues. This will be impossible in the 2D images unless the organ or tissue is the only volume in the ROI that accumulates activity.
Contributions from overlapping tissues can be a considerable problem when quantifying the activity uptake if no part of the organ can be projected without overlapping activity from other tissues. This is a problem, for example, for the kidneys when the activity is excreted through the intestinal tract and even more, as in this case, with a high muscular activity uptake.
CONCLUSION
We describe a novel approach to generating simulated human images of radionuclide biodistribution. Evaluation showed that when the organs were simulated separately, the organ activity was calculated within ±10% when the conjugate view data were scatter corrected using the TEW method in combination with attenuation correction with the measured transmission factor.
In a clinical situation, overlapping tissues constitute a serious problem when using radiopharmaceuticals with high muscular activity uptake or high blood activity or which are excreted via the intestinal tract. For 99mTc-sestamibi, investigated in this study, >90% of the calculated kidney activity is a contribution from overlapping tissues at several points in time.
Using the animal biodistribution data for simulations of scintillation camera images provides an opportunity to compare simulated images with images obtained from a patient study. Input data can be adjusted to obtain better agreement between the patient image data and the simulated data. The input activity data used will thus give a more reliable activity distribution than the activities calculated from the patient images. Good agreement between activity data obtained from simulated images from animal data and patient images could be an indication of a greater reliability of animal data in absorbed dose calculations for patients.
Acknowledgments
This study was supported by grants from The Swedish Cancer Foundation, The Gunnar Nilsson Foundation, The Swedish Medical Research Council, Lund University Hospital Donation Funds, and Berta Kamprad’s Foundation.
Footnotes
Received Apr. 4, 2005; revision accepted Jun. 9, 2005.
For correspondence or reprints contact: Lena Jönsson, MSc, Department of Medical Radiation Physics, Clinical Sciences Lund, Lund University, SE-221 85 Lund, Sweden. E-mail: Lena_M.Jonsson{at}med.lu.se


