


Abstract
Our objective was to demonstrate common patterns of ictal cerebral blood flow changes in a group of patients with mesial temporal lobe epilepsy (MTLE) using the technique of composite subtraction ictal SPECT coregistered to MRI (SISCOM). Methods: We retrospectively reviewed the video electroencephalography recordings, SPECT studies, and MR images of 32 MTLE patients and of a subgroup of 11 patients with pathologically verified mesial temporal sclerosis (MTS). Composite SISCOM studies were performed as previously described. The patients were grouped for analysis into those with right seizure onset and those with left seizure onset. The images of the right and left MTS subgroups were combined for analysis by rotating right MTS images to show changes on the left side. The SPECT subtractions were segmented to show regions of hyperperfusion at 1 SD above the mean. A rainbow color map was applied to the final composite SISCOM images to assist in the interpretation of results. Binomial probability was calculated to demonstrate the level of significance of perfusion changes. Results: All patients demonstrated typical seizure semiology of MTLE. Seventeen patients had left MTLE and 15 patients had right MTLE. The levels of significance were set at 6 of 17 (P = 0.042) for the left MTLE group, 6 of 15 (P = 0.022) for the right MTLE group, and 5 of 11 (P = 0.021) for the MTS subgroup. Results among all groups were similar. The most-contiguous area of hyperperfusion was the anterior temporal area extending to include the insular cortex and basal ganglia, lateralizing to the side of seizure onset. Conclusion: Composite SISCOM studies in patients with well-localized MTLE most commonly show a region of hyperperfusion in the anterior temporal region, which often also involves the basal ganglia and insula, likely representing the primary regions of seizure propagation. Identifying this pattern of hyperperfusion as typical for mesial temporal onset seizures should assist in clinical interpretation and localization of ictal SPECT studies.
Periictal SPECT is an accurate and reliable tool for localizing the seizure focus in intractable partial epilepsy, particularly in patients with temporal lobe seizures (1–4). In temporal lobe epilepsy, many studies have described typical ictal and postictal SPECT perfusion patterns by subjective interpretation. Ictal SPECT of unilateral temporal lobe epilepsy typically demonstrates the hyperperfusion pattern involving the anteromesial temporal region and the anterolateral and inferior temporal neocortical areas (5–7). This perfusion pattern is easily recognizable and provides valuable data for presurgical localization of the epileptogenic region, particularly in mesial temporal lobe epilepsy (MTLE). However, other complex ictal perfusion patterns involving adjacent areas of the epileptogenic temporal lobe or extending to the subcortical structures including the basal ganglia and cerebellum have been described (6–8). Although demonstrating a high concordance rate with the epileptogenic zone, these extended ictal perfusion patterns do not correlate with the poor outcome after epilepsy surgery, indicating that these patterns may represent the seizure propagation pathways rather than the epileptogenic focus (6,7). Furthermore, data from scalp and intracranial electroencephalography (EEG) support the possibility that these extended perfusion patterns of ictal SPECT studies reflect seizure propagation pathways (9–11).
The recent development of computer-aided methods of postacquisition processing of ictal and interictal SPECT images, including subtraction ictal SPECT and subtraction ictal SPECT coregistered to MRI (SISCOM), has further improved the clinical usefulness of SPECT (11–18). Such techniques normalize pixel values between ictal and interictal SPECT images and enable quantitation of differences between images. More recently, the technique of composite SISCOM, which uses nonlinear coregistration of groups of subtraction SPECT images to form a single, composite image, has been validated (19). This technique, by allowing investigation of ictal perfusion changes common to larger numbers of patients with MTLE, will have important implications in the interpretation of clinical SPECT studies performed to localize the region of seizure onset.
In this study, we used the composite SISCOM technique to systematically characterize the ictal hyperperfusion pattern in a group of patients with MTLE and a subgroup of patients with MTLE due to mesial temporal sclerosis (MTS). The purpose of this study was to demonstrate the common pattern of cerebral hyperperfusion changes on ictal SPECT scans of patients with MTLE.
MATERIALS AND METHODS
Patients and Clinical Parameters
We retrospectively reviewed all patients admitted to the Saint Louis University Hospital for EEG telemetry and selected, consecutively, 32 patients with medically intractable MTLE who underwent ictal SPECT. The study protocol was approved by the Saint Louis University Institutional Review Board. As part of the evaluation for epilepsy, all patients underwent preoperative localization of the epileptogenic focus through use of long-term video EEG monitoring, ictal and interictal SPECT, and epilepsy protocol MRI. During the study, approximately 40% of all patients admitted with a diagnosis of MTLE underwent ictal SPECT. The time of seizure onset and seizure end, the time of radiopharmaceutical injection, and the seizure semiology were determined by reviewing long-term video EEG monitoring. Seizure semiology in all patients was typical of mesial temporal lobe onset, including abdominal aura, motionless stare, oroalimentary or extremity automatism, and dystonic posturing (20,21). The epileptogenic focus was localized on the basis of long-term scalp video EEG, neuroimaging studies, and (if available) intracranial EEG and surgical outcomes.
Of the 32 patients in the study, we selected for separate analysis 11 who underwent epilepsy surgery with postsurgical confirmation of MTS, received the radiopharmaceutical injection within 30 s of seizure onset, and had a seizure lasting at least 30 s after the radiopharmaceutical injection.
Interictal and Ictal SPECT Studies
All patients were injected with 99mTc-ethylcysteinate diethylester (Dupont Merck) at a dose of 555–1,110 MBq by a specifically trained EEG technician while they were undergoing noninvasive long-term video EEG monitoring during clinical or EEG seizure activity. Interictal SPECT studies were performed in ambient room lighting, with the patient’s eyes open and ears unplugged, when the patient had had no documented seizure activity for at least 24 h. Ictal and interictal SPECT images of each patient were acquired using the same scanner and protocol, within 2 h after the radiopharmaceutical injection.
SPECT images were obtained using 2 different protocols because of an upgrade of the SPECT scanner at our institution. In protocol 1, imaging was performed with an Orbiter γ-camera (Siemens Medical Systems, Inc.). The camera head had a diameter of 44.5 cm, and the axial resolution was 4.4 mm at the center of the field of view. Tomography was performed using 64 stops at 30 s per view in a 360° rotation. Images were reconstructed by filtered backprojection with a Butterworth filter of 0.55-Nyquist cutoff frequency. Attenuation was corrected using Chang’s first-order method (attenuation coefficient, 0.12/cm). In protocol 2, imaging was performed with a dual-head ADAC Vertex Plus γ-camera (Healthcare Product Comparison System). The crystal dimensions were 52 × 64 cm, with a 9.5-mm thickness. Transaxial imaging was performed in a 128 × 128 matrix using 64 stops at 30 s per view in a 360° rotation. Approximately 1.5–2.0 million counts were acquired in total. The energy setting was 140 keV with a 20% window. Images were reconstructed by filtered backprojection with a Butterworth filter of 0.27-Nyquist cutoff frequency and 7.1 power. Attenuation was corrected using Chang’s method (attenuation coefficient, 0.12/cm). Image pixel size was 4.2 mm in a 128 × 128 array. The field of view was 54 × 54 cm
MRI
MRI was performed with a Sigma 1.5-T scanner (General Electric Medical Systems). Whole-brain acquisitions were performed in the coronal plane with fast spoiled gradient-recalled echo, a repetition time of 8.8 ms, an echo time of 1.8 ms, and a flip angle of 30°. Voxel dimensions were 0.742 × 0.742 × 1.5 mm, the field of view was 38 × 38 cm, and the matrix size was 512 × 512.
Image Processing for Ictal and Interictal SPECT Images
Postacquisition image processing was performed using Analyze AVW 4.0 (Mayo Clinic). Composite SISCOM studies were performed as previously described (19). After SPECT-to-SPECT coregistration and SPECT normalization (22), the normalized interictal SPECT image was used for the initial linear and nonlinear transformation steps.
Linear SPECT Transformation.
The normalized interictal SPECT image was matched to the template SPECT image using the MatchLab (a component of Analyze AVW 4.0) voxel-match normalized mutual information (NMI) function. The NMI function was repeated, manually changing the size and rotation to get the best initial fit. The normalized interictal SPECT image was then transformed using a linear interpolation function.
Nonlinear SPECT Transformation.
The normalized interictal SPECT image was matched to the template SPECT image using the default settings in 3-dimensional nonrigid-match NMI. The linear and nonlinear transformation parameters generated for the normalized interictal SPECT image were applied to the normalized ictal SPECT image. Interictal and ictal SPECT images were defined as transformed interictal and ictal SPECT images.
SPECT Subtraction and Thresholding.
The transformed interictal and ictal SPECT images were then subtracted (22). Subtraction SPECT studies were then segmented in binary format to show only voxel intensities greater than 1 SD above the mean. The studies were then combined using addition of all images in the group to make a composite subtraction SPECT image. Using the coregistration coordinates of the template SPECT and MR images, the composite SPECT image was coregistered to the template MR image. For the MTS subgroup of patients, the composite subtraction SPECT image with right-sided onset of seizures was coregistered to the template MR image using coordinates that inverted the x-axis so that all hyperperfusion changes would show on the left side.
Using a binomial probability calculation, the probability that a region was hyperperfused was calculated according to the total number of patients in the specified group and the number of patients who showed hyperperfusion 1 SD above the mean. Validation of this method showed that linear and nonlinear transformation steps induced only small changes in SDs of subtraction SPECT, typically approximately 1 pixel in value, which was acceptable for the purpose of creating composite SISCOM images (19).
RESULTS
Demographic and Clinical Data
Thirty-two patients were included in this study. The median age was 36.5 y (range, 11–51 y). The mean seizure duration was 91.5 s (range, 48–215 s). The mean latency of the radiopharmaceutical injection after seizure onset was 32.9 s (range, 13–87 s).
Eleven of the 32 patients underwent epilepsy surgery, had postsurgical confirmation of MTS, received the radiopharmaceutical injection within 30 s of seizure onset, and had a seizure lasting at least 30 s after the radiopharmaceutical injection. This group, which underwent a separate subgroup analysis, had an average duration of postoperative follow-up of 65 mo (range, 24–100 mo). The classification of Engle et al. (23) for postoperative outcome was class 1 for 8 patients, class 2 for 2 patients, and class 3 for 1 patient.
All patients demonstrated typical seizure semiology for MTLE. The common features of mesial temporal lobe seizure include motionless stare, oroalimentary or extremity automatism, unilateral dystonic posturing, and head deviation. The radiopharmaceutical was injected during motionless staring in 5 patients, during automatism in 15 patients, during dystonic posturing in 7 patients, and during versive (rotating) head movements in 5 patients. Fifteen patients had right MTLE and 17 patients had left MTLE. Twenty-one patients underwent epilepsy surgery. Nineteen patients had the pathologic diagnosis of hippocampal sclerosis. Other pathologic diagnoses were subcortical heterotropia (n = 1) and dysembryoplastic neuroepithelial tumor (n = 1).
Composite SISCOM
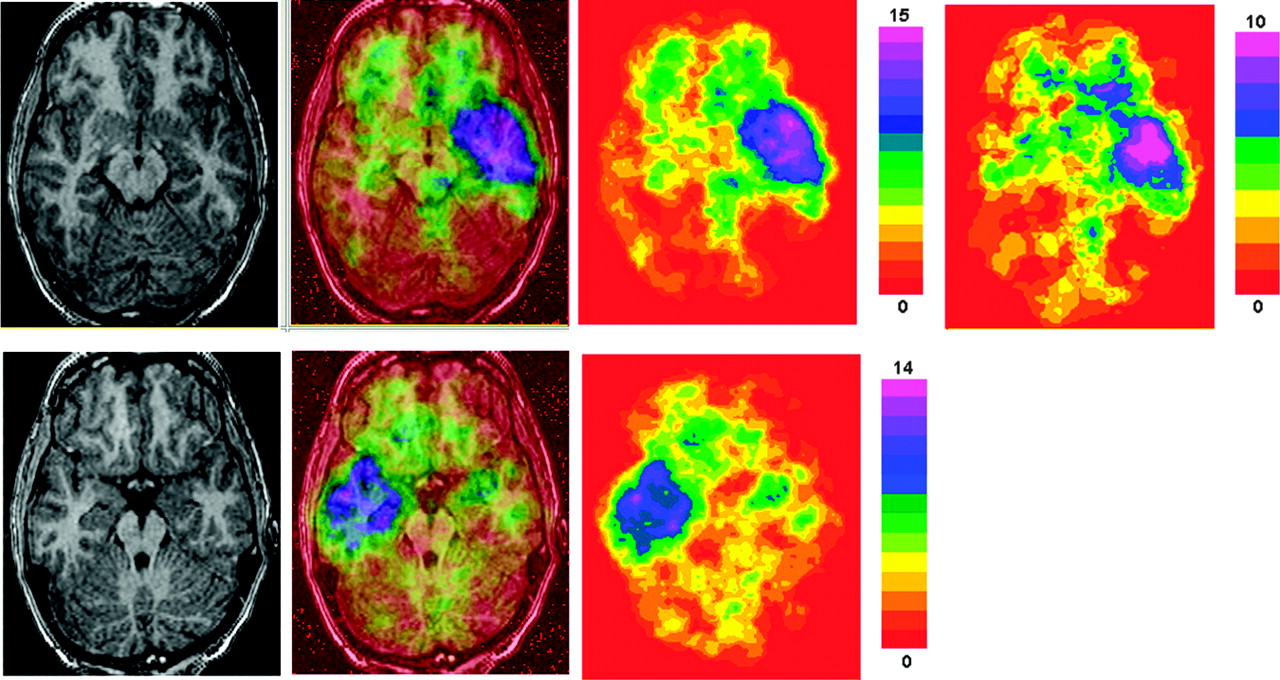
Using our method of composite SISCOM, we set levels of significance for the left MTLE, right MTLE, and MTS groups as follows: left MTLE, 6 of 17 (P = 0.042); right MTLE, 6 of 15 (P = 0.022); MTS, 5 of 11 (P = 0.021). Each color of the rainbow color scale represents a different intensity in the composite image. For example, in the left MTLE group, the highest intensity in the composite SISCOM image was 15, which represents 15 of 17 patients showing a hyperperfusion greater than 1 SD for that intensity value. Therefore, a rainbow color scale with 15 colors was applied to the left MTLE group. Figure 1 shows axial representations of the left and right MTLE groups and of the MTS subgroup, which illustrates the similarity of the perfusion patterns in all groups. The axial views illustrate the anterior temporal region as one of the regions most commonly hyperperfused. Because the left and right MTLE groups showed similar perfusion patterns, the right MTLE group was excluded from illustrations of coronal and sagittal views. To compare perfusion changes in the left MTLE group and the MTS subgroup, the MTS subgroup images are included in all figures.

Axial images (from left to right, MRI, composite SISCOM, and composite subtraction SPECT) and rainbow color scales for left MTLE group (top) and right MTLE group (bottom). At far right is composite subtraction SPECT image of MTS subgroup, matched to same MRI plane as left MTLE group. Based on highest-intensity values in image (highest-intensity value being highest value in color scale), intensities were 0–15 for left MTLE group, 0–14 for right MTLE group, and 0–10 for MTS subgroup. Transition from yellow to green represents an intensity of 6 in both right and left MTLE group color scales and an intensity of 5 for MTS subgroup. All groups show similar patterns of hyperperfusion. Entire anterior temporal lobe shows pronounced hyperperfusion in this view. Also present are distant regions of hyperperfusion in orbitofrontal and contralateral temporal lobes, likely representing patterns of seizure propagation.
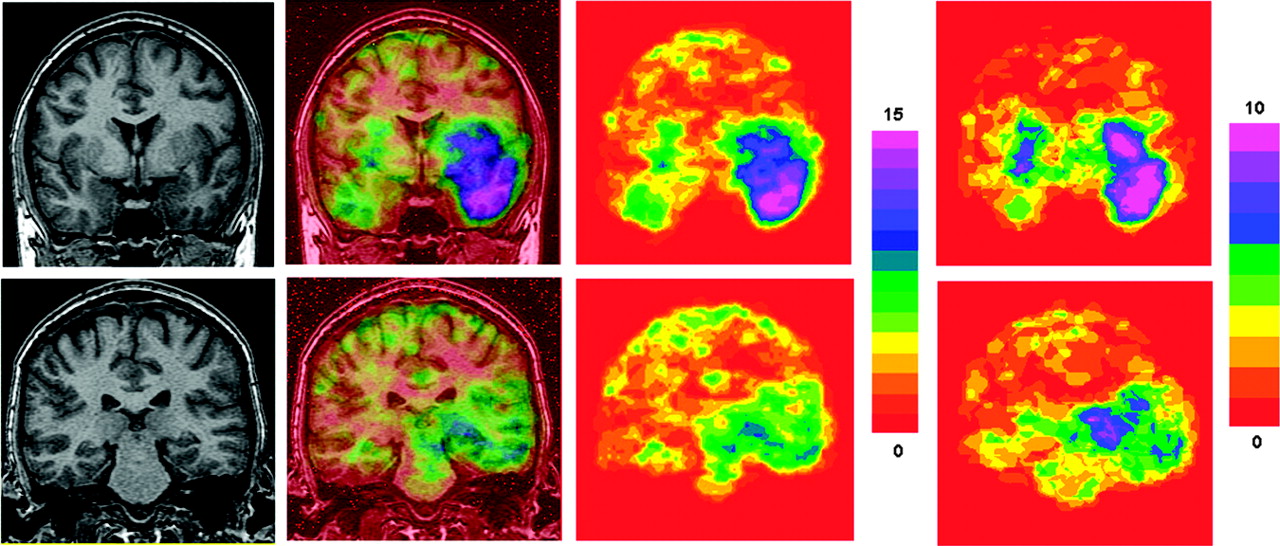
The 2 coronal sections in Figure 2 show the anterior and posterior temporal regions. The anterior section shows that all temporal lobe gyri are significantly hyperperfused, with extension of hyperperfusion changes into the basal ganglia and insula. Much of the anterior temporal lobe in the left MTLE group shows composite intensity values of 15 (represented by purple, P < 0.0001). This was the region that was most commonly hyperperfused. Also in this section, the contiguous region involving the temporal lobe, insula, and basal ganglia showed hyperperfusion in 10 of 17 patients in the left MTLE group (represented by blue, P < 0.0001). The posterior temporal region also showed significant regions of hyperperfusion, but with most of the temporal lobe showing perfusion changes at an intensity near the cutoff value for significance. The medial and basal temporal regions, in general, more commonly show hyperperfusion than do the lateral temporal structures.

Coronal images (from left to right, MRI, composite SISCOM, and composite subtraction SPECT) and rainbow color scale for anterior (top) and posterior temporal (bottom) regions of left MTLE group. At far right is composite subtraction SPECT image of MTS subgroup, matched to same MRI plane as left MTLE group. Anterior section shows that all temporal lobe gyri are significantly hyperperfused, with extension into basal ganglia and insula. Much of anterior temporal lobe of left MTLE group shows composite intensity value of 15 (represented by purple, P < 0.0001). Contralateral temporal lobe and basal ganglia are significantly hyperperfused in anterior section. Posterior temporal region shows significant regions of hyperperfusion, but with most of temporal lobe showing perfusion changes near the cutoff value for significance. Contralateral mesial temporal region also shows significant hyperperfusion.
The sagittal view in Figure 3 serves to highlight the predominance of anterior temporal hyperperfusion, as well as extension of hyperperfusion into the insula. This view shows a sharp demarcation between regions of hyperperfusion in the insula and the adjacent frontal lobe.
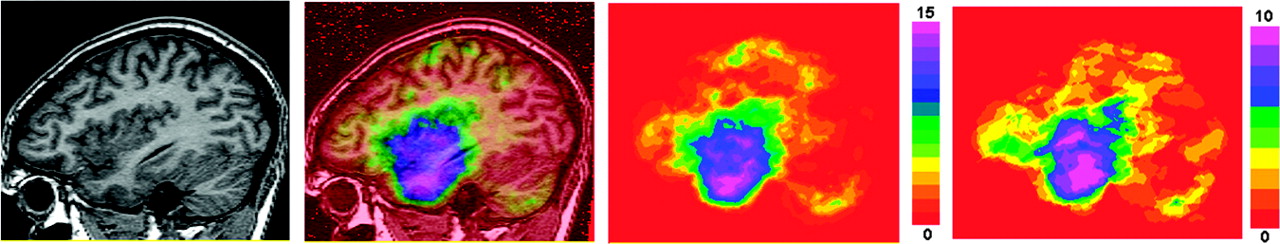
Sagittal images (from left to right, MRI, composite SISCOM, and composite subtraction SPECT) and rainbow color scale for left MTLE group. At far right is composite subtraction SPECT image of MTS subgroup, matched to same MRI plane as left MTLE group. Sagittal view serves to highlight predominance of anterior temporal hyperperfusion, as well as extension of hyperperfusion into insula. This view shows sharp demarcation between regions of hyperperfusion in insula and adjacent frontal lobe.
Within the figures, there are also regions of significant hyperperfusion outside the ipsilateral temporal lobe and adjoining structures, with intensity values at the lower limits of significance. These regions include the orbitofrontal regions (axial view), contralateral temporal lobe (axial and coronal views), thalamus, and basal ganglia (coronal views).
DISCUSSION
This study aimed to demonstrate, using composite SISCOM, the common pattern of cerebral hyperperfusion changes during complex partial seizures associated with MTLE. We chose SISCOM for image analysis because of the extensive validation (22) and clinical application of this technique (24). The accuracy of the linear and nonlinear transformation steps to create the composite SISCOM images also has previously been demonstrated (19).
Previous investigators have described multiple patterns of hyperperfusion changes in the temporal lobe during complex partial seizures of mesial temporal onset (5–7). Such patterns include hyperperfusion throughout the anterior and mesial temporal regions (1) and a predominant lateral and posterolateral rather than mesial temporal hyperperfusion (6). Furthermore, ictal hyperperfusion of other structures, such as the insular cortex (25) and basal ganglia (8,25,26), has frequently been observed in MTLE.
Because there are different patterns of ictal hyperperfusion in MTLE, we have used our technique of composite SISCOM to objectively verify patterns of hyperperfusion in a group of patients with MTLE, and a subgroup of patients with MTLE due to MTS. In this patient group, our technique shows the probability that a certain brain region will be hyperperfused during ictal SPECT studies. Our results show widespread regions of significant hyperperfusion in the temporal lobe and surrounding structures.
In our review, we included some patients whose seizures had been localized only by ictal scalp EEG. It is possible that some of these cases may represent seizures of neocortical onset, as ictal semiology and ictal scalp EEG recordings alone may not discriminate between seizures of mesial temporal or lateral temporal onset and seizures of orbitofrontal onset (27). Other factors, such as cause of epilepsy, duration of epileptic seizures, and ictal injection time, may affect ictal perfusion patterns (25). To assess what impact these factors may have had on the results for our patient group as a whole, we analyzed a subgroup of patients with histopathologically confirmed MTS who received the radiopharmaceutical injection within 30 s of seizure onset and whose seizure lasted at least 30 s after the radiopharmaceutical injection. Patterns of perfusion in the subgroup of confirmed MTS cases with early ictal SPECT injection and the group of MTLE cases as a whole were similar. This similarity suggests that the criteria for localizing seizures based on scalp EEG were valid in this patient group. The underlying reasons for the similarity of results in the groups are likely related to the temporal resolution of SPECT studies and variation in the duration of hyperperfusion after epileptic seizures.
Most SPECT radiopharmaceutical uptake in the brain occurs in 1 min and is nearly complete in 2 min after intravenous injection (28). Correlation of invasive video EEG monitoring with the time of radiopharmaceutical injection shows that uptake in the area of ictal activity occurs at the time that radioligand reaches the brain (10). Considering the relatively long temporal resolution of SPECT, a proportion of the radiopharmaceutical agent in most ictal SPECT studies will reach the brain in the postictal period. Furthermore, timing of the switch from cerebral hyperperfusion to hypoperfusion after an ictal period shows great variability between patients (15). The temporal resolution of SPECT, and interindividual variability of postictal perfusion changes, would reasonably explain the lack of differences between our MTS-subgroup and total-group results, which suggest that ictal SPECT is an inadequately precise tool to discriminate between ictal and immediate postictal physiologic changes in TLE. However, our study was designed to show ictal patterns of perfusion change in TLE and not to address this issue definitively.
Our results differ from those of a recent study that used statistical parametric mapping in MTLE and showed ictal hyperperfusion in the anterior temporal region but not in the basal ganglia (29). In that study, Van Paesschen et al. used strict selection criteria, including only patients with MRI evidence of MTS, radiopharmaceutical injections for ictal SPECT studies < 30 s after initiation of seizures, and seizure activity that lasted >30 s after ictal SPECT injection. Qualitative analysis of ictal SPECT findings in TLE (30) has suggested that these criteria for injection time and seizure duration are necessary to show ictal, rather than postictal, perfusion changes. Van Paesschen et al. postulated that the lack of hyperperfusion in the basal ganglia in their series showed that basal ganglia hyperperfusion typically occurs later in the ictal period. Differences between our study results and those of Van Paesschen et al. may be related to differences in clinical study design or methods of subtraction SPECT. The methodology and accuracy of image coregistration and statistical parameters for determining the significance of regions of hyperperfusion may affect the results of subtraction ictal SPECT studies (31). Further study will be necessary to clarify the temporal relationships of perfusion patterns in the basal ganglia during MTLE seizures.
Our series was a consecutive sample of patients with EEG-localized MTLE undergoing SISCOM, without other selection criteria. This methodology reasonably represents the typical clinical situation for acquiring ictal SPECT studies. Therefore, our results represent probable outcomes in clinical settings. Despite differences in cause of epilepsy, seizure duration, and radiopharmaceutical injection time, our findings showed that perfusion of the anterior temporal lobe was a sensitive lateralizing sign in TLE and that surrounding structures, including the basal ganglia and insula, commonly show concomitant hyperperfusion. Although ipsilateral anterior temporal hyperperfusion is common (present in 15/17 patients in the left MTLE group), it is not an invariable finding in seizures of mesial temporal onset. Studies have shown that SISCOM can falsely lateralize temporal lobe epileptic seizures (18).
Our images show other regions of hyperperfusion, which are distant from the ipsilateral temporal lobe. These more distant perfusion changes, which include the orbitofrontal regions and contralateral temporal lobe, were present in both the MTS-subgroup and total-group composite SISCOM images. Because ictal SPECT studies reflect the location of ictal discharge as measured by simultaneous intracranial EEG (10), and the orbitofrontal and contralateral temporal lobe are common regions for propagation of mesial temporal seizures (32), it is likely these changes represent patterns of seizure propagation.
CONCLUSION
In summary, composite SISCOM studies on patients with well-localized MTLE most commonly show hyperperfusion in the anterior temporal region and often also in the basal ganglia and insula. Other regions are significantly but less commonly hyperperfused and likely represent regions of remote seizure propagation. Identifying this pattern of hyperperfusion as typical for seizures of mesial temporal onset should assist in clinical interpretation of ictal SPECT studies and localization of MTLE.
Footnotes
Received Mar. 4, 2004; revision accepted Aug. 12, 2004.
For correspondence or reprints contact: R. Edward Hogan, MD, Saint Louis University, 1221 S. Grand, Epilepsy Offices, St. Louis, MO 63104.
E-mail: hoganr2{at}slu.edu
REFERENCES
In this issue


Jump to section
Related Articles
Cited By...
- Nonlesional atypical mesial temporal epilepsy: Electroclinical and intracranial EEG findings
- A Phase I Study of Samarium Lexidronam/Bortezomib Combination Therapy for the Treatment of Relapsed or Refractory Multiple Myeloma
- High-Linear Energy Transfer Irradiation Targeted to Skeletal Metastases by the {alpha}-Emitter 223Ra: Adjuvant or Alternative to Conventional Modalities?