

FIGURE 5.
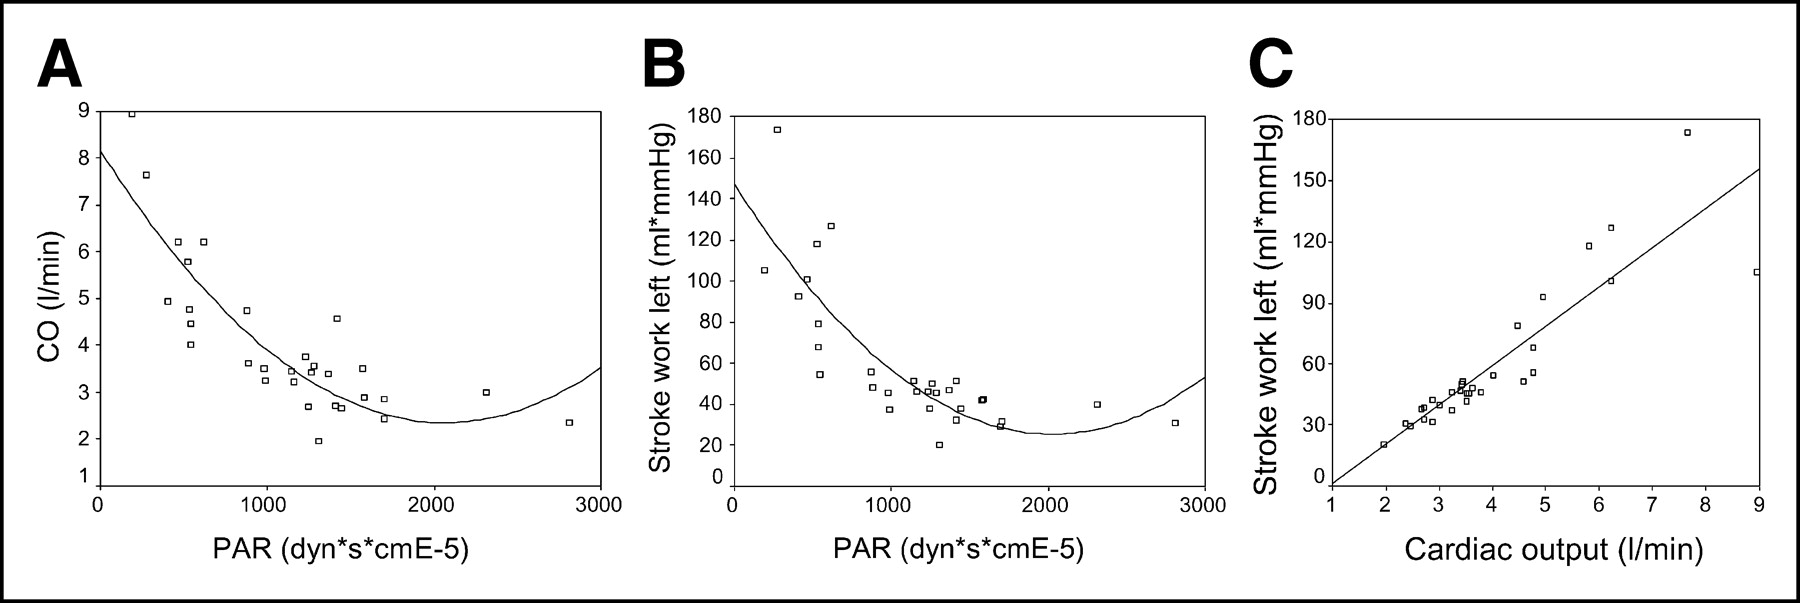
FIGURE 5.
Correlations between cardiac output, LV stroke work, and PAR: cardiac output vs. PAR (nonlinear; y = 112.733x−0.4949; r = −0.828; P < 0.001) (A), stroke work vs. PAR (nonlinear; y = 4922.29x–0.6615; r = −0.838; P < 0.001) (B), and stroke work vs. cardiac output (linear; y = −18.091 + 19.3088x; r = 0.938; P < 0.001) (C). CO = cardiac output.
In this issue


Related Articles
Cited By...
- Noninvasive Imaging in the Assessment of the Cardiopulmonary Vascular Unit
- PET Imaging May Provide a Novel Biomarker and Understanding of Right Ventricular Dysfunction in Patients With Idiopathic Pulmonary Arterial Hypertension
- Relation Between Right Ventricular Function and Increased Right Ventricular [18F]Fluorodeoxyglucose Accumulation in Patients With Heart Failure
- Benign variations and incidental abnormalities of myocardial FDG uptake in the fasting state as encountered during routine oncology positron emission tomography studies