


Abstract
Reporter probe 9-(4-18F-fluoro-3-[hydroxymethyl]butyl)guanine (18F-FHBG) and reporter gene mutant herpes simplex virus type 1 thymidine kinase (HSV1-sr39tk) have been used for imaging reporter gene expression with PET. Current methods for quantitating the images using the percentage injected dose per gram of tissue do not distinguish between the effects of probe transport and subsequent phosphorylation. We therefore investigated tracer kinetic models for 18F-FHBG dynamic microPET data and noninvasive methods for determining blood time–activity curves in an adenoviral gene delivery model in mice. Methods: 18F-FHBG (∼7.4 MBq [∼200 μCi]) was injected into 4 mice; 18F-FHBG concentrations in plasma and whole blood were measured from mouse heart left ventricle (LV) direct sampling. Replication-incompetent adenovirus (0–2 × 10⁹ plaque-forming units) with the E1 region deleted (n = 8) or replaced by HSV1-sr39tk (n = 18) was tail-vein injected into mice. Mice were dynamically scanned using microPET (∼7.4 MBq [∼200 μCi] 18F-FHBG) over 1 h; regions of interest were drawn on images of the heart and liver. Serial whole blood 18F-FHBG concentrations were measured in 6 of the mice by LV sampling, and 1 least-squares ratio of the heart image to the LV time–activity curve was calculated for all 6 mice. For 2 control mice and 9 mice expressing HSV1-sr39tk, heart image (input function) and liver image time–activity curves (tissue curves) were fit to 2- and 3-compartment models using Levenberg–Marquardt nonlinear regression. The models were compared using an F statistic. HSV1-sr39TK enzyme activity was determined from liver samples and compared with model parameter estimates. For another 3 control mice and 6 HSV1-sr39TK–positive mice, the model-predicted relative percentage of metabolites was compared with high-performance liquid chromatography analysis. Results: The ratio of 18F-FHBG in plasma to whole blood was 0.84 ± 0.05 (mean ± SE) by 30 s after injection. The least-squares ratio of the heart image time–activity curve to the LV time–activity curve was 0.83 ± 0.02, consistent with the recovery coefficient for the partial-volume effect (0.81) based on independent measures of heart geometry. A 3-compartment model best described 18F-FHBG kinetics in mice expressing HSV1-sr39tk in the liver; a 2-compartment model best described the kinetics in control mice. The 3-compartment model parameter, k3, correlated well with the HSV1-sr39TK enzyme activity (r2 = 0.88). Conclusion: 18F-FHBG equilibrates rapidly between plasma and whole blood in mice. Heart image time–activity curves corrected for partial-volume effects well approximate LV time–activity curves and can be used as input functions for 2- and 3-compartment models. The model parameter k3 from the 3-compartment model can be used as a noninvasive estimate for HSV1-sr39TK reporter protein activity and can predict the relative percentage of metabolites.
- tracer kinetic modeling
- reporter gene imaging
- HSV1-tk
- PET
- 9-(4-18F-fluoro-3-[hydroxymethyl]butyl)guanine
In the past few years, we and other laboratories have demonstrated the ability to image reporter gene expression in vivo using PET (1). In reporter gene imaging with the herpes simplex virus type 1 thymidine kinase (HSV1-tk) reporter gene, the reporter probes (e.g., 9-(4-18F-fluoro-3-[hydroxymethyl]butyl)guanine [FHBG], 8-fluoropenciclovir, and 2′-fluoro-2′-deoxy-1-β-arabinofuranosyl-5-iodouracil [FIAU]) are trapped due to phosphorylation by the protein product, HSV1-TK. When HSV1-TK is not expressed, the probe is not significantly trapped. Mammalian TK will lead to some minimal background phosphorylation. The mutant herpes simplex virus type 1 thymidine kinase reporter gene, HSV1-sr39tk, selected for a higher cytotoxicity with ganciclovir (GCV) and decreased phosphorylation efficiency of thymidine, has been shown to be a more sensitive reporter gene than the wild-type when used for microPET with fluoropenciclovir (2). 18F-FHBG has been shown to be a more sensitive probe than fluoropenciclovir (3). Quantitating dynamic microPET images of HSV1-sr39tk gene expression with 18F-FHBG is the subject of this article.
Previous methods to quantitate gene expression from images have used the percentage injected dose per gram of tissue (%ID/g tissue) using counts measured from the image and normalizing by injected radioactivity. These methods are limited because they assume the full dose enters into and clears from the bloodstream in a reproducible manner between mice and for a mouse repeatedly scanned. However, some radioactivity may remain in the interstitial space at the site of injection or clear from the bloodstream at different rates for different study sessions. Simulation studies have shown that differences in input functions may lead to the same %ID/g tissue measurement even though the underlying tissue kinetics were different (4). A better basis for normalization may be the integral of the amount of 18F-FHBG in plasma as a function of time. Furthermore, %ID/g tissue does not distinguish between transport and subsequent phosphorylation of the reporter probe of interest.
Tracer kinetic modeling has long been used for dynamic PET data (4). The mathematic models attempt to describe the probes’ behavior. These methods can account for differences in input function and separate out transport and metabolism. Preliminary results for models describing the kinetics of fluoroganciclovir (5) and 9-([1-18F-fluoro-3-hydroxy-2-propoxy]methyl)guanine (18F-FHPG; a GCV analog) (6), alternate reporter probes, have been reported. However, 18F-FHBG has been shown to be a more sensitive probe (3) and is therefore the subject of this study.
18F-FHBG (Fig. 1) is a radiolabeled analog of penciclovir (PCV), a compound very similar in structure to acyclovir (ACV) and GCV. Many of the biologic assumptions made concerning 18F-FHBG will be extrapolated from data previously published for PCV, ACV, or GCV. ACV has been shown to cross the human erythrocyte membrane by nucleobase transporters and GCV has been shown to cross the human erythrocyte membrane by both nucleobase and nucleoside transporters (7,8). It is likely that 18F-FHBG uses nucleobase or nucleotide transporters to enter and exit the cells.
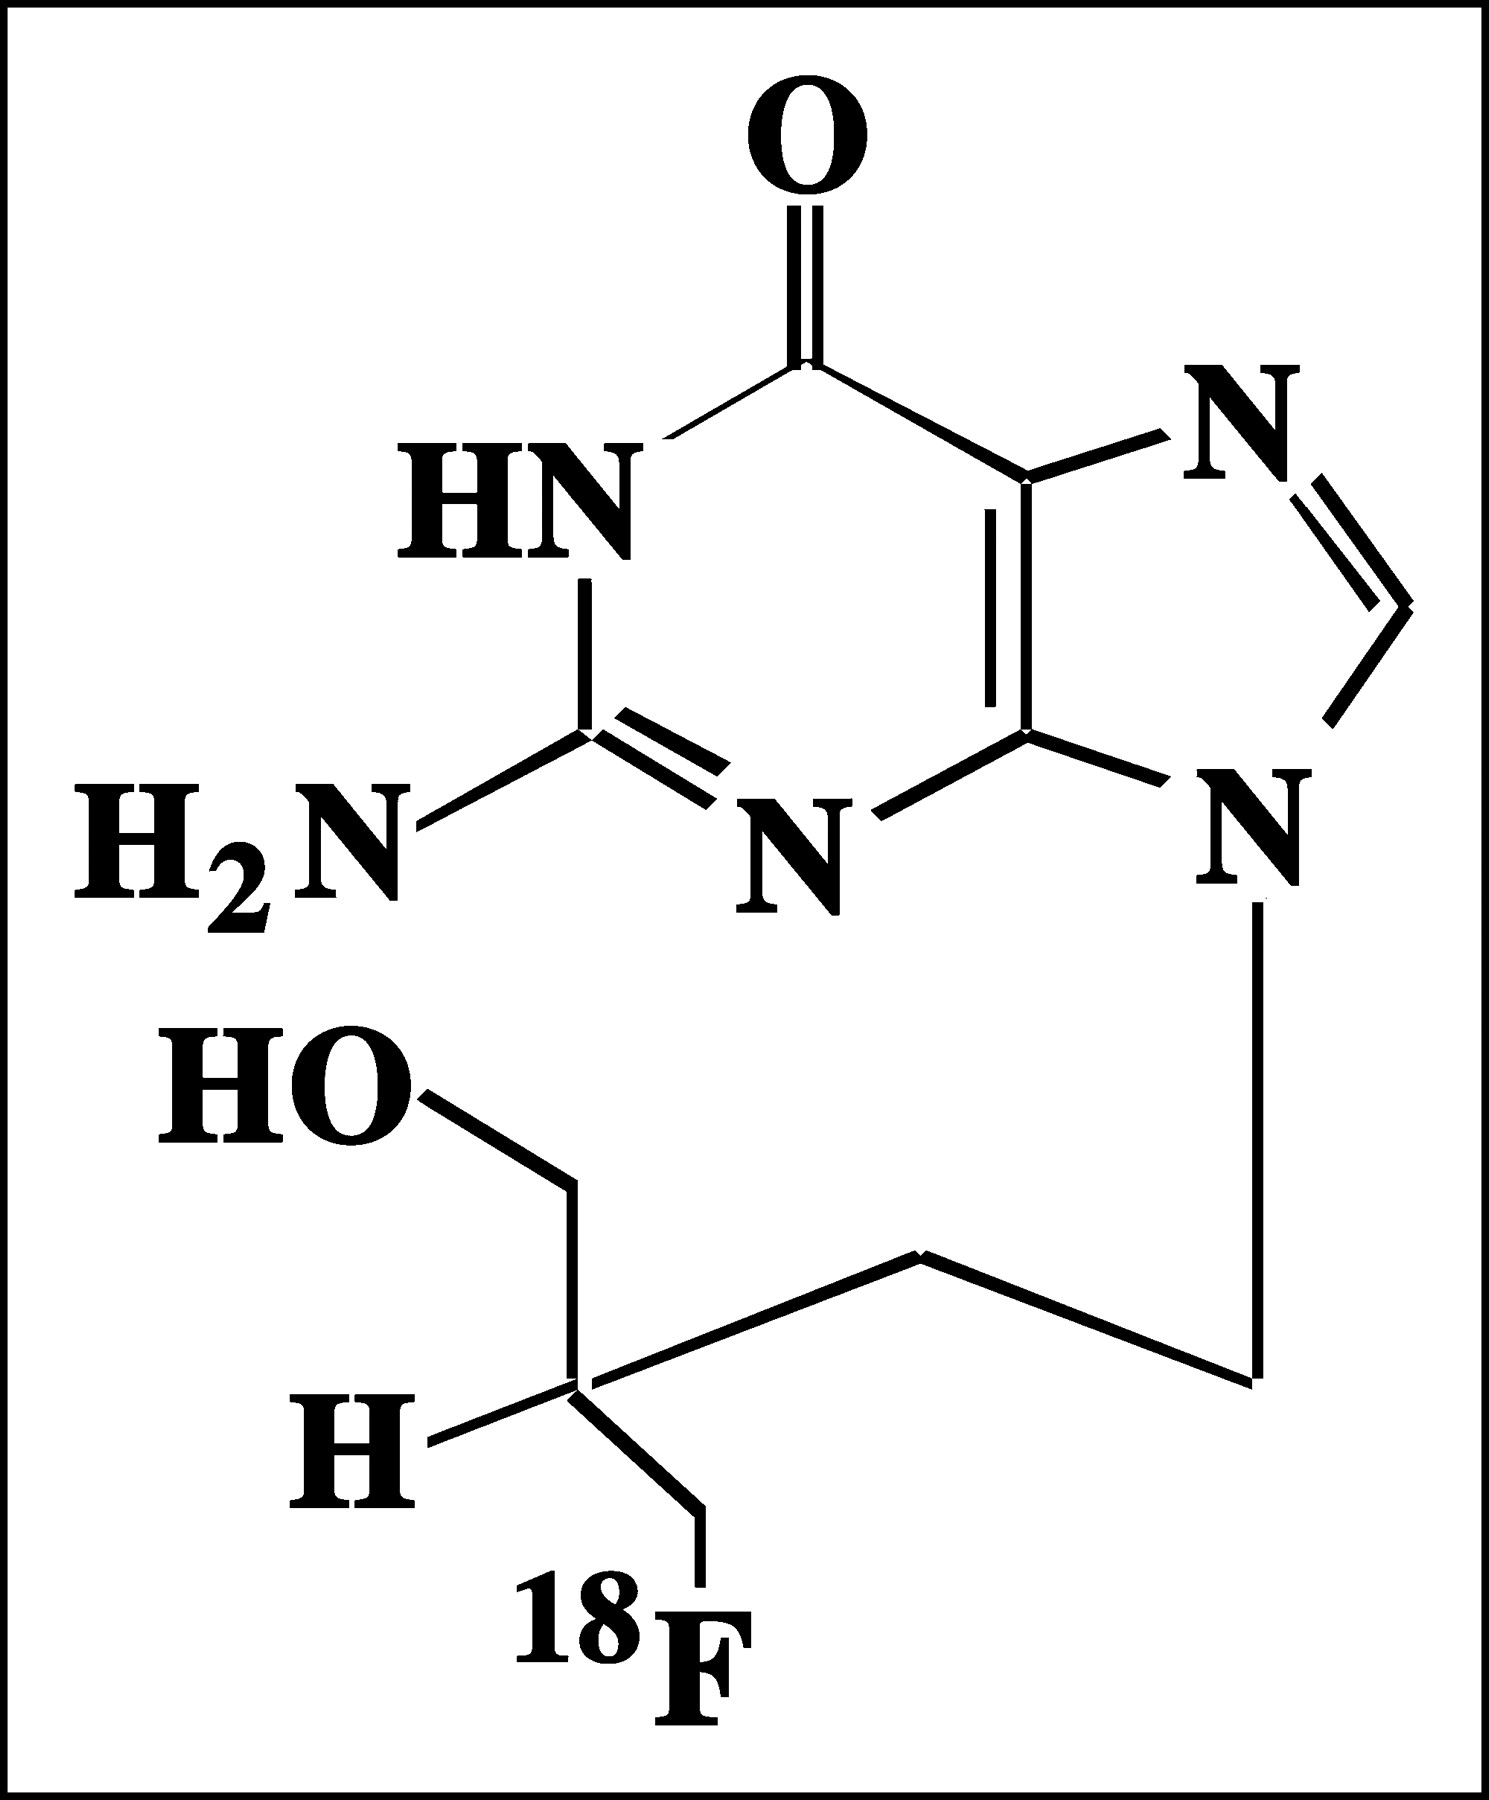
Structure of 18F-FHBG. Presence of fluorine atom renders molecule chiral.
HSV1-TK catalyzes the phosphorylation of acyclic guanosine analogs (9). Cellular host enzymes catalyze the addition of the second and third phosphates and the incorporation of the phosphorylated form into DNA. Guanosine monophosphate kinase has been shown to be the cellular enzyme responsible for the second phosphorylation of PCV, and a variety of enzymes catalyze the third phosphorylation of PCV (10). Evidence suggesting that the second and third steps of phosphorylation are more rapid than the first phosphorylation of PCV by wild-type HSV1-TK has been reported (11). In this article, a mathematic model of the kinetics of 18F-FHBG in which the HSV1-sr39tk gene (driven by a constitutive promoter) has been delivered via adenovirus to mouse liver is presented. This model is in part based on the known biology of 18F-FHBG, PCV, and acyclic guanosine analogs. The parameter k3 from the 3-compartment model is compared with independent measures of gene expression; the percentage of metabolites predicted by the model is compared with those found using high-performance liquid chromatography (HPLC) analysis of liver tissue. Additionally, a method to obtain the plasma input function directly from the PET images is presented for 18F-FHBG.
MATERIALS AND METHODS
Theory
Model and Assumptions.
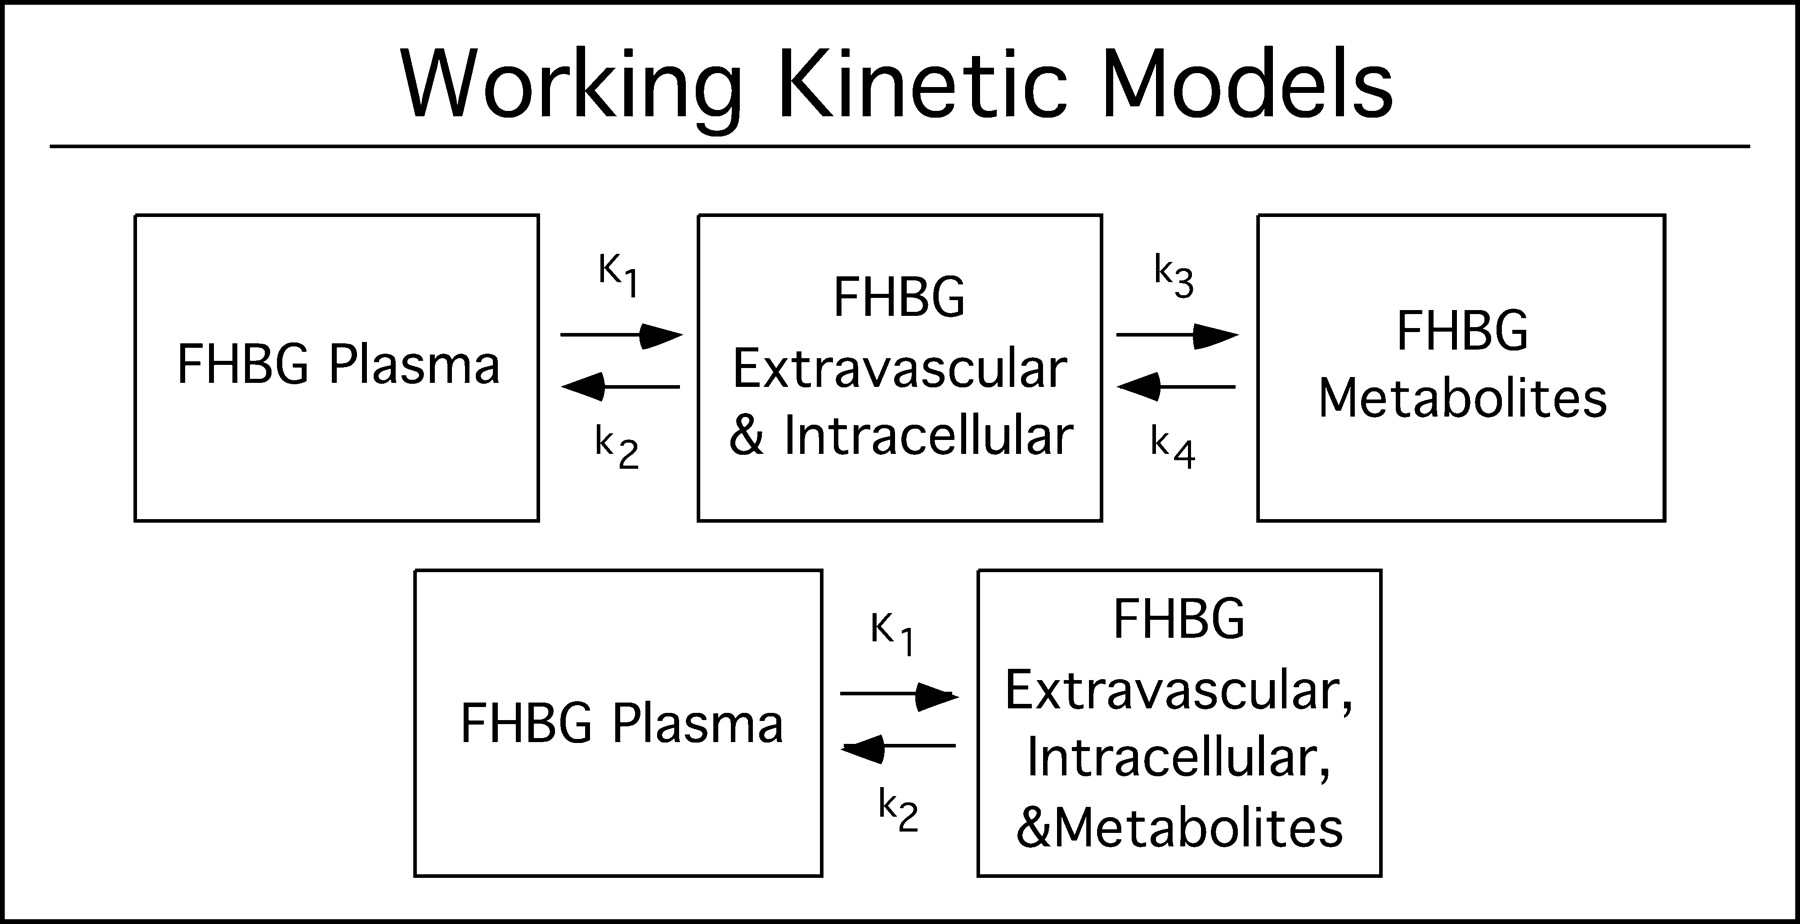
Figure 2 describes the 3-compartment model for the kinetics of 18F-FHBG in mouse liver expressing HSV1-sr39tk. The 3 compartments consist of 18F-FHBG in plasma, unmetabolized 18F-FHBG in tissue (extravascular and intravascular), and metabolized 18F-FHBG in tissue. The separation of the first 2 compartments represents membrane transport of 18F-FHBG. The separation between the second and third compartments represents the phosphorylation of 18F-FHBG. This model is analogous to the 3-compartment model for 18F-FDG (12). Also shown is the smaller 2-compartment model.

Working kinetic models. Top model describes pharmacokinetics of 18F-FHBG in tissues expressing HSV1-sr39tk gene. First compartment represents 18F-FHBG in plasma and middle compartment represents unmetabolized 18F-FHBG intracellularly. Third compartment represents metabolized 18F-FHBG that is trapped intracellularly. Parameters K1 and k2 are related to transport, and parameter k3 is related to phosphorylation. k4 is related to dephosphorylation rates. Bottom model describes behavior of 18F-FHBG in control mice. In second compartment, metabolites of 18F-FHBG are lumped together with the free form. In practice, k3 is zero due to absence of HSV1-sr39TK and, therefore, 18F-FHBG remains unmetabolized.
The present model assumes that phosphorylation of 18F-FHBG by endogenous thymidine kinase (TK1 and TK2) is negligible and that phosphorylated 18F-FHBG cannot directly exit out of the cell. Uptake is assumed not to be flow limited. 18F-FHBG is treated as a single probe, ignoring stereochemistry, by assuming that the rates of transport, metabolism, and clearance are equal for the R and S forms. Whole blood and plasma pools are lumped together, with plasma concentration a factor, which is defined here as EC, of that in whole blood. In addition, downstream phosphorylation of 18F-FHBG and incorporation into the DNA chain are lumped into 1 compartment as shown in Figure 2. Liver cells that express HSV1-sr39tk are lumped in with those that do not. 18F-FHBG or its metabolites are each assumed to be homogenously distributed in any given pool. The system is assumed to be linear and stationary with a linear transport rate constant between the pools.
Compartmental models are described by a system of ordinary linear differential equations and have been well studied. The solution to this system of equations is known and is the input function convolved with a sum of exponential functions (12). Pools are assumed to be well mixed.
Error Model.
Noise in the PET data is assumed to be a sum of noise from the counts plus other sources of noise, which include noise from organ motion, body motion, and reconstruction. The noise from the counts is Poisson distributed, and all other noises were lumped together and assumed to be much smaller than the noise from the counting statistics. The tissue time–activity curve was weighted by the inverse means, times scan length (13). Because the heart image time–activity curve well approximates the sampled left ventricle (LV) time–activity curve, the heart image time–activity curve was used as the input function to the models (with corrections for partial-volume effect and equilibration between whole blood and plasma).
Radiopharmaceuticals
18F-FHBG was synthesized as previously described (14) and typically has a specific activity of 185–370 GBq/μmol (5–10 Ci/μmol) and a radiochemical purity of >95%.
Gene Constructs and Adenovirus Vector
The mutant (HSV1-sr39tk) gene driven by the cytomegalovirus promoter and the control E1 deletion constructs have been made as described (2). The gene constructs have been inserted into an adenovirus vector as described (15). Adenovirus has been shown to preferentially infect the liver with peak infection occurring at ∼2–3 d after tail vein injection in mice.
Animal Care
All protocols were approved by the UCLA Animal Research Committee. A total of thirty 6- to 8-wk-old male Swiss–Webster mice (20–25 g) were studied. Four mice were used in the blood plasma equilibration study; 6 mice were used in comparing the sampled blood curve with the image curve (3 control mice and 3 mice at 2 × 10⁹ plaque-forming units [pfu] of HSV1-sr39tk adenovirus); 11 mice were used in the initial stages of modeling (2 control mice and 9 HSV1-sr39tk–positive mice), and 9 more mice (3 control mice and 6 HSV1-sr39tk–positive mice) were used for further validation of the model using HPLC. The total viral load was maintained at 2.0 × 10⁹ pfu by adding control (E1 deletion) virus as needed in all studies.
Equilibration of 18F-FHBG Between Whole Blood and Plasma
To show that 18F-FHBG equilibrates rapidly between whole blood and plasma, 4 control mice were tail-vein injected with 8.14–9.99 MBq (220–270 μCi) of FHBG. At 0.5 ± 0.1, 2 ± 0.3, 5 ± 0.1, and 10 ± 0.6 min after injection, 120 ± 29 μL were drawn into heparinized tubes from the LV of the heart by direct cardiac puncture with a 1-mL U-100 insulin syringe connected to a 28.5-gauge needle (16,17). Plasma and whole blood were separated by centrifuging at 1900 × g, and their weights were measured to the nearest 0.0001 g The samples were counted for radioactivity for 30 s in a cylinder-well counter (Cobra II Auto-Gamma; Packard) and corrected for instrument efficiency. The disintegrations per minute were converted to μCi, normalized by sample weight and injected dose (Dose calibrator-CRC-5R; Capintec) to obtain %ID/g. The ratio of 18F-FHBG concentration in plasma to concentration in whole blood, defined as EC, was measured.
Calibration of microPET
A calibration method similar to that of previously published work (17) was used to map between microPET image units, units of radioactive concentration, and well counts. A preweighed 30-mL cylindric bottle was filled with distilled water and 18F-FDG (∼5.55 MBq [∼150 μCi] as determined by the dose calibrator) and then weighed. From the sample weight and assuming a density of 1 g/mL, the concentration of radioactivity in the bottle in units of μCi/mL was calculated. The bottle was scanned dynamically on the microPET scanner for 8 min, 1 bed position. Fifteen planes were acquired in the transverse section and reconstructed with a Shepp–Logan filter with a cutoff of 0.5. No attenuation correction was performed for the microPET. A circular region of interest (ROI) (counts/pixel/s), encompassing ∼80%–90% of the cylinder volume, was drawn on the average of the middle 13 transverse planes.
After the microPET scan, 2 aliquots (∼0.025 mL each) of the solution were removed, weighed, and counted in a well counter to obtain well counts per gram per second (counts/g/s).
The calibration factor from scanner units to radioactivity concentration in μCi/mL was obtained by dividing the known radioactivity in the cylinder (μCi/mL) by the image ROI (counts/pixel/s). Conversion between scanner units and well counter units was obtained from a ratio of well counts/g/s to ROI.
Comparison of 18F-FHBG LV Time–Activity Curve with microPET Heart Image Time–Activity Curve
Two days after control adenovirus (E1 deletion) (n = 3) or adenovirus carrying the HSV1-sr39tk gene (1.0 × 10⁹ pfu) (n = 3) was injected into mice, 5.55–11.1 MBq (150–300 μCi) 18F-FHBG were injected into the mice and they were scanned in the microPET scanner. A partial-volume–corrected heart image time–activity curve was obtained for each mouse as described. The area under the curve (AUC) was calculated using the TRAPZ function from Interactive Data Language (RSI Inc.). Serial LV blood samples weighing 0.047 ± 0.004 g were obtained as described above (0.5, 1, 2, 3, 5, 10, and 20 min after injection and at the end of the scan). Their activity was counted in the well counter, and the units were converted to microPET scanner units per pixel per second using the calibration factor obtained as described (17,18). A modified AUC for the LV time–activity curve was calculated by including the first data point from the partial-volume–corrected heart image time–activity curve since the direct blood samples missed the first 0–30 s of activity. The LV time–activity curve and the heart image time–activity curve were compared for the least-squares recovery coefficient as described (17).
Mice for Modeling
Nine mice were injected with adenovirus carrying the HSV1-sr39tk gene (0.001–0.2 × 10⁹ pfu), and 2 mice were injected with the E1 deletion adenovirus. Estimates of image %ID/g, model parameters, and independent measures of gene expression were obtained and compared as described. An additional 9 mice (3 control mice, 6 mice at 5 × 10⁷ to 1 × 10⁸ pfu adenovirus with the HSV1-sr39tk gene) were studied for comparison of the model-predicted percentage of metabolite and the HPLC-measured percentage of metabolite.
microPET, ROI Analysis, and Partial-Volume Correction
Two days after the adenoviral infection, the mice were anesthetized intraperitoneally with ketamine/xylazine and 7.4–8.14 MBq (200–220 μCi) 18F-FHBG were injected into the mice via tail vein for the modeling studies. The mice were immediately dynamically scanned on the microPET scanner protoype built at UCLA (19), with the dynamic sequence 6 × 30 s, 4 × 1 min, 2 × 5 min, 2 × 10 min, and 1 × 20 min, for a total 57 min. Data were reported at the midpoint of the scan. All images were reconstructed with a Shepp–Logan filter with a cutoff of 0.5; no attenuation correction was performed.
ROIs (0.13 ± 0.016 cm2) were drawn on averaged transverse images of the left lobe of the liver at the last frame for the HSV1-sr39TK–positive mice and at frame 1 or frame 2 for the control mice. ROIs (0.067 ± 0.007 cm2) were drawn on averaged transverse images of the heart at frame 1 for all mice. These ROIs give, respectively, the tissue time–activity curve and the heart image time–activity curve used for model fitting. Time–activity curves of the heart were corrected for the partial-volume effect, based on geometry (17) and assuming a 1-dimensional bar phantom approximation and a resolution of 1.8 mm in each dimension (18). The 3-dimensional recovery coefficient obtained by multiplying all of these 1-dimensional recovery coefficients is 0.81.
Time–Activity Curve Fitting, Analysis, and Statistics
Two- and 3-compartment models were fit to the liver tissue time–activity curves, using weighted Levenberg–Marquardt nonlinear least-squares regression with the software package SIMPLE (20,21). The partial-volume–corrected heart image time–activity curves multiplied by EC gave the 18F-FHBG plasma input functions. The 3-compartment models with k4 allowed to float and fixed to zero were both studied. An estimated spillover fraction times the input function was added to all models. In all fitting procedures, the weights used were scan length divided by the observation (13). For each mouse, the model fits were compared with each other using an F statistic (22). P values < 0.05 were considered significant. Overall P values were calculated according to the Fisher method (23).
The macroparameters K1/k2 and K = K1k3/(k2 + k3) were calculated from microparameter estimates from the 3-compartment model. The noncompartment model parameter Ki was estimated by dividing liver uptake at the last scan by the area under the input function. The %ID/g liver tissue was estimated from liver uptake at the last scan as described (24). Linear regression between HSV1-sr39TK enzyme activity and each of K1 (mL/min/mg), k2 (min−1), k3 (min−1), k4 (min−1), K1/k2 (mL/mg), K (mL/min/mg), Ki (min−1), and %ID/g tissue was analyzed.
Independent Measures of Gene Expression
Immediately after the microPET scan, approximately 1 h after 18F-FHBG injection, the mice were sacrificed. Portions of the liver were removed and assayed for HSV1-sr39TK enzyme activity as described (24); additional portions were counted in a well counter and normalized by instrument efficiency, ID, and sample weight to obtain %ID/g liver. The liver samples were also assayed for reduced glyceraldehyde-phosphate dehydrogenase (GAPDH)–normalized HSV1-sr39tk messenger RNA (mRNA) (24). HSV1-sr39TK enzyme activity was used as the gold standard to which the kinetic model parameters were compared. The mRNA and HSV1-sr39TK enzyme activity were compared. Liver tissue from an additional 3 control mice and 6 HSV1-sr39tk–positive (5 × 10⁷–2.5 × 10⁸ pfu) mice was examined by HPLC analysis for validation of predicted percentage of metabolites. After scanning, the left lobe of the liver was dissected, treated with heat to denature residual TK activity, homogenized, and subjected to HPLC analysis. Furthermore, the image data were analyzed with ROI analysis and fit to 2- and 3-compartment models. Model parameters from the 3-compartment model and a heart image–derived input function were used to predict the mass in the second and third compartment. The input function was derived by extrapolating the last 3 data points of the heart image time–activity curve to 57 min and converting the curve to units of micromole (μmol) assuming a blood volume of 1.7 mL for each mouse. The mass in the third compartment at 57 min relative to the total amount in the second and third compartments at 57 min was taken as the predicted fraction of 18F-FHBG metabolites. For 2 mice that moved during the last frame of the dynamic scan, only data for the first 14 frames were used.
RESULTS
Equilibration of 18F-FHBG Between Whole Blood and Plasma
Within the first half minute after 18F-FHBG injection, the average ratio of probe plasma concentration to probe whole blood concentration was 0.84 ± 0.05. It remained close to this value, increasing slightly to 0.92 ± 0.16. A plot of ratios versus time in Figure 3 shows that within the first 2 min plasma and whole blood concentrations are similar. Averaging across time, all of the ratios for all of the mice gives 0.89 ± 0.13; therefore, the value of EC, the estimated equilibration correction factor of 18F-FHBG between whole blood and plasma, was set at 0.89.
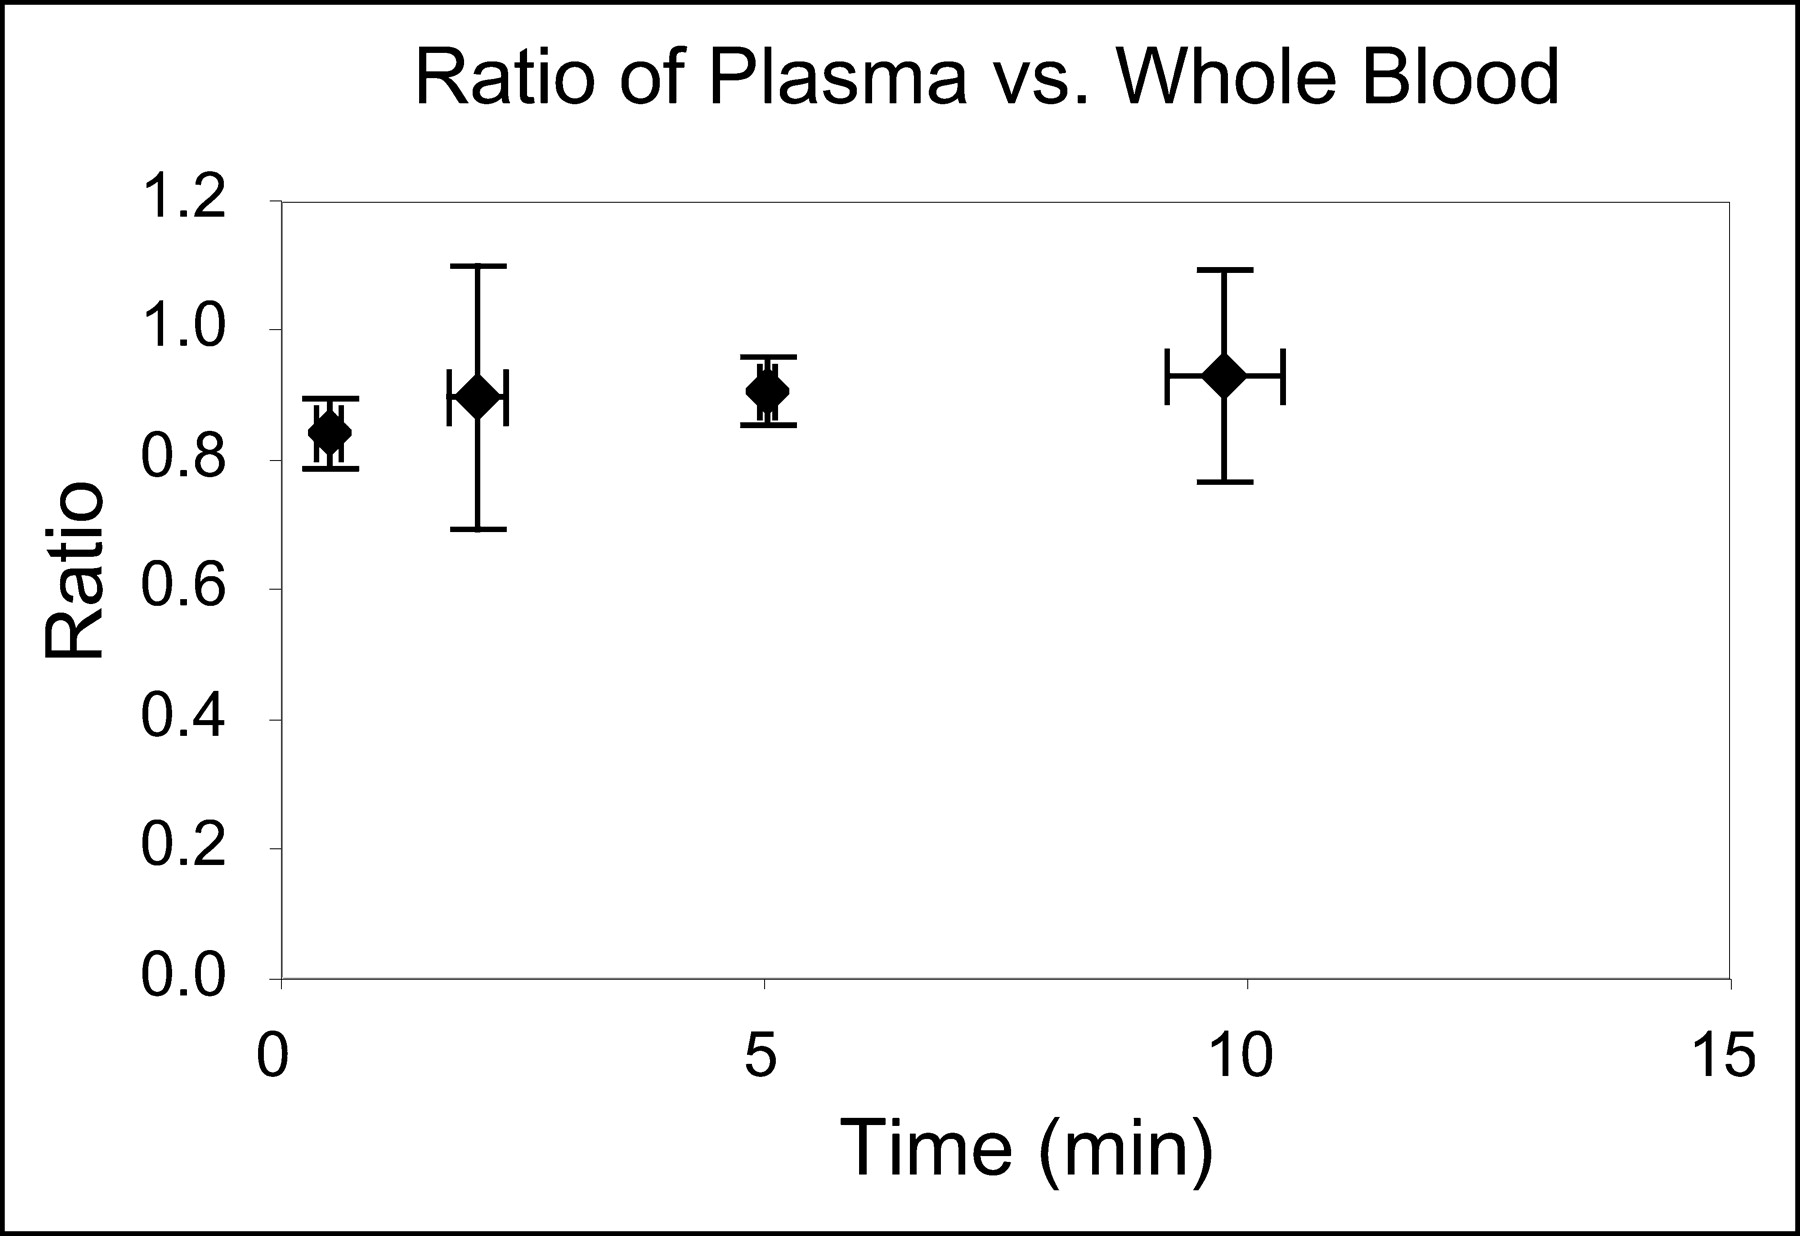
Ratio of 18F-FHBG in plasma vs. whole blood. 18F-FHBG was injected into tail vein of 4 Swiss–Webster mice and blood samples were taken. Concentration of 18F-FHBG in plasma and whole blood was determined, and ratio of 18F-FHBG concentration in plasma vs. whole blood as function of time is shown. Each point represents average of 4 mice.
Comparison of 18F-FHBG Heart Image Time—Activity Curve and Direct LV Sampling Blood Time—Activity Curve
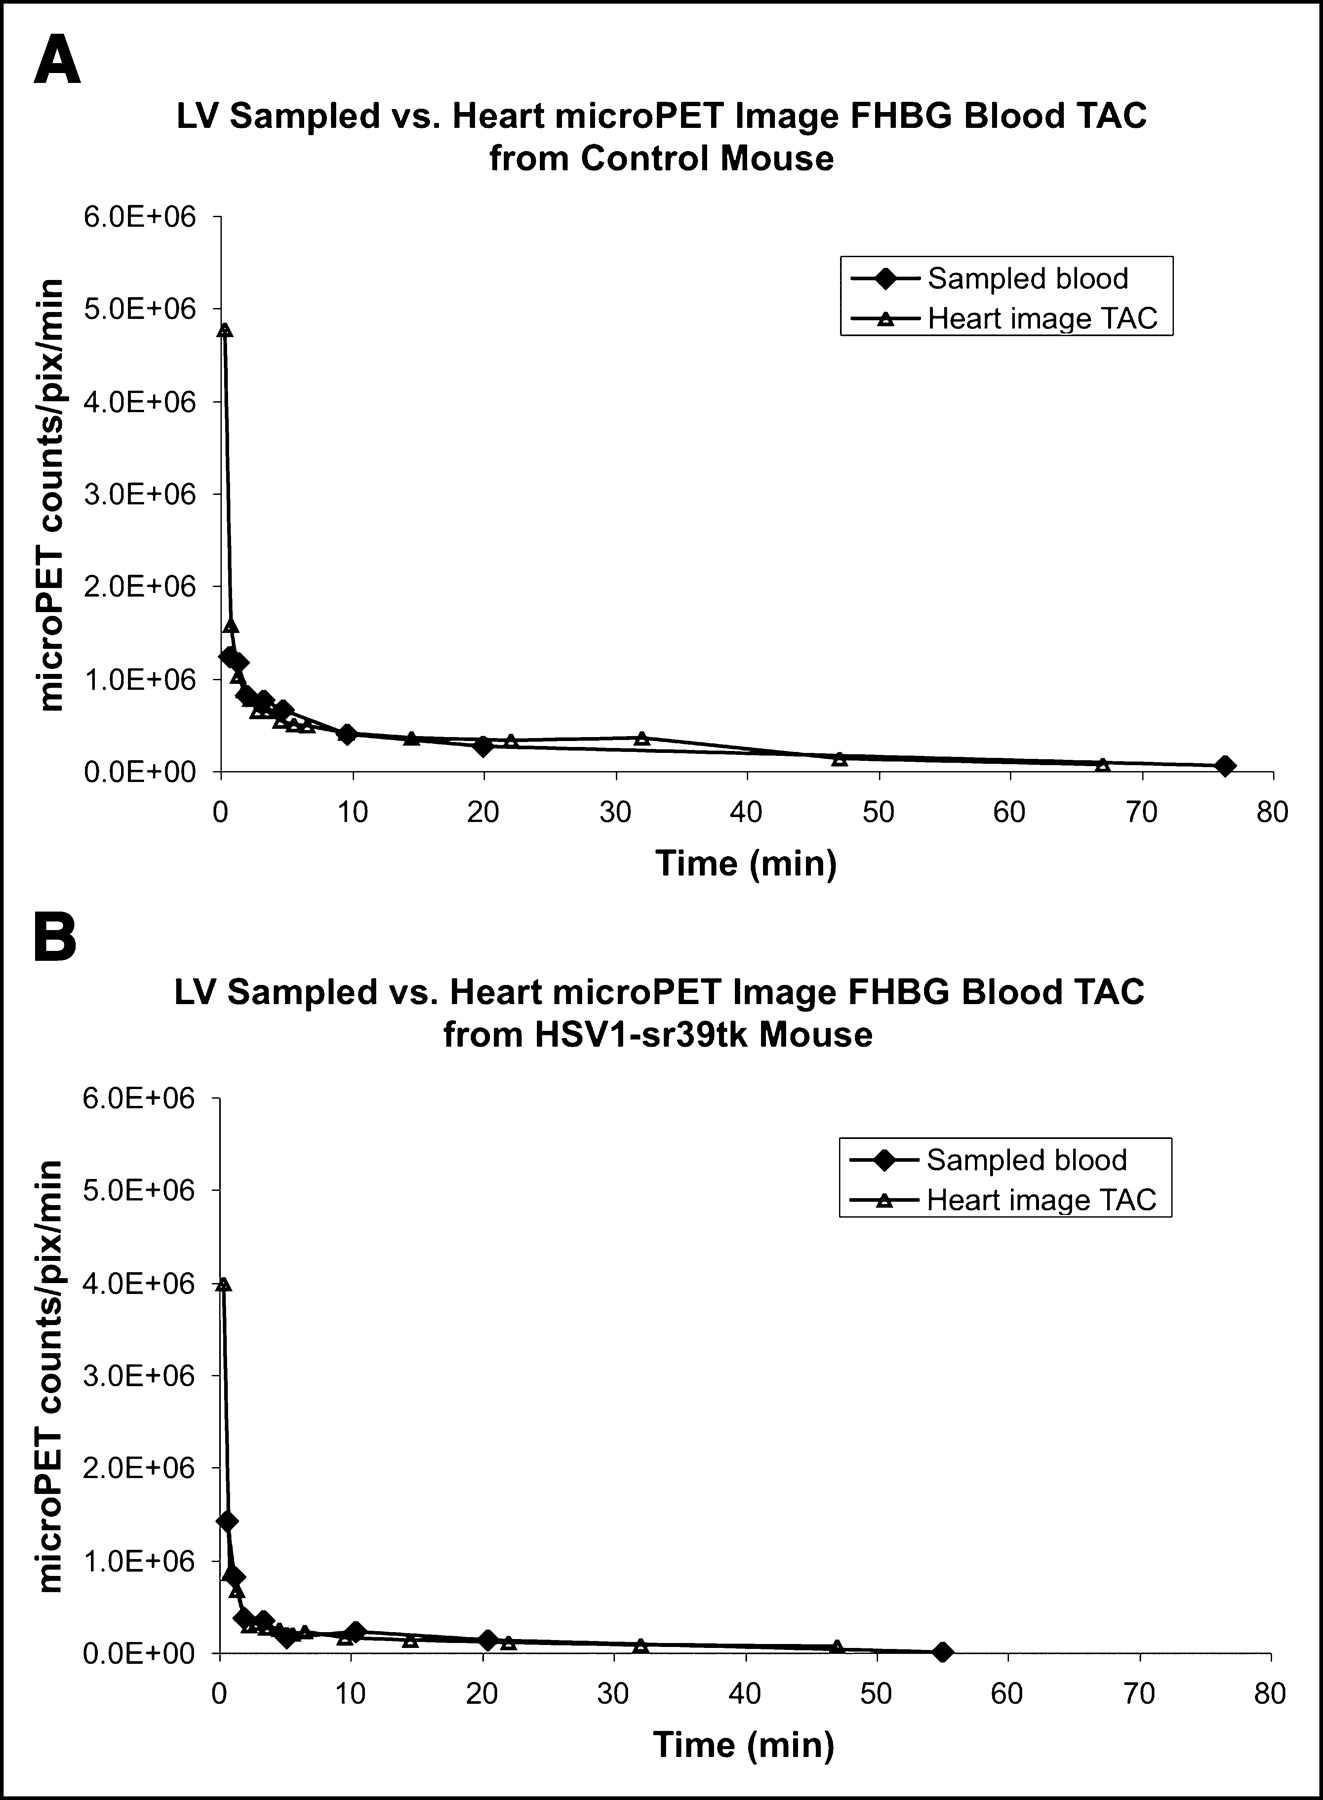
All 6 mice studied showed very close agreement by graphical inspection between the directly sampled LV time—activity curve and heart image time–activity curve corrected for partial-volume effect using the theoretic recovery coefficient of 0.81 (Fig. 4). The areas under the curves (AUCs) differed by an average magnitude (±SE) of 18% ± 9%. When the curves for all mice were then analyzed in a manner as described (17), the least-squares fit recovery coefficient was 0.83 ± 0.02, which is approximately equal to the theoretic value of 0.81.

18F-FHBG sampled LV blood time–activity curve was compared with partial-volume–corrected (0.81) heart microPET image blood time–activity curves. Units of LV sampled blood time–activity curve were calibrated to microPET to scanner units using calibration factor obtained from scanning a cylinder from microPET scanner (17). (A) Control mouse (scanned an additional 20-min frame). (B) Mouse infected with 1.0 × 10⁹ pfu of HSV1-sr39tk adenovirus. Both sets of curves show excellent agreement between sample LV blood time–activity curve and partial-volume–corrected heart image time–activity curve. TAC = time–activity curve; pix = pixel.
Data Analysis Results from 18F-FHBG Dynamic microPET Studies
The most parsimonious model for the control mice was the 2-compartment model (P < 0.05) (Fig. 5A). The 3-compartment model with k4 allowed to float greater than zero significantly fit the data better than the 2-compartment model for all mice expressing HSV1-sr39tk (Fig. 5B). F statistics for each HSV1-sr39TK–positive mouse were significant (P < 0.05), and the overall Fisher method was significant (P < 0.05). The 3-compartment model with k4 allowed to float greater than zero significantly fit the data better than the 3-compartment model with k4 fixed at zero for all but 1 of the positive mice. F statistics for each HSV1-sr39TK–positive mouse were in the range of F = 3.9–116. The overall P value was < 0.05, indicating that the model with k4 allowed to float significantly improves over holding k4 at zero. The F2,11 statistic is significant at α = 0.05 for F ≥ 4.8.
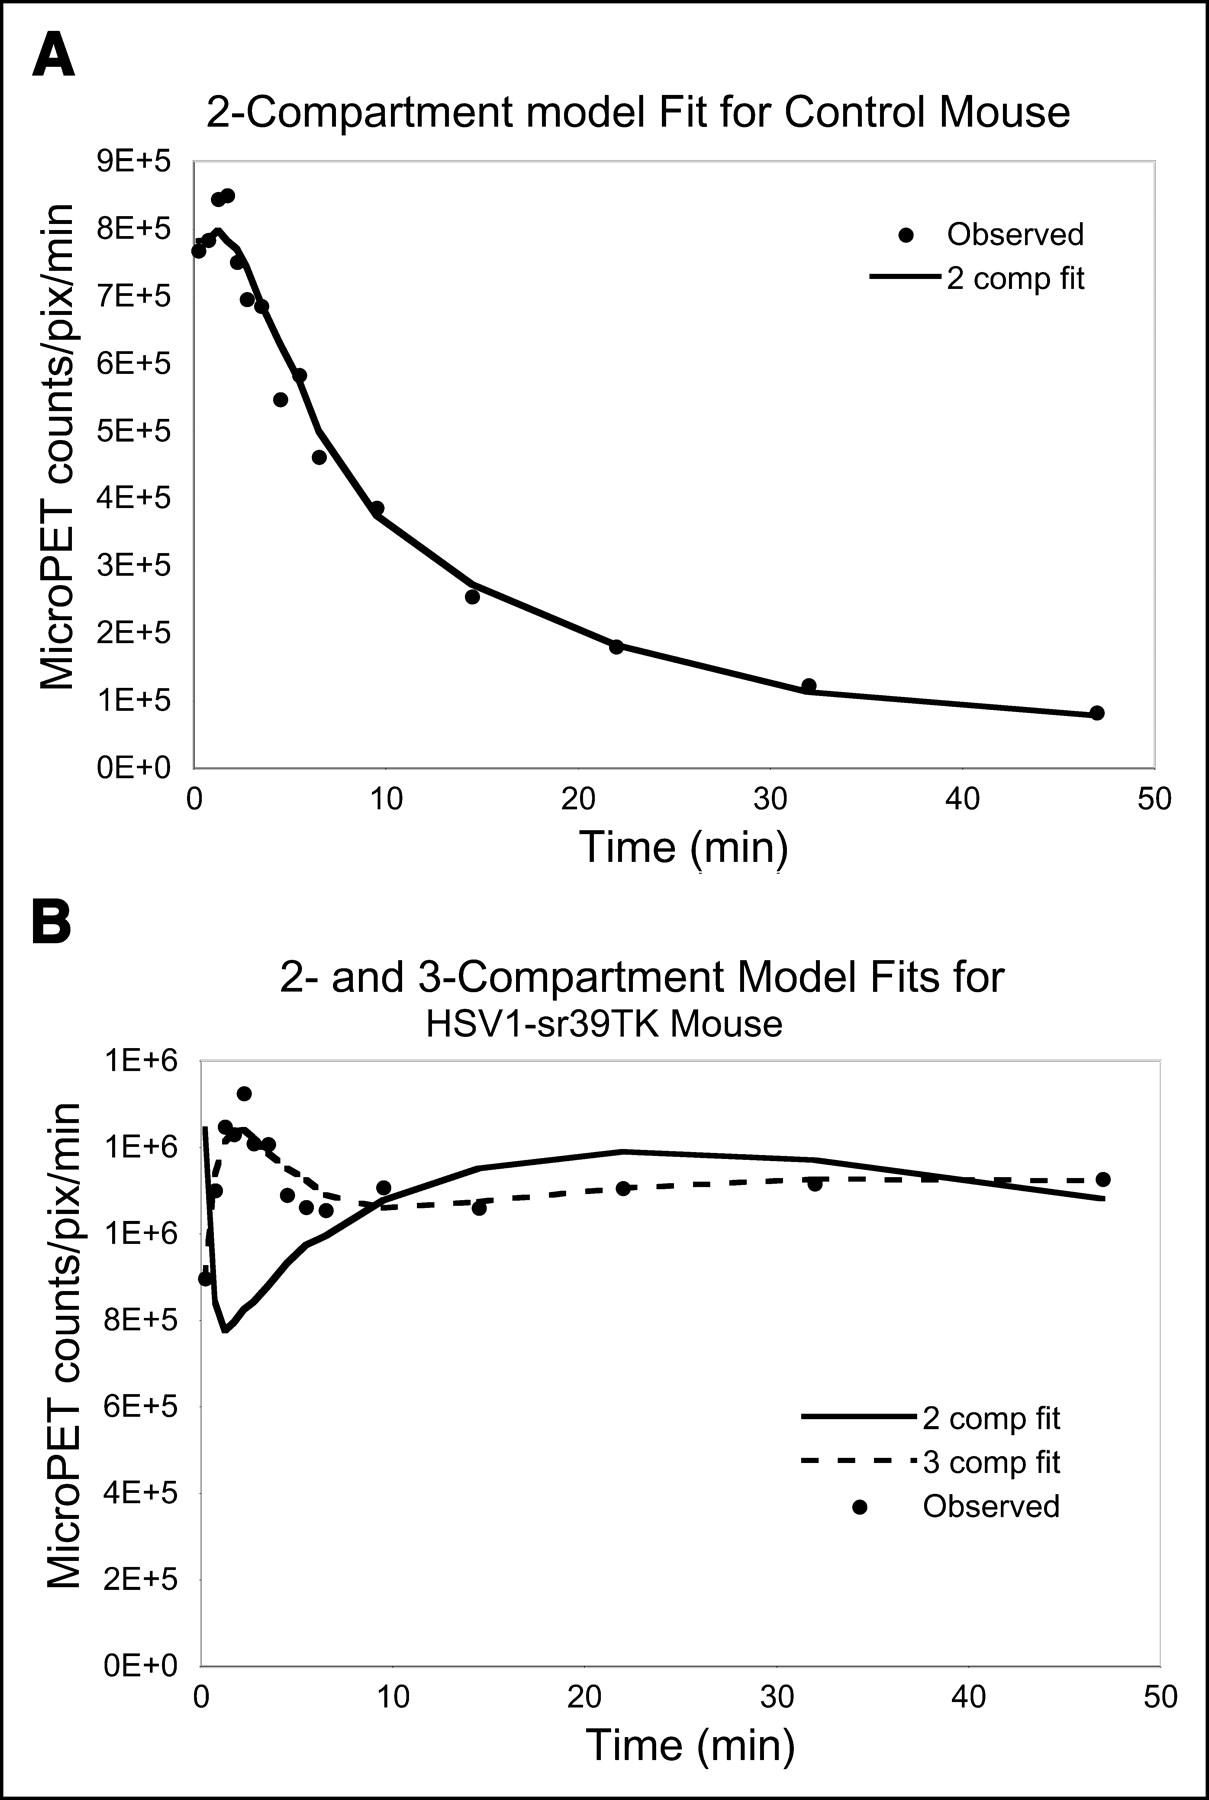
(A) Two-compartment model fit for control mouse, which was scanned dynamically using microPET with 18F-FHBG. Each point represents scanner counts per pixel per minute at indicated time, observed from ROI drawn on left lobe of liver. Two-compartment fit was the most parsimonious for control mice. (B) Example of 2- and 3-compartment model fits for representative HSV1-sr39TK–positive mouse, which was scanned with 18F-FHBG 2 d after injection of 1 × 10⁸ pfu of adenovirus carrying HSV1-sr39tk gene. Circles represent observed microPET data taken from ROIs drawn on left lobe of liver. Three-compartment fit clearly improves over 2-compartment fit (F = 136). comp = compartment; pix = pixel.
Comparison of Model Parameters with Independent Measures of Gene Expression
Table 1 provides a summary of parameter estimates from the full 3-compartment model for the 11 mice studied. Data from control mice are included for comparison. The next 9 rows are listed in ascending order of HSV1-sr39TK enzyme activity levels determined by assaying liver samples. The overall average ± SE estimates for the parameters from the 3-compartment model are K1 = 0.53 ± 0.14, k2 = 0.35 ± 0.11, k3 = 0.10 ± 0.10, k4 = 0.02 ± 0.01, spillover fraction (spill) = 0.15 ± 0.06.
Summary of Parameter Estimates for 3-Compartment Model Fits
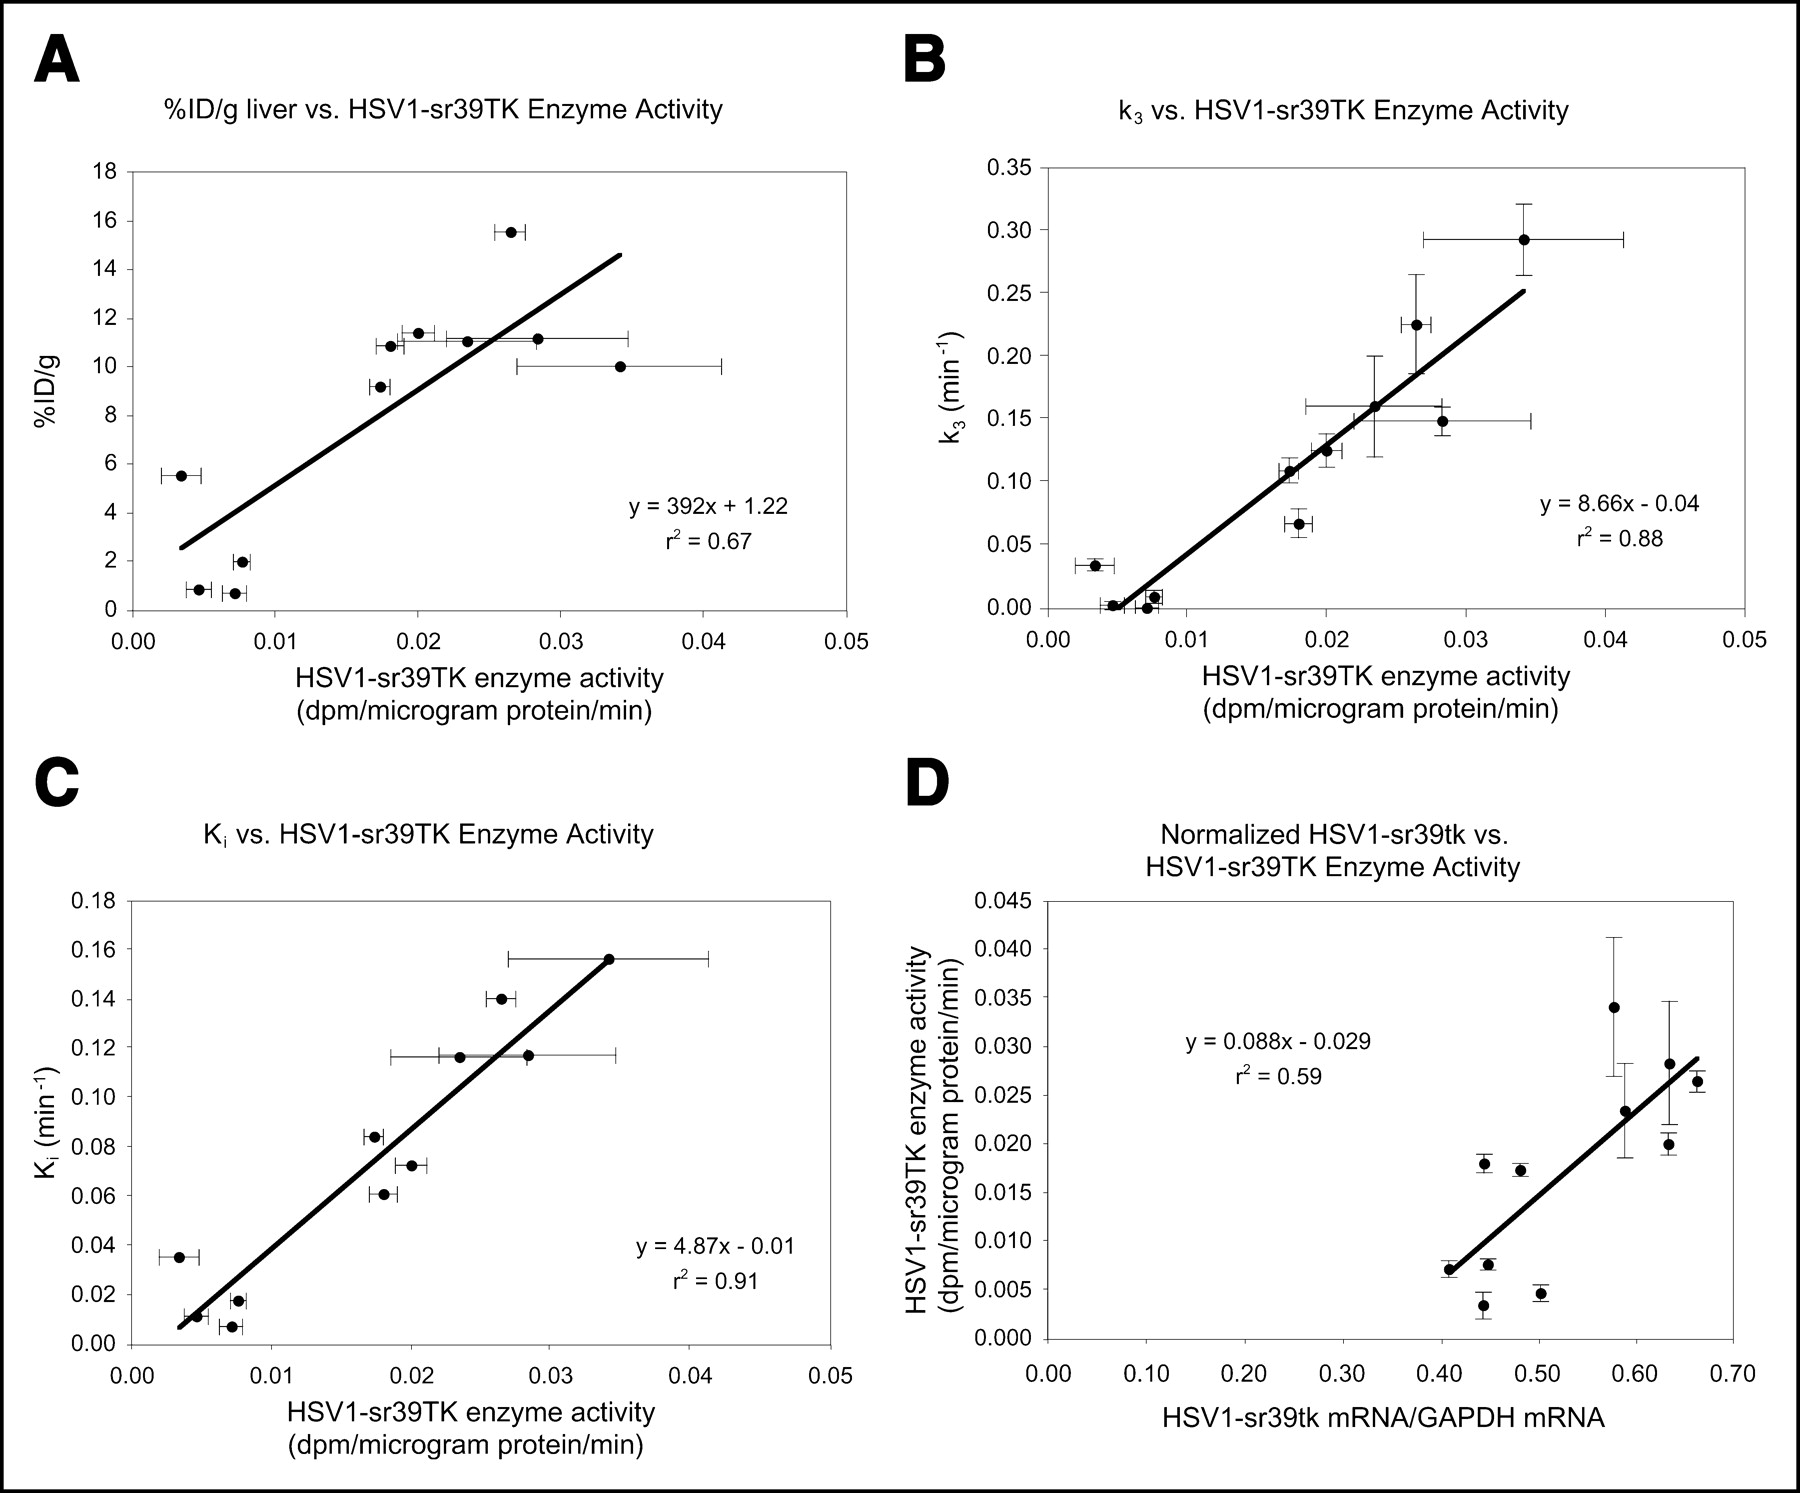
HSV1-sr39TK enzyme activity correlated only moderately (r2 = 0.67) with %ID/g liver (Fig. 6A). The parameter k3 correlated tightly with HSV1-sr39TK enzyme activity levels (r2 = 0.88) (Fig. 6B), as did K (r2 = 0.89; data not shown). HSV1-sr39TK enzyme activity also correlated well with Ki (r2 = 0.91) (Fig. 6C). Correlations between HSV1-sr39TK enzyme activity levels and K1 (r2 = 0.09), k2 (r2 = 0.003), k4 (r2 = 0.05), and K1/k2 (r2 = 0.1) were all very poor (data not shown). Normalized mRNA levels correlated moderately with HSV1-sr39TK enzyme activity (r2 = 0.59) (Fig. 6D).

(A) Correlation between %ID/g liver and HSV1-sr39TK enzyme activity. Each circle represents data from 1 mouse; %ID/g was obtained from images 1 h after probe injection. HSV1-sr39TK enzyme activity was obtained from liver tissue samples. (B) Correlation between k3 from 3-compartment model and HSV1-sr39TK enzyme activity. Each circle represents data from 1 mouse. (C) Correlation between Ki and HSV1-sr39TK enzyme activity. Each circle represents data from 1 mouse. Ki was obtained 1 h after probe injection. (D) Correlation between normalized mRNA and HSV1-sr39TK enzyme activity. Each circle represents data from 1 mouse.
Results from the comparisons of the relative percentages of intracellular metabolites of 18F-FHBG out of total 18F-FHBG metabolites and unphosphorylated 18F-FHBG are shown in Table 2. No significant difference was seen between the predicted and observed percentages (P > 0.8 using paired Student t test).
Comparison of Percentage of Metabolites Between HPLC Analysis and That Predicted by 3-Compartment Model
DISCUSSION
18F-FHBG was shown to equilibrate rapidly between mouse whole blood and plasma. The 2-compartment model fit the control data well, whereas the 3-compartment model fit the HSV1-sr39TK data significantly better. The estimate for the 3-compartment model parameter k3 was shown to have a better correlation with HSV1-sr39TK enzyme activity, an independent measure of gene expression, than did %ID/g liver. None of K1, k2, k4, or the spillover fraction correlated well with HSV1-sr39TK enzyme activity. Ki was also shown to correlate better with enzyme activity than did %ID/g liver. Enzyme activity is related to gene expression, which is precisely what gene imaging sets out to measure. This improvement in correlation helps to better measure gene expression. Furthermore, the fact that the percentage of metabolites can be accurately predicted by the model will be useful in obtaining this valuable information in cases in which this information is otherwise unobtainable, such as imaging gene therapy in humans. For example, in studies in which gene therapy is used to introduce a suicide gene, an investigator might not know why a study failed. Imaging in such a case, and predicting the percentage of intracellular metabolites, would help answer the question of how active the suicide gene is and help the investigator modify subsequent studies.
The rapid equilibration of 18F-FHBG is not surprising since there was no reason to believe that 18F-FHBG would be trapped inside blood cells. Note that for different probes or under different experimental conditions, this may be different. Also note that the earliest sampled time point was 30 s after injection and it may be that within the first few seconds, the ratio is actually much smaller; however, due to technical considerations of sampling immediately after injection, it is difficult to sample much earlier than 30 s. We also observed rapid clearance of 18F-FHBG from the blood pool, which is consistent with rapid clearance seen for 8-18F-fluoropenciclovir and 8-18F-fluoroganciclovir (24).
Stability of a reporter probe in vivo is an important consideration in PET and modeling. The reporter probe should not be significantly degraded in vivo during the time required for imaging. Analysis of plasma samples from 3 Swiss–Webster mice 10 min after injection reveals >95% ± 1% of the injected activity to be in the parent form (unpublished data). Because 18F-FHBG clears rapidly from plasma, there is insufficient radioactivity to analyze the plasma samples for metabolites by HPLC at late times. However, HPLC analysis of urine samples from 3 Swiss–Webster mice 180 min after injection of 18F-FHBG indicates that >92% ± 1% of the activity is present in the form of the parent substrate. In urine analysis from human studies, 3 h after 18F-FHBG injection, 83% of the radioactivity observed was intact 18F-FHBG (14). These results confirm the stability of 18F-FHBG in vivo.
In calculating the AUC for the LV time–activity curve, an initial point was inserted to approximate peak activity. Logistically, it is very difficult to sample <30 s after injection because it takes time to withdraw the 18F-FHBG injection needle from the tail and then insert the new needle into the LV. Modifying the LV time–activity curve would potentially cause the heart image time–activity curve and LV time–activity curve to have even better agreement between AUCs. Therefore, as an additional comparison of the time–activity curves, the best least-squares recovery coefficient was obtained as described (17) and found very close to the geometric value. LV puncture may result in some blood being introduced into the pericardial space, which would result in overestimation of the image cardiac activity; however, we found close agreement between the LV time–activity curve and the heart image time–activity curve, suggesting that this was a minimal effect. The heart image time–activity curves (corrected for partial-volume effect and equilibration between whole blood and plasma) were thus used as input functions in the model fitting, rather than directly sampling blood time–activity curves for each mouse.
For each fit, it was assumed that the input function was known without error. The effect of this assumption has been explored in other studies (25). Propagation of noise in the input function should be considered in future studies.
The image-obtained %ID/g in the liver region was obtained by ROI analysis and compared with direct tissue samples through the use of calibrating the nonattenuation–corrected microPET image of a small cylinder filled with 18F-FDG. The correlation had an r2 = 0.97 (data not shown), suggesting that there was no need to correct the image for attenuation because the calibration factor included this correction within it.
The improvements of k3 and Ki over %ID/g suggest that the input function better normalizes for differences between experiments than does injected dose. The estimates of gene expression using Ki or k3 were nearly equally successful. This may be because K1 and k2, the parameters related to transport of the probe, remain fairly constant between these mice. We did not expect nor observe differences in transport since the studies were all done under similar conditions. Given constant K1 and k2, and after controlling for input function, k3 and Ki represent similar measurements. If other tissues (e.g., tumors) are studied, K1 and k2 may differ across mice, and then the power of separating out k3 from the other parameters will likely be even more dramatic. Another study (26) also found better correlations between independent measures of gene expression (toxicity to GCV) with Ki (R = 0.97) than %ID/g tissue (R = 0.65) when using 124I-FIAU as a reporter probe for PET. Although that study did not use formal compartmental modeling, the noncompartmental approach further confirmed the need to control for input function—obtained, in that case, using repeated venous blood sampling.
The comparison of the model-predicted percentage of metabolites agrees well with the HPLC analysis; however, 1 mouse showed discordance between the 2 measures, with the model underestimating the percentage of metabolites. The discrepancy could possibly be caused by the presence of some active enzyme surviving heat inactivation, which could lead to continued phosphorylation of 18F-FHBG in vitro after the dissection of the liver tissue. This may require further investigation.
The model ignores phosphorylation by endogenous TK due to the high inhibition constant (>250 μmol/L) for PCV in competition with thymidine for mammalian TK (27). This assumption is further validated by the fact that repeated studies have shown that many cell types uninfected with herpes virus or not expressing the HSV1-tk gene do not significantly accumulate PCV. Ideally, the Michaelis–Menten constant (Km) for 18F-FHBG for each of the different enzymes, mammalian TK1 and TK2, as well as HSV1-TK wild-type and HSV1-sr39TK would be known.
Phosphorylated 18F-FHBG is trapped intracellularly due to the inability of the charged phosphate to cross the cell membrane; therefore, phosphorylated 18F-FHBG is assumed to be trapped.
The model assumed that uptake is not flow limited. A comparison between K1 and hepatic blood flow in the mouse would be useful for determining the validity of this assumption. It is therefore worthwhile to investigate further the blood flow in the mouse liver. Given that k3 correlated well with active enzyme activity, it is likely that, in these studies, blood flow did not limit uptake.
18F-FHBG is a chiral molecule that, in the current synthesis, is prepared as a racemic mixture. Imaging with 18F-FHBG is thus imaging with 2 probes simultaneously. The rates of flux between the respective compartments for each enantiomer may differ depending on their respective Vmax/Km (Vmax = maximum velocity) of the transporters and enzymes. If neither these rates nor blood clearance differs, then the enantiomers can be modeled as one species. Data with 18F-FHPG suggest that the enantiomers are equivalently phosphorylated (28). There is evidence, however, that GCV and PCV are preferentially phosphorylated by HSV1-TK in the S form (29,30). Whether 18F-FHBG behaves more like 18F-FHPG or PCV is unknown; we modeled the mouse microPET data assuming the former. Further studies in which racemically pure 18F-FHBG is used should clarify these issues.
The ratio of 18F-FHBG in plasma to 18F-FHBG in whole blood, EC, has been estimated experimentally. Estimates of EC may be different for other probes or under different experimental conditions. EC may also be a function of time, although we assumed it was not.
PCV accumulates in the triphosphate or diphosphate form in extracts from HSV-1–infected cells (11,31); penciclovir monophosphate comprised a minimal ∼2% of the total penciclovir phosphate formed. Similarly, we have shown that HPLC peaks corresponding to di- and triphosphorylation of 8-18F-fluoro-GCV increased with time (24). The rapid phosphorylation observed suggests rapid downstream metabolism and supports the assumption of lumping the phosphorylated pools into one.
Lumping virus-infected and uninfected liver cells together is more of a practical assumption due to the inability to image a single cell, and the effect of it is, essentially, to dilute the signal. These effects are being investigated with simulation studies.
Although the transport of the probe into the cell and phosphorylation by HSV1-TK are nonlinear processes, only a trace amount of 18F-FHBG is added. When a substrate is present in trace amounts with respect to Km, the rate of its reaction with the enzyme is approximately linear (4,32). Now, it remains to be shown that 18F-FHBG is present in trace amounts in plasma and intracellularly. Because Km values for 18F-FHBG transport and phosphorylation are unknown, assumptions here have to be made by looking at the Km values of transport and phosphorylation for similar substrates—for example, GCV. The Km for GCV for the nucleobase and nucleoside transporters in the human erythrocyte are 0.89 and 14 mmol/L, respectively (8). The approximate maximum concentration of 18F-FHBG in blood is:

assuming a lower bound on the specific activity, 185 GBq/μmol (5 Ci/μmol) and that the entire 11.1 MBq (300 μCi) (upper bound) dose enters 2 mL (upper bound) of blood (33). Assuming the Km for 18F-FHBG transport is on the same order as that of GCV, the transport rate should be linear because the maximum concentration of 18F-FHBG in blood is several orders of magnitude lower than the Km for GCV transport. This is consistent with observations (34) that the rate of phosphorylation of PCV in MRC-5 cells infected with HSV1 was not limited by uptake into the cells.
It remains to be shown that 18F-FHBG is present in trace amounts in the liver. The maximum %ID/g liver observed at any time point in microPET dynamic time–activity curves is on the order of 20%. This signal is a sum of all forms (e.g., parent 18F-FHBG, phosphorylated metabolites) to which the radiolabel may be attached. In addition, it also includes any 18F that may have dissociated. The value of 20 %ID/g liver is thus an overestimate of what would be the maximum amount of unphosphorylated 18F-FHBG found in the liver cells. The 20 %ID/g liver corresponds to an upper bound on the concentration of 18F-FHBG of 0.012 μmol/L, assuming a density of 1 g/cm3 of liver tissue and a specific activity of 185 GBq/μmol (5 Ci/μmol) in a dose of 11.1 MBq (300 μCi) (32).
Since 0.012 μmol/L is <2% of the inhibition constant of PCV for the HSV1-TK, 1.5 μmol/L (27), the assumption that the unphosphorylated 18F-FHBG is in trace amounts in the liver holds. The Km for racemic 18F-FHBG for wild-type HSV1-TK has recently been estimated to be 0.94 μmol/L (Drs. R. Keen and J.R. Barrio, unpublished data, 2000), which is approximately 80 times the upper bound for the concentration of unphosphorylated 18F-FHBG; therefore, intracellular 18F-FHBG is in trace amounts.
The 3-compartment model with parameter k4 allowed to float was found to be significantly better than the model with k4 fixed to zero. This suggests dephosphorylation of 18F-FHBG metabolites that may be due to native phosphatase activity in the cell. Extensive review of the literature does not indicate any phosphatases that have been shown to dephosphorylate acyclic guanosine analog pharmaceuticals; however, it is well known that there are many cellular phosphatases, and potentially any of the nucleotide phosphatases could account for the reduction in trapped 18F-FHBG suggested by positive k4. The larger model with a leak (k5) out of the third compartment was also studied but was found to be numerically unstable (the SEs of the k5 were up to 8-fold greater than the estimate itself) and uninformative biologically (estimates of k3 did not correlate well [r2 = 0.2] with HSV1-sr39TK enzyme activity level) (32). This suggests that the current full 3-compartment model with the spillover fraction is the most parsimonious and practical model for the system at hand.
In this study, the F test comparing progressively larger compartment models was used to ascertain the optimal number of exponentials. Another approach to determining the number of exponentials that the data will support is spectral analysis (35).
de Vries et al. (6) have presented preliminary results for a tracer kinetic model for 18F-FHPG. They injected varying mixtures of C6 control and C6 HSV1-TK–positive rat glioma cells into a nude rat and imaged dynamically with 18F-FHPG PET 10 d later for 2 h. The standardized uptake value correlated well with the fraction of HSV1-TK–positive cells (r2 = 0.92). The parameter k3 from the 3-compartment model also correlated well (r2 = 0.907), whereas K1 and k2 were independent of the percentage of HSV1-TK cells. The K1 ranged from 0.288 to 0.324 and the k2 ranged from 0.269 to 0.374 (E. de Vries, written communication, 2003). These are slightly lower than the averages we obtained for the K1 and the k2 for the 18F-FHBG 3-compartment model, which may suggest that the transport of 18F-FHBG is faster in mouse liver cells than the transport of 18F-FHPG in rat glioma cells. de Vries et al. (6) considered dephosphorylation negligible and did not attempt to model k4.
The average spillover fraction, which represents the fraction of blood volume in the signal from an ROI drawn on the liver image, was approximately 15%. This is lower than the estimated blood volume of the liver, which is 31% (36). It may be that blood flow to the liver is reduced under the anesthetic condition used or that the Swiss–Webster mice used in this study have a smaller percentage of blood volume in the liver than the strain of mice used in other reports (36). Future studies with more mice will need to determine if the spillover fraction is lower under the current experimental conditions and if it may be strain or anesthesia related.
Portal circulation was ignored, meaning the LV input function was assumed to be what the liver tissue really sees. Future studies should explore this further in attempts to model the delay and dispersion of the input function the liver sees relative to the LV.
Thymidine is the natural substrate of HSV1-TK. Hughes et al. (37) estimated mouse blood serum concentration of thymidine to be 1.1 μmol/L and indicated that sex appeared not to have an effect on thymidine concentration, whereas strain had a slight effect and age had a larger effect, with older mice showing higher levels. Nottebrock and Then (38) estimated mean serum concentrations of thymidine to be 0.16 μg/mL in mice and 0.146–0.246 μg/mL in rats. They also found the thymidine content in rat liver to be 0.05 μg of thymidine per gram of tissue. In addition, the authors found that viral and bacterial infection may affect the serum concentration of thymidine relative to that of uninfected animals.
Although the thymidine concentration may be higher in rodents than it is in humans (mean thymidine concentration in human sera is 0.36 μmol/L (39)), as long as 18F-FHBG is present in trace concentration and the concentration of thymidine is constant, 18F-FHBG can still be treated as having linear metabolism (32). However, if the thymidine concentrations between mice are different in this study, that may have an effect on estimates of k3. This effect has been explored with simulation studies (32). Because all of these mice are of the same strain and conditions such as viral load and age were constant, it may be reasonable to assume constant thymidine concentration across the mice here. Because such a tight correlation was observed between k3 and enzyme activity, this further suggests that the assumption of stable thymidine concentration may be reasonable. Future studies will benefit from direct measurements of mouse plasma thymidine concentration.
In the future, this model can be used to generate parametric images with k3 estimating reporter protein activity, similar to representing glucose metabolism with parametric images of 18F-FDG.
The model parameter estimate k3 and Ki for 18F-FHBG kinetics have been shown to be predictive of reporter protein activity; however, there are a series of intermediate steps between expression of the reporter gene and the function of the final protein product. Furthermore, if the reporter gene is intended to convey information about yet another gene that may be driven by the same promoter either connected on the same transcript through an internal ribosomal entry site (1,40) or on a separate strand of DNA, then additional modeling will be required to translate from reporter protein image signal all the way back to protein function of the gene of interest. These investigations are the next steps in unraveling the complex correlation throughout the cascade of events from mapping reporter gene to functional gene product of interest.
CONCLUSION
18F-FHBG rapidly equilibrates between whole blood and plasma, and heart image time–activity curves corrected for the minor equilibration delay and partial-volume effect well approximate the LV directly sampled time–activity curves. These time–activity curves therefore can be used as input functions into compartment models. HSV1-sr39tk gene expression estimated from normalized mRNA levels is moderately correlated with enzyme activity. The most parsimonious model for 18F-FHBG in control tissue is the 2-compartment model. The 3-compartment model with 5 parameters (K1, k2, k3, k4, spillover) best describes 18F-FHBG kinetics in tissues expressing HSV1-sr39tk. The parameter k3 from that model correlates well with the independent measure of gene expression, the HSV1-sr39TK enzyme activity. Ki also correlates well with enzyme activity. Estimates for the k3 parameter for the 3-compartment model for 18F-FHBG can be used as estimates for HSV1-sr39TK reporter gene product activity and indirectly for reporter gene expression. 18F-FHBG will therefore hopefully be extremely valuable in quantitative imaging of HSV1-sr39tk reporter gene activity.
Acknowledgments
The authors thank Ron Sumida, Judy Edwards, Waldemar Ladno, DerJenn Liu, Victor Dominguez, Arion Chatziioannou, and Randy Keen for technical support and expert advice. The authors are grateful for administrative and secretarial assistance from Diane Martin, Theresa Sama, Debra Williams, Michelle Chen, Dan Levitt, Linda Stolt, Ross Tesoro, Valerie Cachola, Jacob Kuo, Yun-Lan Chan, Cammy Chen, Eileen Co, David Na, Ti Lee, Marcie Heit, Jennifer Lin, Alejandro Ibarra, and Lalita Singhasri. This work was partially supported by funding from Department of Energy contract DE-FC03-87ER60615; University of California Biotechnology Grant; University of California Los Angeles–Jonsson Comprehensive Cancer Center; Dana Foundation; National Institutes of Health (NIH) grant R01-CA-82214-01; and NIH training grant GM08185-9. Parts of this work were presented at the 47th Annual Meeting of the Society of Nuclear Medicine, St. Louis, Missouri, June 3–7, 2000.
Footnotes
Received Mar. 24, 2004; revision accepted May 20, 2004.
For correspondence contact: Sanjiv S. Gambhir, MD, PhD, Stanford University, The James H. Clark Center, 318 Campus Dr., East wing, First floor, E150A, Stanford, CA 94305-5427.
E-mail: sgambhir{at}stanford.edu
REFERENCES
In this issue


Jump to section
Related Articles
Cited By...
- Deconvolution of Plasma Pharmacokinetics from Dynamic Heart Imaging Data Obtained by Single Positron Emission Computed Tomography/Computed Tomography Imaging
- Deconvolution of plasma pharmacokinetics from dynamic heart imaging data obtained by SPECT/CT imaging
- Molecular Imaging with Reporter Genes: Has Its Promise Been Delivered?
- Biodistribution and Targeting of Anti-5T4 Antibody-Drug Conjugate Using Fluorescence Molecular Tomography
- Small-Animal SPECT and SPECT/CT: Important Tools for Preclinical Investigation
- In Vivo Quantitation of Glucose Metabolism in Mice Using Small-Animal PET and a Microfluidic Device