


Abstract
Assessing the baseline perfusion and perfusion reserve after acetazolamide (ACZ) challenge is a common method for the evaluation of patients with cerebrovascular disease. Most previous studies using H215O PET applied the bolus injection technique. There is considerable discrepancy regarding the optimal time point of imaging after ACZ injection. The purpose of this study was to continuously monitor cerebral blood flow (CBF) after ACZ using constant-infusion H215O PET. Methods: Four patients with stenoses of an internal carotid artery and 6 with moyamoya disease were studied. H215O was continuously infused, and data were recorded in 1-min frames. After equilibration of H215O, 5 min of baseline data were acquired, and then 1 g of ACZ was administered intravenously and data collection continued for 10–22 min. Arterial blood was continuously drawn for absolute quantification of CBF. Results: The arterial 15O concentration remained generally stable during scanning, and the cerebellar blood flow fluctuations of the 5 baseline scans were small. The scan-to-scan difference was 6% (difference of 2 successive scans/mean). In the nonpathologic areas, the increase in CBF started 1–2 min after administration of ACZ. The largest fraction of the increase occurred from 0 to 10 min. The ratio of CBF in pathologic areas to CBF in cerebellum showed an initial decrease that stabilized after 5 min. Conclusion: A continuous-infusion protocol is a viable alternative to single bolus injections for the assessment of cerebral perfusion status. Such a protocol is advantageous when the time course of CBF after an intervention is not known. With continuous monitoring, the optimal time point for evaluation of a certain parameter can be chosen post hoc. Furthermore, the time course of CBF itself may allow the definition of new parameters for evaluating perfusion status in cerebrovascular patients, both for assessment before a revascularization procedure and for follow-up. A limitation of the present study is the relatively small number of patients with each type of cerebrovascular disease and the lack of healthy subjects.
Acetazolamide (ACZ) challenge is commonly used to assess perfusion status in patients with cerebrovascular disease (1,2). The increase in cerebral blood flow (CBF) after ACZ is often referred to as the perfusion reserve (PR) and is one of the important parameters for assessing perfusion status. In normal gray matter, the ACZ-induced increase in CBF is on the order of 30%–40% (3,4). A decreased PR indicates compromised perfusion. According to the literature, CBF demonstrates a typical response to ACZ. However, there exists a discrepancy with regard to the optimal time point of imaging. Published studies have found that after a rapid increase, a maximum should be reached between 10 and 25 min (5,6) and is followed by a prolonged plateau of more than 30 min (5). These findings suggest that imaging should be performed during that plateau phase. However, Kuwabara et al. found that imaging 5 min after ACZ is superior if a potential early steal phenomenon is not to be missed (7). They also reported that imaging at 5 min is preferable for assessing preoperative CBF changes in patients with occlusive cerebrovascular disease (8). To circumvent this problem of determining the optimal time point, we used constant-infusion H215O PET to continuously monitor the time course of CBF after ACZ in 4 patients with an internal carotid artery stenosis and 6 with moyamoya disease. The name for this disease was coined by Suzuki. It is characterized by abnormal vascular networks at the base of the brain. Moyamoya means “something hazy just like a puff of cigarette smoke drifting in the air” (9). The abnormal vessels are thought to function as collaterals in the presence of stenotic or occlusive lesions at the ends of the internal carotid arteries. The clinical hallmarks of the disease depend on age. Younger patients most often suffer from the consequences of hemodynamic insufficiency, such as transient ischemic attacks. Typically, blood flow is most compromised in the cerebral hemispheres, whereas the cerebellum and the deeper structures are spared.
MATERIALS AND METHODS
Model of Regional H215O Kinetics
The model was described in detail previously (10). The underlying model consists of a single compartment for the description of the tracer kinetics. The differential equation for the tissue concentration Ctiss is as follows:
 Eq. 1 where Ca is the tracer concentration in arterial plasma, p is the partition coefficient, and λ is the decay constant for 15O (0.376 min−1). The first term on the right describes the net influx of H215O due to CBF. Because Ctiss denotes the radioactivity concentration per milliliter of tissue but only the fraction p of this volume is actually perfused, the true concentration of 15O in permeated space is Ctiss/p. The venous efflux is assumed also to have the concentration Ctiss/p. The second term is the loss of radioactivity due to physical decay. At equilibrium, the change per unit time is zero and Equation 1 yields the following relationship:
 Eq. 2 or, rearranged,
 Eq. 3 Solving for CBF yields:
 Eq. 4 where α=Ctiss/Ca.
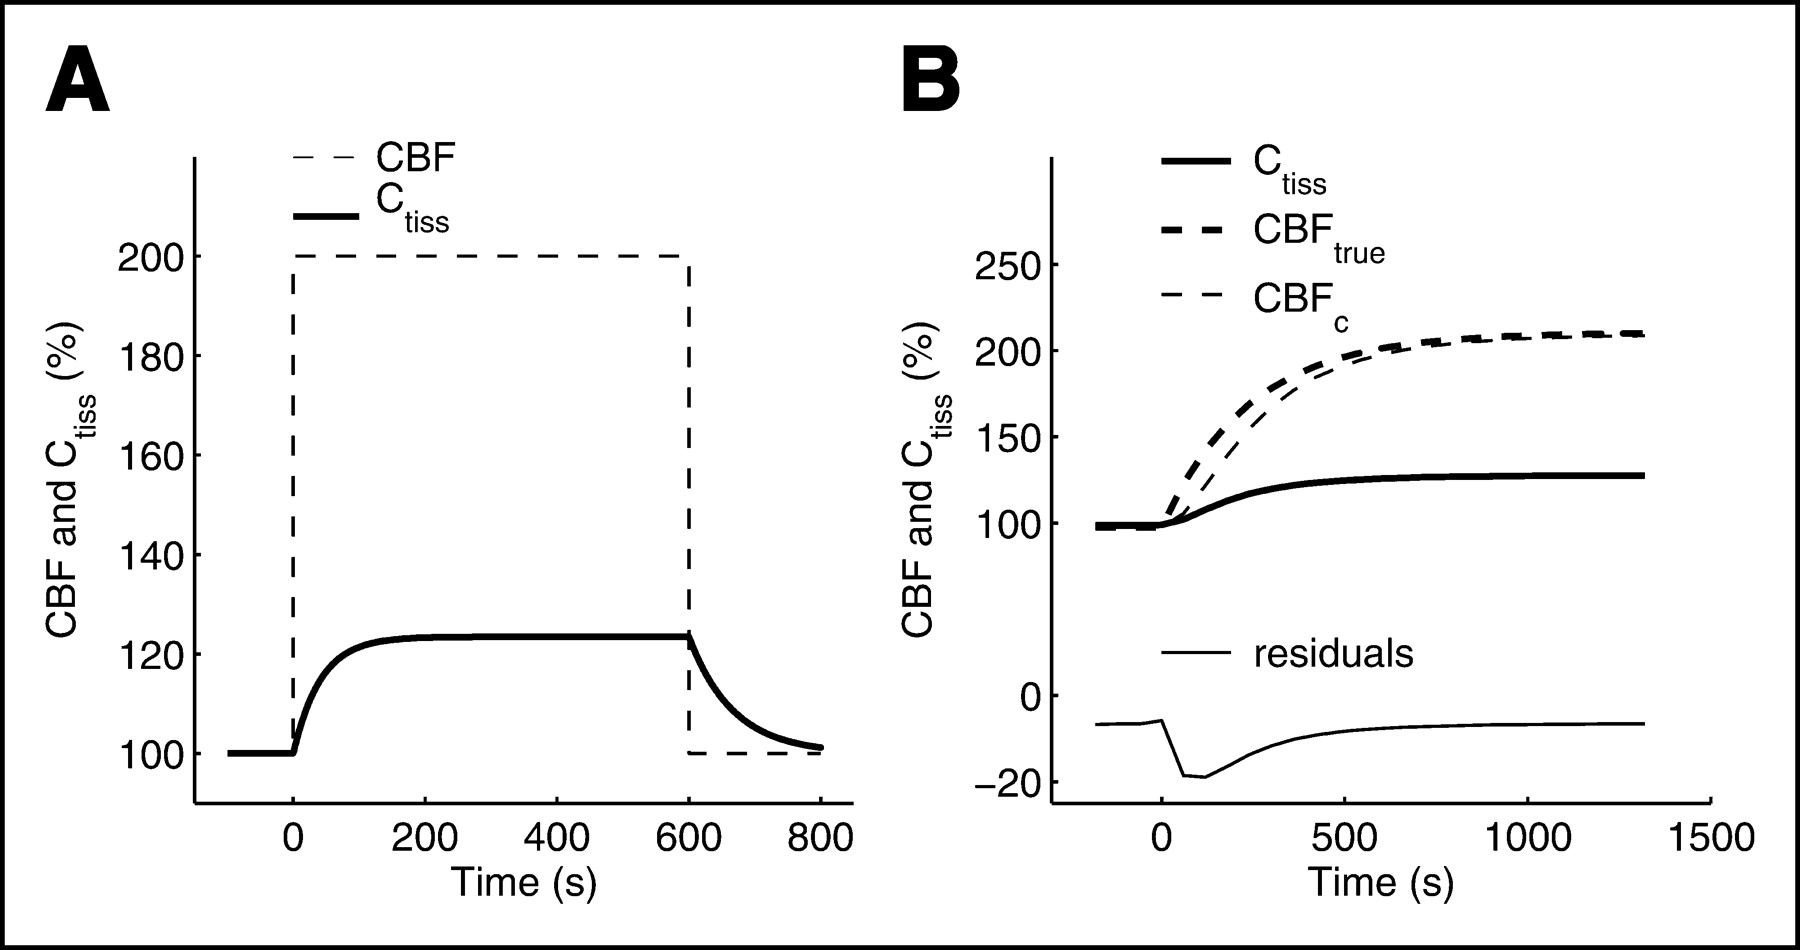
Equation 4 was used to calculate parametric maps of CBF voxel by voxel, but this equation is valid only when 15O activity is fully equilibrated, which requires a stationary CBF. This condition is not fulfilled after ACZ when CBF increases. For this reason, CBF calculated using Equation 4 is denoted CBFc. To estimate the error from using Equation 4 in a nonstationary situation, a simulation was performed as described in the legend of Figure 1.

Normalized response of Ctiss to a rectangular flow change (A) and a more physiologic flow change (B). In A, flow was assumed to change from 50 to 100 and back to 50 mL/min/100 mL. In B, the curves were calculated as follows: First, the calculated cerebellar time course of CBF after ACZ of 1 patient was approximated by the equation CBFsim = CBFbase + ΔCBF(1 − e−ln2/T×t), where baseline CBF (CBFbase) = 50 mL/min/100 g, ΔCBF = 50 mL/min/100 g, and time (T) = 165 s. Simulated CBF (CBFsim) was then assumed to be true CBF (CBFtrue). CBFtrue and a constant ca were fed into Equation 1 to calculate a simulated time course of Ctiss (Ctiss sim). Ctiss sim was then back-converted to CBFc values using the equilibrium equation, Equation 4. For display purposes, all values were normalized to baseline and expressed as a percentage. The deviation of CBFc from CBFtrue is, at maximum, 13% (2 min after ACZ).
H215O Infusion
An automatic injection device for H215O is mandatory for constant-infusion protocols. 15O is produced continuously in the cyclotron by the 14N(d,n)15O reaction on N2 containing 0.5% O2 and delivered to the injector. 15O-O2 is reacted continuously with H2 over a PdO2 catalyst at 200°C in the injection device. The injector is analogous to the device described by Tochon-Danguy et al. (11) and consists of an infusion pump (VP 5000; Arcomed AG), a radioactivity detector (VRM 202; Veenstra Instruments), three 3-way valves, a temperature-controlled catalyst oven containing PdO2 grains, and a gas–liquid exchanger. The membrane in the exchanger is produced by Visking Dialysis Tubing (Medicell Int. Ltd.).
The cyclotron current was adjusted to yield 50–66 MBq/min. During the infusion of H215O into patients, the time course of the activity in the infusion catheter was continuously monitored and graphically displayed online.
Patients
The study included 10 patients (5 male, 5 female; mean age, 41.5 y; range, 6–73 y) referred for preoperative assessment of cerebral perfusion status. The use of H215O PET for this purpose was approved by the local ethical committee. Patient information is summarized in Table 1. All patients were scanned while awake in the dimly lit PET suite.
Patient Data
Data Acquisition
The PET studies were performed in 3-dimensional mode on a whole-body scanner (Advance; General Electric Medical Systems). This is a scanner with an axial field of view of 14.6 cm and a reconstructed in-plane resolution of 7 mm. Before positioning of the patients in the scanner, catheters were placed in the left and right antecubital veins for tracer infusion and ACZ administration. An additional catheter was placed in the radial artery for continuous measurement of the total arterial 15O concentration. During scanning, arterial blood was continuously drawn at 150 mL/h and the activity in the catheter was measured in a coincidence counter that was calibrated to the PET scanner. Data were acquired at 1-s intervals. To minimize movement artifacts, the head of each patient was restrained in a head holder. Before the H215O application, a 10-min transmission scan was acquired for attenuation correction. After the start of the H215O infusion, the time course of the total counts recorded from the field of view was graphically displayed online. The infusion rate was approximately 1.7 MBq/kg/min. After a steady state was reached, 5 min of baseline data were acquired. Then, ACZ was administered as a slow bolus over 2 min and the data acquisition continued for 10–22 min. Because certain patients were severely disabled, it was not possible to adhere to a fixed time protocol. The dose was 1 g for patients weighing more than 60 kg; for lighter patients the dose was adjusted. Scanning consisted of continuous 1-min frames. Transaxial images of the brain were reconstructed using filtered backprojection (128 × 128 matrix, 35 slices, 2.34 × 2.34 × 4.25 mm voxel size) on non–decay-corrected data.
Data Analysis
Parametric maps of CBFc were calculated by applying Equation 4 to each voxel. The partition coefficient p was fixed to 0.9 (12,13). To obtain Ca, the data from the coincidence counter were decay corrected for the time lag between the radial artery and the counter (on the order of 8 s) and were averaged into 1-min bins synchronized to the PET scans. Volumes of interest (VOIs) extending over 2 slices were then defined manually in the cerebellum and the left and right MCA territories (Fig. 2). The mean of the VOI applied to the parametric images was taken to represent CBFc. In addition, the time course of 15O activity in the VOIs was calculated. PMOD software (PMOD Technologies Ltd.) (14) was used to calculate the parametric maps, define the VOIs, extract the time–activity curves, and perform all simulations.
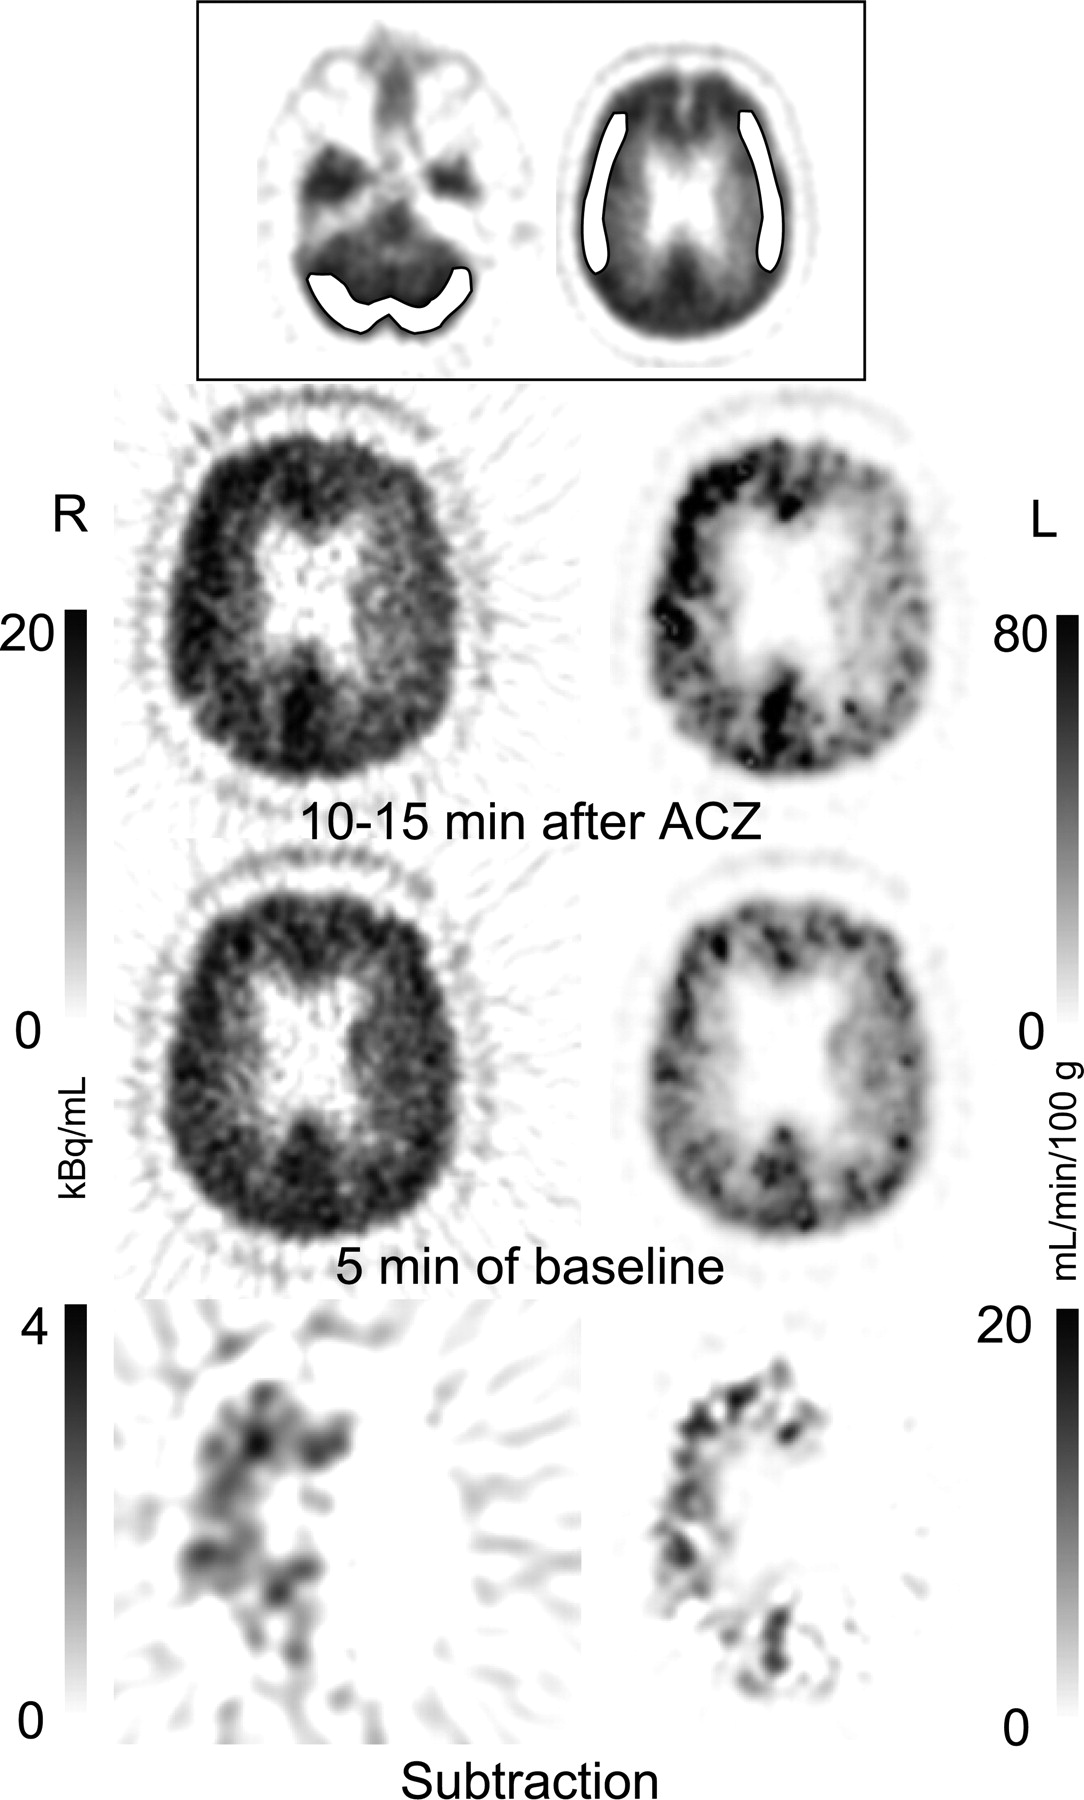
Assessment of cerebral perfusion status of patient 1, with left-sided internal carotid artery stenosis. Images at top demonstrate placement of VOIs. Images on left represent the mean H215O concentration of 5 consecutive 1-min frames in transaxial slices through the territory of the middle cerebral artery. On right are parametric images in which CBF is calculated voxel by voxel. Although perfusion is symmetric at baseline, the increase in the territory of the left middle cerebral artery is reduced after ACZ. The subtraction image was filtered using a 3-dimensional gaussian kernel of 10 mm in full width at half maximum. The reduced increase of CBF is more evident on the parametric images.
The reproducibility of cerebellar CBF values derived from subsequent scans was analyzed using the Bland–Altman method (15). For this analysis, the difference between baseline scans 1 and 2 and baseline scans 3 and 4 was used.
RESULTS
The kinetic behavior of the tissue H215O concentration (Ctiss) in response to hypothetical rectangular and more physiologic flow changes is shown in Figure 1. The curves were calculated by numeric integration of Equation 1, with p set to 0.9. For the rectangular flow change, the increase in Ctiss after the change was delayed; 95% of the increase was reached after 120 s. The reverse held for the decrease. The 100% increase in CBF was associated with a 23% increase in Ctiss. For the more physiologic flow change, depicted in panel B, the time lag of CBFc relative to CBFtrue was considerably less pronounced. The maximum deviation of CBFc from CBFtrue occurred 2 min after ACZ and was 13%.
Image Quality
Example images of patient 1, with a stenosis of the left internal carotid artery, are shown in Figure 2. Image quality is high (average of five 1-min frames), and the reduced PR in the territory of the left middle cerebral artery is clearly noticeable, especially on the subtraction images. Because of the nonlinear dependence of CBF on Ctiss, the decrease in PR is even more apparent on the parametric images.
Stability of Arterial 15O Concentration
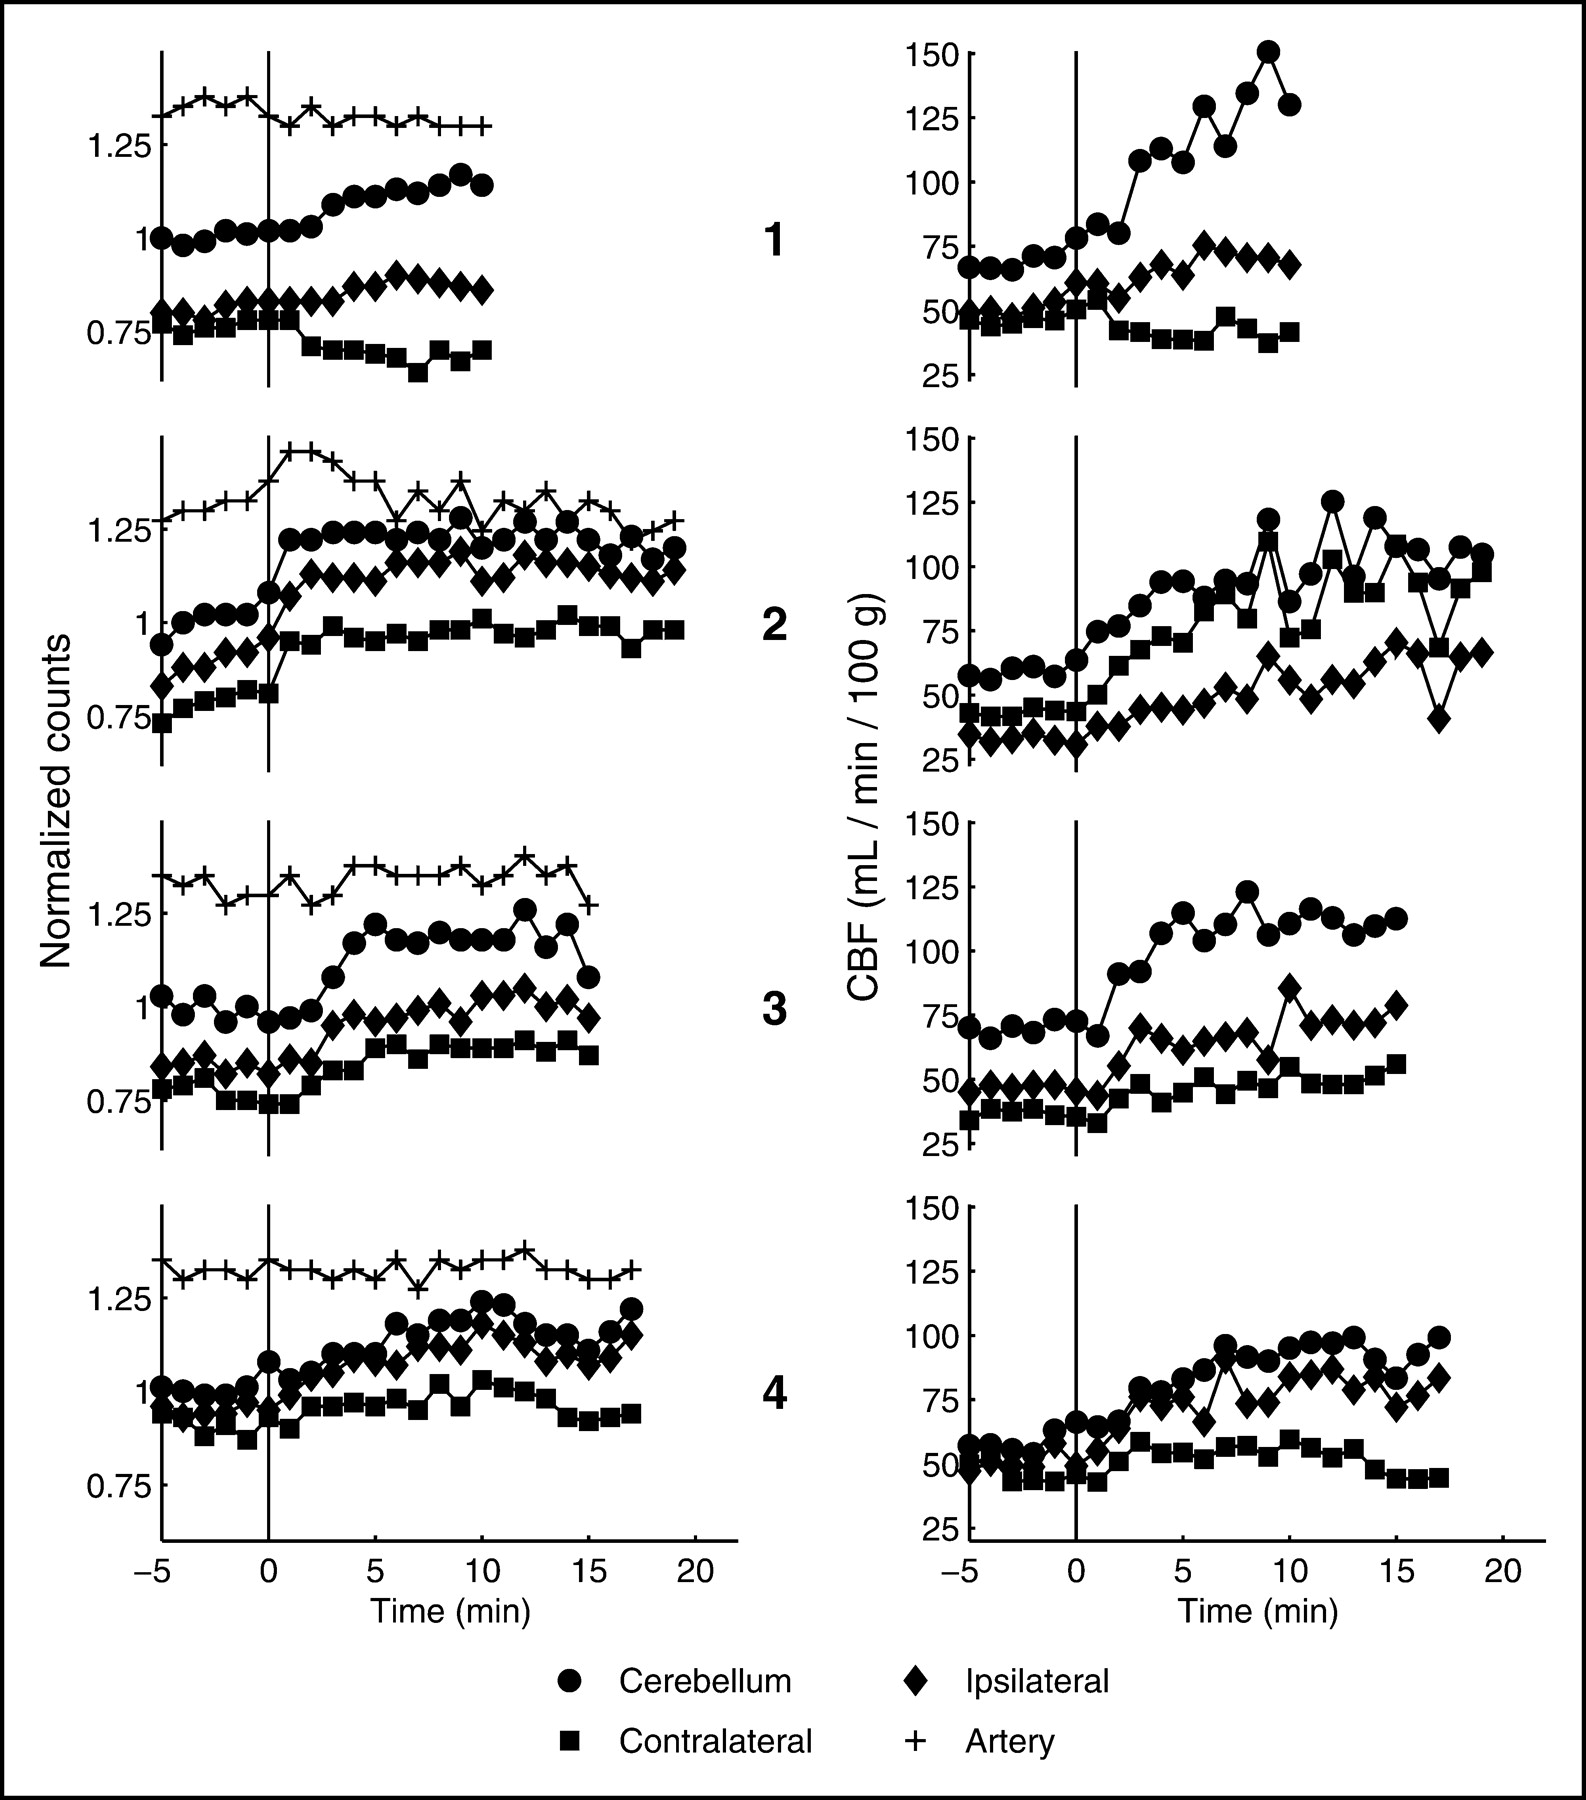
The time course of the arterial concentration is plotted as the top curve on the left side of Figures 3 and 4. In patients 1, 3, 4, 6, 9, and 10, the curve is stable. In patients 2 and 8, there seems to be a slight change after the administration of ACZ. In patient 2, the arterial activity is first increasing and then constantly declining. As a consequence, the time course of the tissue activity and the CBF values looks different. Whereas the tissue activity (left graph) reaches a plateau, CBF is constantly increasing (right graph). The mean coefficient of variation of the total time course (all 1-min bins of data) of all arterial curves was 3.2%. The highest value was found in patient 5 (6.6%) and the lowest in patient 6 (1.3%).

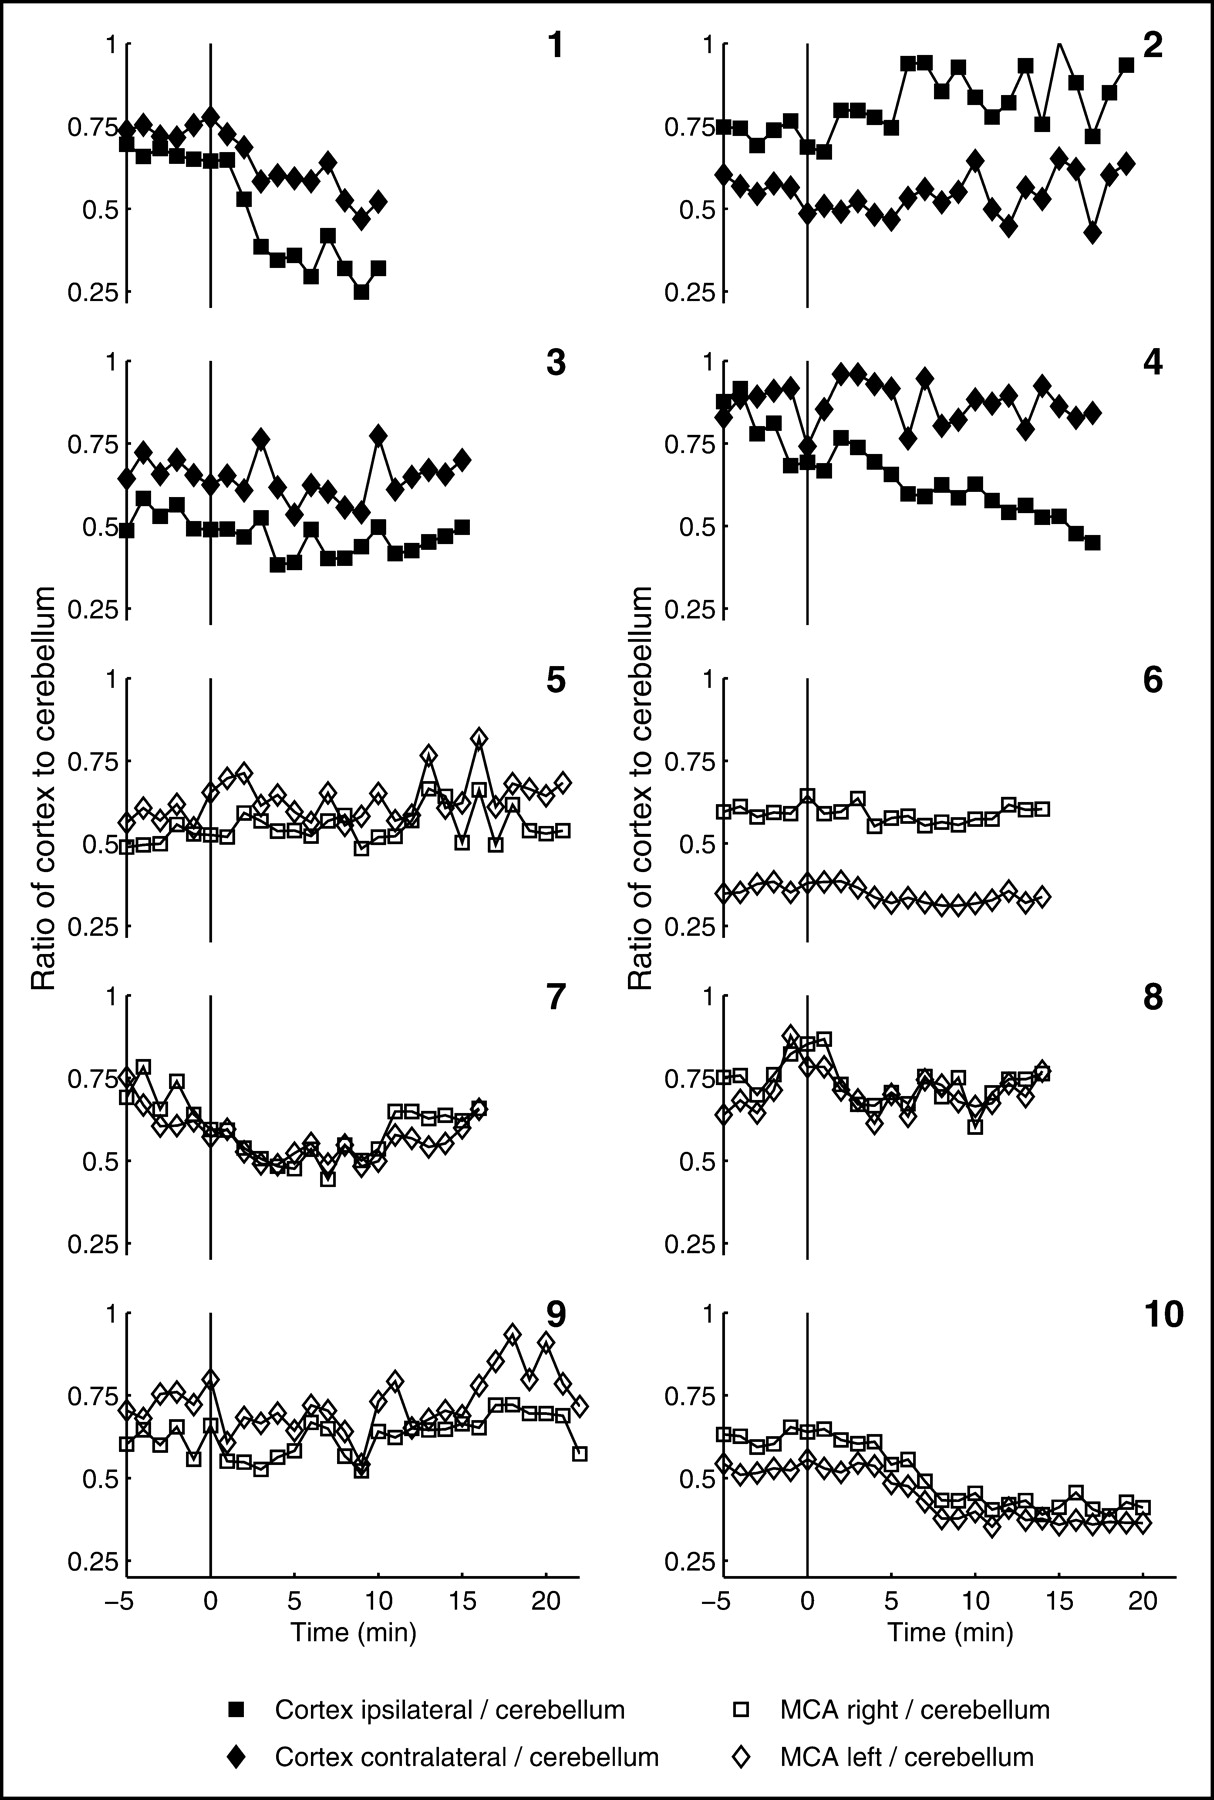
Tissue time–activity curves for patients 1–4, with stenosis of the internal carotid artery. The graphs on the left demonstrate the tissue time–activity curves normalized to the mean of the cerebellum. The graphs on the right demonstrate the time course of CBFc.

Tissue time–activity curves for patients 5–10, with moyamoya disease. The graphs on the left demonstrate the tissue time–activity curves normalized to the mean of the cerebellum. The graphs on the right demonstrate the time course of CBFc. MCA = middle cerebral artery.
Time Course of Tissue Activity and CBF in Cerebellum
All patients except patient 5 demonstrated an increase in tissue activity and CBF, with an onset 1–2 min after the administration of ACZ. In patients 6 and 10 the increase was more sluggish, and in patient 5 no reaction to ACZ was noted. In all patients, baseline values were higher in the cerebellum than in the cortex. In the 4 patients with stenosis of the internal carotid artery (Fig. 3), CBF in the cerebellum and in the cortex contralateral to the stenosis was 66.1 ± 6.5 and 46.4 ± 9.5 mL/min/100 g, respectively (mean ± SD).
Time Course of Tissue Activity and CBF in Cortex
In all patients with stenosis of an internal carotid artery, the increase in tissue activity and CBF was less pronounced on the stenosed side. Patient 1 showed a decrease after ACZ (steal phenomenon). In most patients with moyamoya disease (Fig. 4), the cortical areas displayed a more sluggish increase after ACZ than did the cerebellum, and the steal phenomenon was noticed in patient 10.
Often, clinical evaluation does not depend on absolute values but on ratios. In this respect, it was interesting to note that the ratio of cortex to cerebellum seemed to reach a plateau after 5 min of decline after ACZ injection (Fig. 5).

Time course of the ratio CBFcortex/CBFcerebellum for the 10 patients.
Reproducibility of CBF Values at Baseline
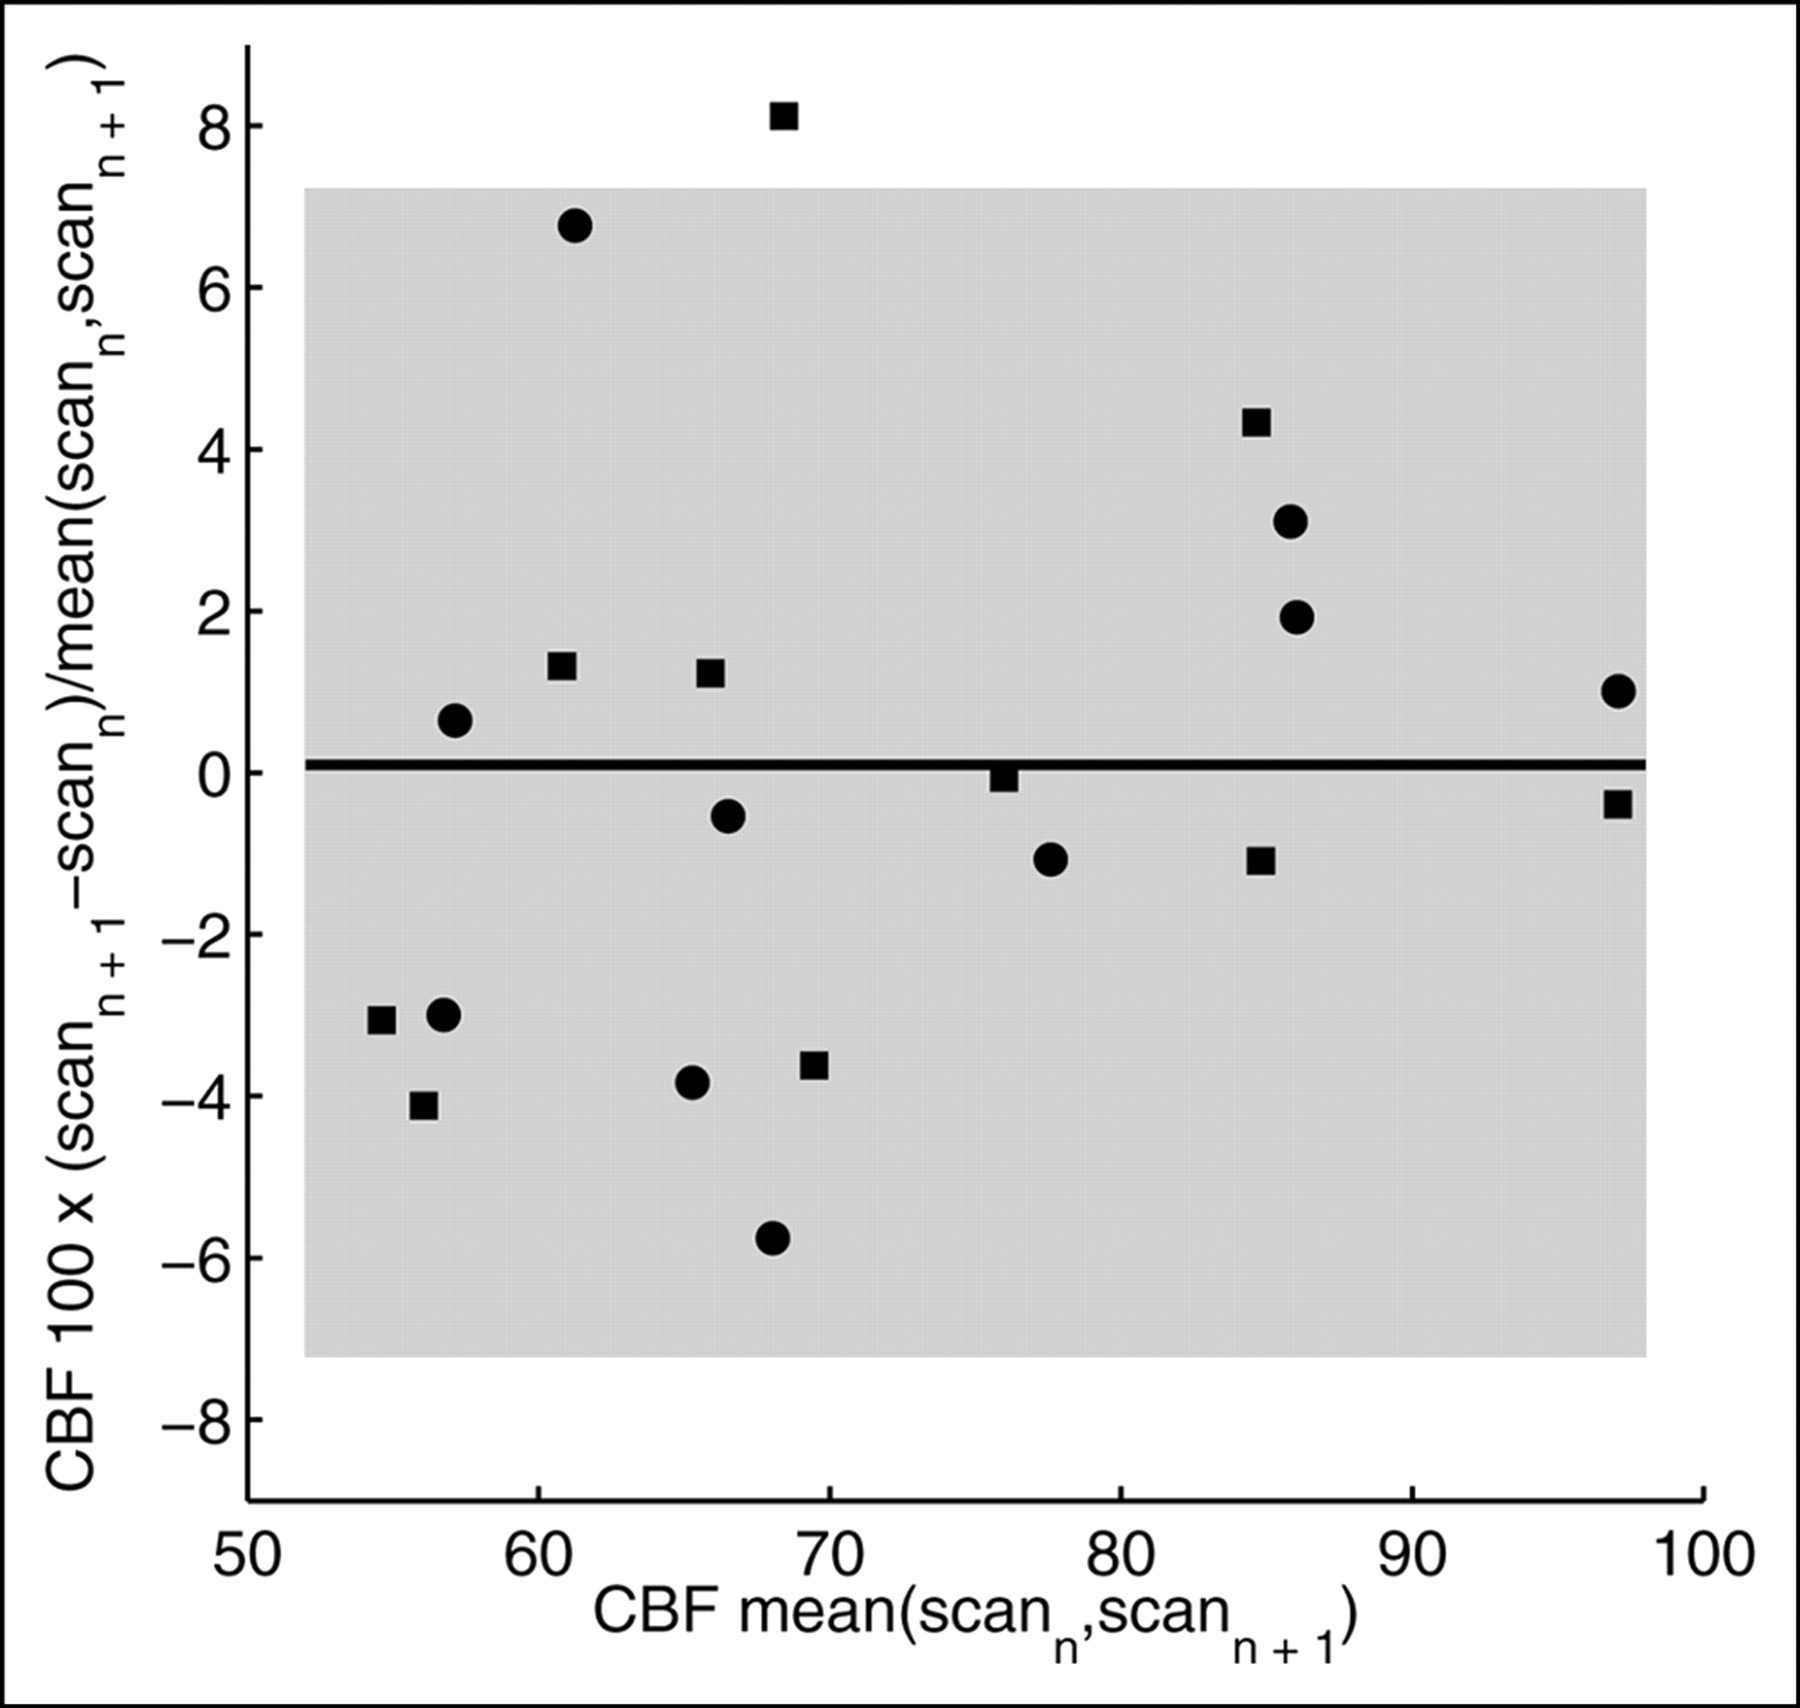
The difference in the cerebellar blood flow values of 2 pairs of successive baseline scans was chosen as a measure of reproducibility. The result is presented as a Bland–Altman plot in Figure 6. The mean difference was 0.09%, and the SD was 3.6%. All data points except 1 were contained in the range mean ± 2 SDs. Another measure of variability was the coefficient of variation of the 5 baseline values (SD/mean), which was 4.6% ± 2.1% (mean ± SD).

Bland–Altman plot of the reproducibility of the baseline scans. Two differences were analyzed: scan 2 − scan 1 (•) and scan 4 − scan 3 (▪). The differences are presented as the percentage of the mean of the 2 scans. The horizontal line is the mean difference of all data points, and the shaded area represents mean ± 2 SDs.
DISCUSSION
A simple and reliable parameter for identifying a reduced PR is the change in CBF ratio after administration of ACZ. One often relates CBF, or a measure of it, in the pathologic area of interest to CBF in an area least affected by the disease. In the presented cases, the area least affected was the cerebellum. The time course of the ratio shown in Figure 5 demonstrates a fast initial drop that bottoms out at 5 min. The ratio approach fails if the disease is generalized or if the steal phenomenon is to be diagnosed. In these cases, some kind of quantification with bolus injection is necessary. With continuous infusion, the time course of Ctiss may already yield the required information. This is illustrated in patients 1 and 10. An initial steal in the MCA territory is clearly noticeable.
Other groups have used multiple bolus injections instead of a continuous infusion. Hayashida et al. used H215O PET to measure the ACZ-induced response at 10, 20, and 30 min (3). They reported that in nonpathologic areas, the largest increase occurred after 10 min, which they suggested to be the best time point for assessing PR. Kuwabara et al. (8), in another H215O PET study, measured the CBF response at 5 and 20 min and recommended that 5 min be the preferred time point for imaging. The conclusion of both studies is endorsed by the present work. If the maximal change in CBF is to be assessed, in most cases an assessment at around 10–15 min after ACZ administration would be suitable. However, to assess more transient changes such as the steal phenomenon, earlier imaging might be preferable. In patient 10, the steal effect reached a maximum at around 4 min, remained stable for another 6 min, and then subsided again. If one relies on a ratio, the measurement can also start as early as 5 min after ACZ (Fig. 5).
Several points favor a constant-infusion protocol. The most important is probably that the optimal time point of data analysis can be chosen post hoc. Furthermore, the constant-infusion protocol may allow definition of new, potentially useful parameters for the evaluation of cerebrovascular perfusion status. These could include the initial rate of CBF increase, which would be negative in cases of the steal phenomenon, and the time course and degree of the steal phenomenon. Studies will be needed to assess which of these parameters is most useful for evaluating cerebrovascular patients and for following them up after a revascularization procedure. A further advantage of the constant-infusion protocol is that it avoids another source of error with bolus techniques, namely the need to correct for delay and dispersion of the arterial input curve. The constant-infusion technique has obvious drawbacks. Using the equilibrium approach in the nonstationary phase after ACZ leads to somewhat distorted CBFc values. However, the error is relatively small, as is illustrated in Figure 1. Furthermore, the method is somewhat more complicated, especially when one considers that quantification with bolus injections is possible without arterial blood sampling (16,17). However, one has to consider the accuracy of the quantitative methods relying on bolus injections. The reproducibility of 2 successive absolute CBF measurements is on the order of 10% (18), meaning that CBF must change by 20% to be detected with 95% reliability. Here, continuous monitoring is advantageous. For instance, in the case of the presented steal phenomenon in patients 1 and 10, there is hardly any doubt that CBF decreased in the affected areas after ACZ. In patient 5, one has to conclude that ACZ induced no change despite the relatively high noise level, but the reason is not clear. Nevertheless, one would not reach this conclusion with the same certainty if 1 bolus injection were given after ACZ.
The reproducibility measured in the 5 baseline scans seems higher than for bolus injections (6% vs. 10%). However, the values cannot be directly compared. In this work the scans were only 1 min apart; with bolus injection, the interval between the scans is about 10 min. Furthermore, reproducibility with the infusion technique deteriorates at higher CBF values, as is obvious from the cerebellar CBF curves after ACZ.
In the past, continuous intravenous H215O protocols were used by other groups. Jones et al. evaluated the method in 8 healthy volunteers (19). Others applied the method to organs other than the brain (20–22). Theoretic considerations on the subject were published by several groups (10,23–27), and human applications were discussed by others (28,29). More common than intravenous application of H215O was the continuous application of C15O2 through inhalation. After inhalation, C15O2 is converted to H215O in the body. Compared with the inhalation method, the intravenous application of H215O has several advantages, such as more reliable control of the rate of infusion and no need for a mask, which is uncomfortable for the patient.
CONCLUSION
From a practical point of view, the constant-infusion paradigm takes only slightly longer than the bolus injection method. The added time is due to the equilibration phase, which is on the order of 10 min. This equilibration time might increase the absorbed radiation dose compared with that obtained using bolus injections. However, a comparison is not straightforward, since once equilibrium is achieved, the statistical quality of the scans is superior, which in turn may allow a reduction of the infusion rate. A potential problem is nonlinear dependence of CBF on tissue activity. This leads to a substantial amplification of noise in the high-flow areas, which is obvious in most cerebellar CBF curves after ACZ. In addition, the time course of Ctiss and CBFc does not exactly reflect the true time course of CBF. However, for relatively slow changes as induced by ACZ, the discrepancy is small, as demonstrated in Figure 1. This study included only a limited number of patients with various pathologies, and no comparison with values in healthy subjects was possible. However, the time course of CBF in the cerebellum of the presented patients may reflect the situation in healthy subjects, since there was no angiographic evidence of abnormality in this region. Furthermore, the percentage increase of CBF in the cerebellum after ACZ was well in line with published values. It will nevertheless be important to further assess the value of the method in each type of cerebrovascular disease. The method is advantageous when the time course of CBF after an intervention is not known. With continuous monitoring, the optimal time point for evaluation of a certain parameter can be chosen post hoc. Furthermore, the time course of CBF itself may allow definition of new parameters for the evaluation of perfusion status in cerebrovascular patients, both for assessment before a revascularization procedure and for follow-up.
Acknowledgments
This study was supported in part by grant 3238-62769.00 from the Swiss National Science Foundation. The authors thank Thomas Berthold and Michael Belohlavy for help with data acquisition and Gustav K. von Schulthess for valuable discussions.
Footnotes
Received Dec. 11, 2003; revision accepted Feb. 6, 2004.
For correspondence or reprints contact: Bruno Weber, PhD, Division of Nuclear Medicine, University Hospital Zurich, Rämistrasse 100, 8091 Zurich, Switzerland.
E-mail: bweber{at}nuklearmed.unizh.ch


