


Abstract
Prior studies have documented increased 18F-FDG adrenal activity in both benign and malignant pathologic conditions. When whole-body PET imaging is performed without CT anatomic coregistration, however, the normal adrenal gland is difficult to recognize. The purpose of this study was to investigate the normal adrenal appearance and standardized uptake value (SUV) using 18F-FDG PET/CT imaging. Methods: Twenty patients with lymphoma with normal-appearing adrenal glands on prior CT examination (less than a 5% pretest likelihood of adrenal involvement) were studied. PET/CT imaging was performed 2 h after intravenous administration of 18F-FDG. Unenhanced CT scans were acquired for attenuation correction and anatomic coregistration. PET images were reconstructed using an ordered-subsets expectation maximization algorithm and were corrected for body weight, dose, and radioactive decay. Ability to confirm visualization of the adrenal glands was determined for 18F-FDG PET alone and for 18F-FDG PET/CT by a consensus of 2 readers, and uptake of 18F-FDG in the adrenal gland was compared with liver activity and scored visually (0 = no visualization, 1 = activity less than in liver, 2 = activity equal to liver activity, and 3 = activity greater than in liver). Results: The 2 readers agreed on visualization of the adrenal glands with PET alone for 2 of 40 (5%) glands. With PET/CT, the readers agreed on visualization of 27 of 40 (68%) adrenal glands. Visual scores for normal adrenal activity ranged from 0 to 3, and maximum SUVs ranged from 0.95 to 2.46. Visual scoring of adrenal activity correlated well with both mean and maximal SUV (mean SUV vs. visual score: slope = 0.96, r = 0.88; maximum SUV vs. visual score: slope = 0.99, r = 0.87). Conclusion: PET/CT permits more reliable visualization of normal adrenal glands than does PET alone. Visual assessment of adrenal uptake correlates well with SUV measurement, and readers of PET/CT need to be aware of the wide range of normal adrenal uptake.
Prior studies have characterized the abnormal appearance of adrenal masses on 18F-FDG PET studies. In general, malignant lesions show 18F-FDG activity equal to or greater than liver activity (1–4), although benign adenomas may also show increased 18F-FDG uptake. Because of low 18F-FDG activity in the normal adrenal, visualization of the gland is difficult with stand-alone PET. The range of 18F-FDG activity of the normal adrenal gland could not, therefore, be characterized before anatomic coregistered PET and CT (PET/CT) became available.
The purpose of this study was to establish the appearance and range of 18F-FDG activity of the normal adrenal gland using 18F-FDG PET/CT.
MATERIALS AND METHODS
This was a retrospective study of 20 sequential 18F-FDG PET/CT studies performed on patients with pathologically proven lymphoma (11 with non-Hodgkin’s lymphoma and 9 with Hodgkin’s disease) referred for staging. Patients with lymphoma were chosen because of the very low pretest likelihood of adrenal involvement (less than 5%) (5–9). All patients underwent CT imaging before their 18F-FDG PET/CT study to confirm that none had CT evidence of an abnormal adrenal mass. All patients were studied before initiation of chemotherapy or radiation to avoid any potential effect on adrenal 18F-FDG uptake. The Institutional Review Board of Fox Chase Cancer Center approved the study.
Patients fasted for at least 4 h before the intravenous injection of 18F-FDG (8.1 MBq/kg of body weight) but were allowed to drink water and to take medications. PET/CT was performed on a Discovery LS scanner (General Electric Medical Systems). CT studies for attenuation correction and anatomic coregistration were performed without intravenous contrast material, with no breath-hold, and with the following imaging parameters: 140 kVp, 90 mA, 0.8 s per CT rotation, and a 5-mm slice thickness. PET emission data were obtained 2 h after 18F-FDG injection, for 6 min at each bed position, using a 2-dimensional high-sensitivity mode with an axial field of view of 14.5 cm. There was a 1-slice overlap between the bed positions. The PET images were reconstructed on a 128 × 128 matrix using an ordered-subsets expectation maximization algorithm for 28 subsets and 2 iterations, with a 10-mm postreconstruction filter. The PET system has an in-plane resolution of 5 mm (10). CT data were used for attenuation correction of all PET images for both visual and quantitative analysis. All images were corrected for body weight, dose, and radioactive decay and were displayed on an eNTEGRA workstation (General Electric Medical Systems) using a standardized uptake value (SUV) gray scale of 0 (white) to 5 (black). All images were reviewed to make certain there had been no significant patient movement between the CT and PET acquisitions, to ensure adequate coregistration for placement of the adrenal region of interest (ROI).
Each adrenal gland was measured in millimeters, using the longest dimension on the axial CT slice on which the adrenal gland was largest. To measure the adrenal SUV, a manual ROI was drawn in the shape of the adrenal gland on the same slice. This ROI was then applied to the adrenal gland in the coregistered 18F-FDG PET image. The adrenal glands ranged from 15 to 28 mm in maximum width, and the total number of pixels in the ROIs ranged from 50 to 75. Mean and maximum SUVs were recorded using the vendor-supplied SUV software.
The 18F-FDG PET/CT studies were first independently reviewed by 2 observers to determine how often they could confirm visualization of either adrenal gland based on PET images alone. The readers reviewed both the 3-dimensional volume-rendered maximum-intensity-projection images and the simultaneously displayed 18F-FDG PET transaxial, coronal, and sagittal views. A linked cursor program permitted simultaneous, dynamic cursor placement in the maximum-intensity-projection images and in all 3 imaging planes to help the readers confirm or exclude adrenal visualization. The adrenal was said to be visualized if the readers saw any focus of 18F-FDG uptake greater than adjacent background levels in the expected anatomic location of either the right or the left adrenal gland. If adrenal uptake was detected, each reader was asked to score it visually, compared with liver activity (0 = no visualization [Fig. 1A], 1 = activity less than in liver [Fig. 1B], 2 = activity equal to liver activity [Fig. 1C], and 3 = activity greater than in liver [Fig. 1D]).
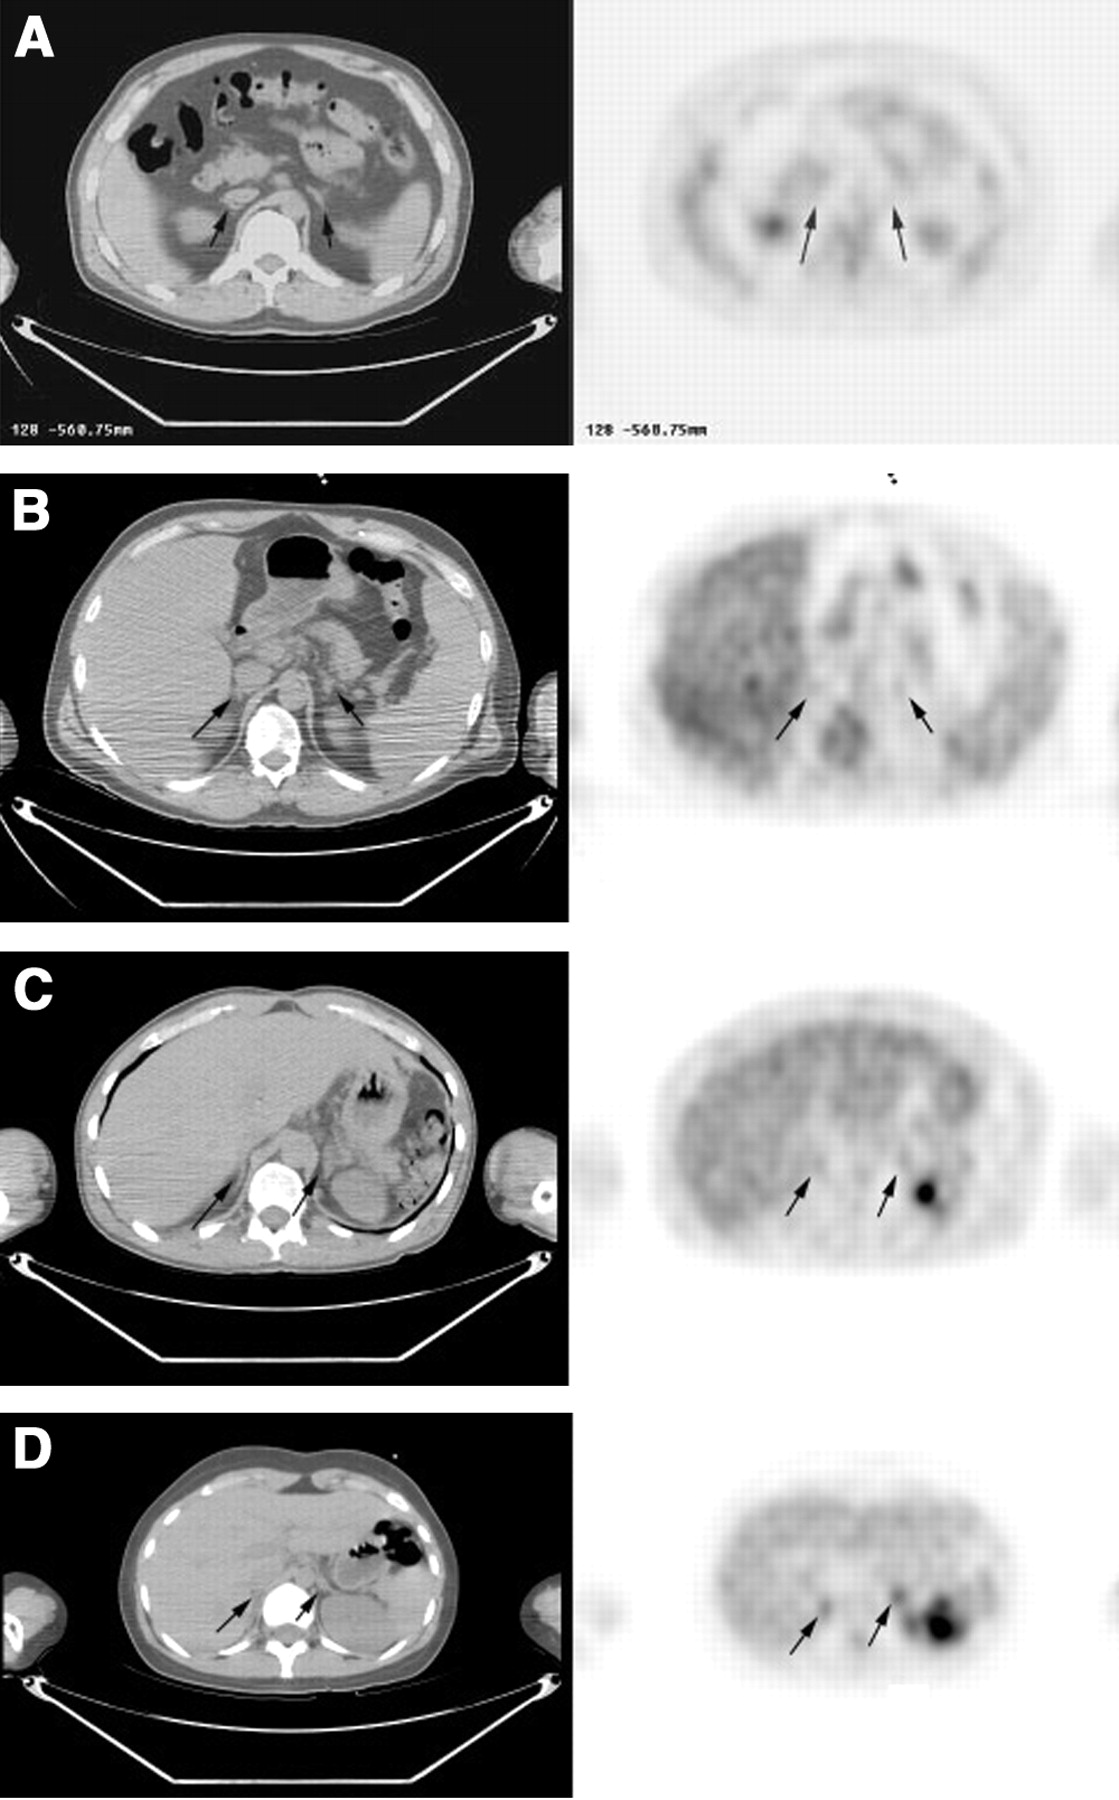
Visual scoring of 18F-FDG PET/CT paired transaxial images. Arrows show the location of the adrenal glands coregistered on the CT image (left) and linked to the corresponding anatomic location on the PET image (right). These examples demonstrate no uptake (visual score = 0) (A), activity greater in adrenal gland than in background but less in adrenal gland than in liver (visual score = 1) (B), adrenal activity equal to liver activity (visual score = 2) (C), and adrenal activity greater than liver activity (visual score = 3) (D).
In a separate session, the readers were given the same studies in random order and were asked to evaluate the anatomically coregistered PET/CT images using the same dynamic linked-cursor display. They were again asked to visually score right and left adrenal activity.
The 2 readers’ independent scores from the PET/CT reading were averaged for each adrenal gland. Cases of no agreement on whether adrenal uptake was seen were resolved by a separate consensus reading by the 2 observers.
The SUV was calculated as decay-corrected activity (kBq) per milliliter of tissue volume per injected 18F-FDG activity (kBq) per body mass (g).
Statistical Analysis
Group comparisons were tested for significance using the Student t test. Data were expressed as the mean ± SD. P < 0.05 was considered significant. For each adrenal gland, the mean visual scores were compared with the measured SUVs from the PET/CT study by linear regression.
RESULTS
When evaluating 18F-FDG PET images alone, the readers agreed on visualization of an adrenal gland for 2 of 40 (5%) glands. This was in only 1 patient, who showed prominent bilateral adrenal uptake (Fig. 2). When evaluating the coregistered PET/CT images, the readers agreed that 68% of adrenal glands (27/40) could be visualized and that the remaining 32% (13/40) could not.

This maximum-intensity-projection image is the only case in which the readers agreed that the adrenal gland could be seen on the PET-alone image review. In this case, adrenal activity was prominent bilaterally (arrows).
The mean (±SD) sizes were 16.2 ± 1.4 mm for the right adrenal gland and 16.3 ± 0.8 mm for the left adrenal gland (P = not statistically significant). The means of the average SUV (±SD) were 0.83 ± 0.17 for the right adrenal gland and 0.94 ± 0.15 for the left adrenal gland (P = not statistically significant). The means of the maximum SUV (±SD) were 0.90 ± 0.15 for the right adrenal gland and 1.10 ± 0.15 for the left adrenal gland (P = 0.04). The range of maximum SUVs for all adrenal glands was 0.95–2.46. The average visual score for the 2 observers correlated well with both the average SUV (slope = 0.96, r = 0.88) and the maximum SUV (slope = 0.99, r = 0.87) (Fig. 3).

Plot showing the linear regression for visual scores (Vis Score) versus the mean and maximum (Max) SUVs.
DISCUSSION
The adrenal glands are retroperitoneal, suprarenal organs enclosed within the perinephric fascia and surrounded by a variable amount of retroperitoneal fat. Each adrenal gland is a roughly pyramidal structure 2–3 cm wide, 4–6 cm long, and about 1 cm thick that lies above or posteromedial to and occasionally attached to the upper pole of the kidney. Each weighs about 4 g, regardless of patient age or sex.
The right adrenal gland is superior to the upper pole of the right kidney and posterior to the inferior vena cava and is between the right lobe of the liver and the right crus of the diaphragm. If there is a paucity of retroperitoneal fat, the right adrenal gland can be difficult to visualize on CT. The left adrenal gland often lies lateral to the aorta and left diaphragmatic crus, superior to the left renal vein, and anteromedial to the upper pole of the left kidney (5).
CT is the primary diagnostic imaging method for evaluation of adrenal glands. On an optimal CT scan, normal and pathologic adrenal glands can be well visualized.
Intravenous contrast material may be useful for characterizing the enhancement pattern of masses to improve the ability to make specific diagnoses. With T1-weighted MRI, the adrenal glands have a medium signal intensity similar to that of liver, somewhat greater than the diaphragmatic crus but less than the surrounding fat. In standard T2-weighted images, the adrenal glands are hypointense to fat and isointense to liver but hyperintense to the crus. Significant chemical shift artifacts may obscure details of the normal adrenal gland. On fat-suppressed T2-weighted MR images, however, the normal adrenal gland appears brighter than the suppressed fat. Thus, normal adrenal glands and small masses are best seen on T1-weighted or fat-suppressed T2-weighted images. The normal adrenal gland does not enhance markedly after intravenous administration of gadolinium (5).
Unlike CT and MRI, 18F-FDG PET is based on increased glucose metabolism. In a retrospective analysis of 50 adrenal lesions in 41 patients, most (13/18) malignant adrenal lesions showed significantly higher 18F-FDG uptake than in the liver and most (27/32) benign lesions had activity less than in the liver (1). In a group of 26 patients studied with 18F-FDG PET, 6 had adenomas, 7 had nonadenoma benign lesions (1 neurinoma, 1 ganglioneuroma, 1 cyst, 1 myelolipoma, and 3 pseudotumors), and 13 had malignant tumors (6 carcinomas, 1 sarcoma, and 6 metastases). No significant 18F-FDG uptake was observed in any benign adrenal lesion. Conversely, increased 18F-FDG uptake (greater than background levels) was observed in all patients with malignant adrenal tumors (11). In a study of Shulkin et al., calculated SUVs ranged from 2.6 to 13.4 for 12 patients with benign pheochromocytoma and from 1.6 to 13.3 for 17 patients with malignant pheochromocytoma. All malignant tumors had activity greater than in the liver (12). Erasmus et al. performed a study to differentiate benign from metastatic adrenal masses in patients with bronchogenic carcinoma (3). Twenty-five adrenal masses had increased 18F-FDG uptake (greater than background levels), but only 23 had metastatic disease confirmed on biopsy. Eight adrenal masses had no increased 18F-FDG uptake, and these were all proven benign on biopsy.
Interpretation of adrenal uptake as benign or malignant on the basis of visual assessment may be problematic. In a study by Yun et al., 13 of 18 malignant lesions had uptake significantly greater than in the liver; however, 5 malignant lesions had uptake equal to or only slightly greater than liver uptake (1). Because normal adrenal glands may also show activity equal to or slightly greater than liver uptake, one must be cautious in the interpretation of a benign versus a malignant lesion when such uptake is present. Interpretation based on coregistered 18F-FDG PET/CT may help. An adrenal gland that appears to be of normal size on CT, with only minimally increased 18F-FDG uptake (equal to or slightly greater than liver uptake), should be considered most likely benign. Most malignant adrenal lesions will show on CT a marked increase in 18F-FDG uptake (greater than in liver) with or without an increase in the size of the adrenal gland. Studies on larger numbers of patients will be needed to confirm this approach.
In this study, we showed that identification of the normal adrenal gland was difficult with 18F-FDG PET images alone and that coregistered 18F-FDG PET/CT permitted visualization of 18F-FDG uptake (greater than background levels) in 68% of normal adrenal glands. Thus, even with anatomically coregistered 18F-FDG PET/CT, 32% of normal adrenal glands did not show uptake greater than background levels. We also found that there is a wide range of normal adrenal uptake, with visual scores ranging from 0 to 3 and maximum SUVs ranging from 0.95 to 2.46. Thus, normal adrenal glands may show uptake greater than background levels and equal to or slightly greater than liver activity.
We found that mean maximum SUV was higher for the left normal adrenal gland than for the right. Although adrenal glands vary significantly in size and shape, there is both anatomic and radiologic evidence that the left adrenal gland tends to be slightly larger than the right (13). In a CT study, Karstaedt et al. found that when only one adrenal gland was visualized, it was most often the left (14% [left] vs. 1.5% [right]). In addition, although most often visualized in transaxial CT images as a thin inverted Y or arrowhead configuration (60%), the left adrenal gland had a thick triangular mass appearance more often than did the right (40% [left] vs. 3% [right]) and was thicker than the right (6.7 mm [left] vs. 5.1 mm [right]) (14). We believe this size difference likely resulted in the slightly higher SUVs because of less partial-volume averaging.
A potential limitation of this study is that a biopsy was not performed on the adrenal glands to exclude lymphoma involvement; they were screened only with CT to exclude enlargement or a focal tumor mass. However, prior studies have shown that lymphoma involvement in the adrenal is rare, occurring in only 1%–4% of patients (5–9). Also, no hormonal measurements were made to look for the possibility of stress-induced adrenal activation.
Readers of 18F-FDG PET studies need to be cautioned that the SUVs reported in this study are based on images acquired 2 h after injection and that SUVs are dependent on the time from injection to imaging (15,16). Therefore, the values reported in this study apply only to a 2-h imaging time and cannot be compared with other reported SUVs, which may have been calculated at different times after 18F-FDG injection.
In the single case of significant bilateral adrenal uptake, the CT scan was again reviewed and confirmed that the adrenal glands were of normal size. A review of the patient’s medical chart also showed no clinical findings to suggest adrenal hyperplasia or Cushing’s disease.
CONCLUSION
In patients with a low pretest likelihood of adrenal pathology, 18F-FDG PET/CT provided more reliable visualization of the normal adrenal gland than did PET alone. Readers of 18F-FDG PET/CT need to be aware of the wide range of normal adrenal uptake.
Footnotes
Received Nov. 20, 2003; revision accepted Jan. 29, 2004.
For correspondence or reprints contact: Alan H. Maurer, MD, Temple University Hospital, Broad and Ontario Streets, Philadelphia, PA 19140.
E-mail: amaurer{at}temple.edu


Jump to section
Related Articles
Cited By...
- Utilisation of combined 18F-FDG PET/CT scan for differential diagnosis between benign and malignant adrenal enlargement
- Modern Nuclear Imaging for Paragangliomas: Beyond SPECT
- Fluorodesoxyglucose uptake in the remaining adrenal glands during the follow-up of patients with adrenocortical carcinoma: do not consider it as malignancy
- Upper pole of a duplex kidney mimicking adrenal incidentaloma in 18F-fluoro-2-deoxy-D-glucose positron emission tomography: a pitfall in diagnosis
- Modern Treatment of Lung Cancer: CASE 3. Non-Metastatic Bilateral F-18 Fluorodeoxyglucose Avid Adrenal Glands in Non-Small-Cell Lung Cancer
- [18F]fluoro-2-deoxy-D-glucose ([18F]FDG) positron emission tomography imaging of thymic carcinoid tumor presenting with recurrent Cushing's syndrome