


Abstract
Differential diagnosis of pancreatic lesions still remains a problem. Whereas CT provides high spatial resolution, PET detects malignant lesions with high sensitivity. The objective of this study was to evaluate the clinical benefit of PET/CT image fusion in the diagnostic workup of pancreatic cancer. Methods: One hundred four patients with suspected pancreatic lesion underwent triple-phase multidetector CT and 18F-FDG PET scanning. Voxel-based retrospective registration and fusion of CT and PET were performed with recently developed software. CT, PET, and fused images were assessed by 2 radiologists with regard to the detection of malignancies, possible infiltration of adjacent tissue or lymph nodes, or distant metastases. Results: Fusion of CT and PET images was technically successful in 96.2%. In 2 cases, paraaortic lymph node infiltration was detected only by image fusion; in a further 8 cases, lymph node metastases were confirmed with improved localization. In 5 patients, additional pancreatic tumors or distant metastases only suspected during PET scanning were confirmed. Image fusion improved the sensitivity of malignancy detection from 76.6% (CT) and 84.4% (PET) to 89.1% (image fusion). Compared with CT alone, image fusion increased the sensitivity of detecting tissue infiltration to 68.2%, but at the cost of decreased specificity. Conclusion: The most important supplementary finding supplied by image fusion is a more precise correlation with focal tracer hot spots in PET. Image fusion improved the sensitivity of differentiating between benign and malignant pancreatic lesions with no significant change in specificity. All image modalities failed to stage lymph node involvement.
With an incidence rate of 10 cases per 100,000 people per year, cancer of the pancreas is the third most common malignancy of the gastrointestinal tract. Successful therapy depends on early diagnosis, since treatment with curative intent is possible only in International Union Against Cancer stage I or stage T2 N0 M0—that is, only in cases where the cancer is still confined to the organ itself. Surgery of the more advanced stages is being performed in some centers, but so far it has not become a routine procedure. One of the clinical problems lies in the difficulty of differentiating reliably between pancreatic malignancy and focal chronic pancreatitis—in particular, when taking into account the fact that long-term pancreatitis is a risk factor in pancreatic cancer (1).
The primary task of diagnostic imaging is detecting any pancreatic lesion and differentiating between malignant and benign (e.g., inflammatory) changes in the pancreas. Furthermore, imaging should ideally be able to permit staging of the tumor. In the case of pancreatic cancer, any infiltration of the vessels and lymph nodes as well as possible distant metastases take on special importance due to their impact on the assessment of resectability of the tumor or the decision to initiate chemotherapy (2).
CT and MRI only provide morphologic information and thus fail staging in several pancreatic tumors. Since it permits the evaluation of a possible malignancy with a fairly high degree of sensitivity, the use of PET increased steadily over the past years. Limitations of PET are unspecific tracer uptake in inflammatory changes such as acute pancreatitis as well as the lack of anatomic information in these functional images. Quite often the necessary spatial correlation of a hot spot with anatomic structures is severely constrained. Digital fusion of PET with CT would open up the possibility of aligning the functional PET information with the spatial data provided by CT (3).
The objective of this study was to introduce retrospective PET/CT image fusion into clinical practice to improve the diagnosis of pancreatic cancer and to evaluate its impact on the detection, differentiation, and staging of such malignancies.
MATERIALS AND METHODS
In this prospective study, 104 patients underwent a diagnostic CT and PET workup (53 female, 51 male; age range, 23–84 y; median age, 64 y). The time interval for collecting the data was >2 y (August 1999 to December 2001). CT and PET were performed in a median interval of 3 d (range, 1–6 d). The criterion for inclusion in the study was a suspected pancreatic lesion. A recently developed software program using an established registration algorithm was used to fuse and document the CT and PET images. All 3 image modalities (i.e., CT, PET, and fused images) were assessed separately by 2 experienced radiologists using standardized questionnaires. Diagnosis was subsequently confirmed by the histologic findings obtained during surgical resection (n = 53), exploratory surgery (n = 25), or percutaneous needle aspiration biopsy (n = 16). Histologic confirmation was achieved within a median time interval of 16 d (range, 5–35 d). Ten patients with a clinically and radiologically stable course for a minimum of 1 y were considered as having a benign process.
CT Studies
The CT studies were performed using a triple-phase technique with a quadruple-line multislice CT scanner (Somatom Plus 4 Volume Zoom; Siemens AG). Patients were positioned in prone position with their arms raised above the head to avoid beam-hardening artifacts. To ensure similarity of CT and PET data, CT scans were performed in a respiratory midposition and without gastric filling. After planning the investigation on an anteroposterior scout radiograph, a noncontrast study of the upper abdomen was acquired (120 kV; 165 mA; collimation, 4 × 5 mm; table feed, 20 mm; pitch, 1; reconstruction interval, 8 mm). Eighteen seconds after initiating the intravenous administration of 100 mL iopromide (Ultravist 370; Schering AG), a contrast-enhanced acquisition was started during both the arterial phase (collimation, 4 × 1 mm; table feed, 4 mm; pitch, 1; reconstruction interval, 5 mm) and the venous phase 80 s after beginning with the intravenous administration of the contrast agent (collimation, 4 × 1 mm; table feed, 4 mm; pitch, 1; reconstruction interval, 8 mm). Image fusion was based on the arterial phase.
PET Scans
The PET scans were performed with an ECAT EXACT 47 scanner (Siemens AG). The blood glucose level of each patient was determined before he or she underwent PET scanning. Patients whose blood glucose level exceeded 110 mg/dL were excluded from the study. Scans were performed in prone position and no breathing commands were given throughout the scan. Intravenous administration of 5 MBq 18F-FDG per kilogram of body weight was followed by a 2-dimensional (2D) whole-body PET scan with integrated transmission measurement and iterative image reconstruction. An uptake period of 60–90 min was adhered to before the actual image acquisition. Contrary to the CT studies, the patients kept their arms alongside the body. Glucose uptake was quantified by the standard uptake value (SUV), with an SUV of >3.5 considered as indicative of malignancy (4). For definite assessment of a pancreatic mass, both the SUV value and visual aspects were considered. After inclusion of the last patient, a receiver operating characteristic (ROC) analysis of SUV values was performed to verify the cutoff point between benign and malignant lesions.
Image Fusion
Image fusion was performed with a software program based on the commercially available AVS Express (Advanced Visualization Systems) package, extended by custom-written software modules as part of this study. All calculations were run on an O2-workstation (Silicon Graphics). For this, the CT and PET images were transferred onto the workstation as DICOM (Digital Imaging and Communications in Medicine) images via the Intranet. The CT images were registered to PET images using a fully automatic voxel-based algorithm. Our method uses an independent implementation (5) of an algorithm for multiresolution optimization of the well-proven normalized mutual information image similarity measure (6). After registration, the coregistered images were reconstructed and visualized in the coronal and axial planes to perform plausibility testing—that is, a physician reviews the images and checks them for misregistration visually. Alignment in all 3 planes was assessed by checking the body outline and the position of metabolically active organs (heart, liver, kidney, and urinary bladder). Any registration not regarded as plausible was rejected from further analysis.
Once registered, the software allows the multimodality data to be viewed in different ways, either as a fused tomogram or as a full-fledged 3-dimensional scene using operator-defined combinations of volume and surface rendering. The preferred mode of presentation for this study is 2D transparent image overlay. Each pixel in the foreground image (usually a color-encoded slice from the PET image) is assigned a level of transparency (α-value) based on its intensity. High intensities are shown opaque, whereas low intensities are transparent. The PET pixels with varying transparencies are then overlaid onto the corresponding CT slice, which is encoded as gray values. The fused images were printed on a color printer as transparencies or paper hard copies.
Two radiologists evaluated the original CT and PET images as well as the fused images in a randomized order in 3 different settings with an interval of 2 wk each. Using a standardized questionnaire, the following aspects were assessed and compared with the gold standard:
Presence of a benign or malignant lesion
Possible infiltration of tissue adjacent to the pancreas (fuzzy outline of the organ, infiltration of peripancreatic fatty tissue or duodenum) or infiltration of one of the following vessels (tumor encasement ≥ 50% (7)) to assess resectability: superior mesenteric vein; confluence of the superior mesenteric, splenic, and portal vein; superior mesenteric artery; splenic artery; common hepatic artery; celiac axis (8–10)
Presence of any locoregional lymph node metastasis (CT criterion: diameter, >1 cm; PET criterion: focal tracer hot spots)
Presence of any other manifestation of the tumor—for example, liver metastases or other abdominal metastases
RESULTS
Image fusion was performed in 100 of the 104 patients (96.2%) enrolled in this study and then compared with the gold standard (histologic confirmation or clinical course over 1 y). In 4 patients, image fusion was technically impossible due to severe differences in body position between the 2 imaging modalities. After the data were transferred to the workstation, image registration and fusion took an average of 35 min (range, 25–50 min; median, 37 min).
In the 100 patients evaluated, the final diagnosis of a malignant tumor was made in 64 patients (64.0%), whereas 36 patients (36.0%) were assessed as having a benign pancreatic disorder. Within the malignancies, adenocarcinoma of the pancreas was most prevalent (n = 57), whereas the benign lesions were dominated by chronic pancreatitis (n = 28) (Table 1).
Distribution of Diagnosis
Detection of Malignancy
Sixty-four malignant pancreatic tumors were histopathologically proven (diameter, 0.5–3.8 cm; mean, 2.2 cm). With regard to the detection of malignancy by individual modalities, CT only detected 49 of the 64 malignant tumors. On the other hand, 23 of the 36 benign disorders were diagnosed correctly (true-positive, n = 49; false-positive, n = 13; false-negative, n = 15; true-negative, n = 23). For malignancy detection by CT, this results in a sensitivity of 76.6% and a specificity of 63.9%.
PET detected 54 of the 64 malignancies and 22 of the 36 benign lesions (true-positive, n = 54; false-positive, n = 14; false-negative, n = 10; true-negative, n = 22). This results in a sensitivity of 84.4% and a specificity of 61.1%. The retrospective ROC analysis confirmed an SUV of 3.5 as the best cutoff point for differentiation between benign and malignant lesions (Fig. 1).

ROC analysis of SUV values. Area under ROC curve = 0.801; SE = 0.052; calculated cutoff point, SUV > 3.5 for detection of malignancy.
Image fusion of the CT and PET images detected 57 of the 64 malignancies and 23 of the 36 benign lesions (true-positive, n = 57; false-positive, n = 13; false-negative, n = 7; true-negative, n = 23). For malignancy detection by image fusion, this results in a sensitivity of 89.1% and a specificity of 63.9% (Figs. 2 and 3). An additional finding was the increase of safety relating to the localization of PET focuses compared with the solitary evaluation of CT images.

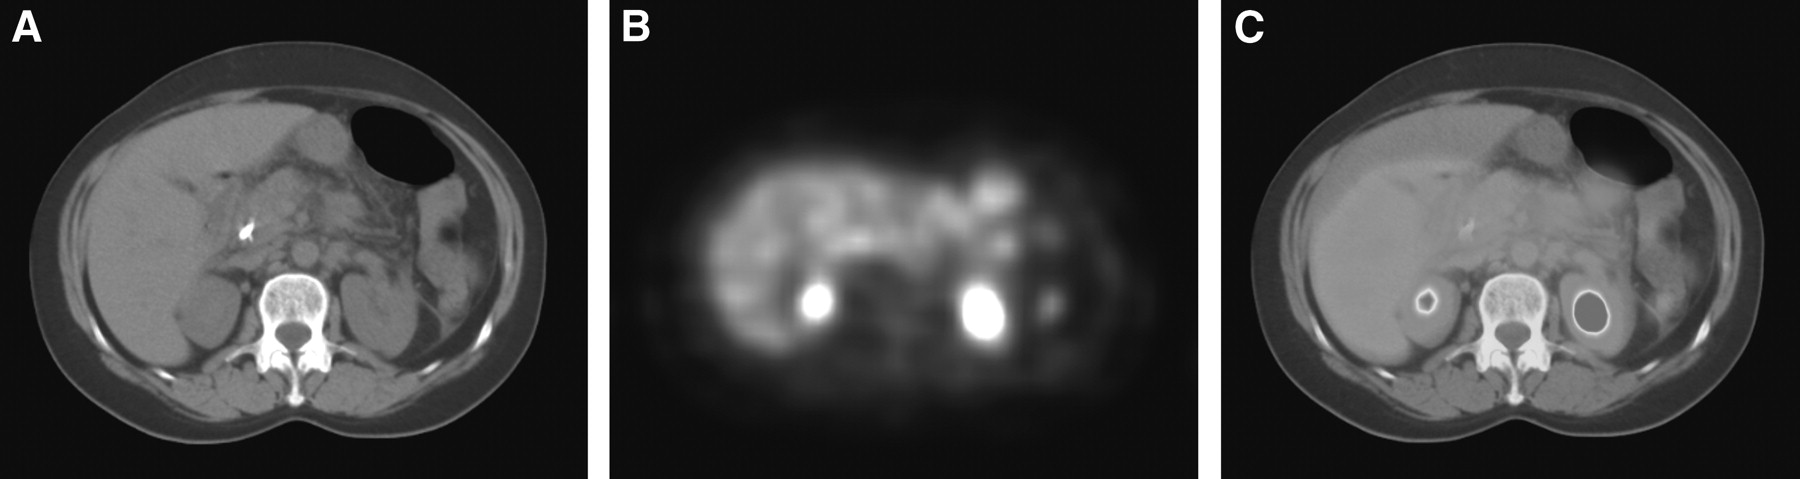
A 45-y-old male patient with long-term chronic pancreatitis. (A) Clear enlargement of pancreatic head on arterial helical CT. (B) Increased tracer uptake on 18F-FDG PET located on retroperitoneal space; SUV of 2.4 leads to diagnosis of inflammatory process (arrow). (C) Image fusion enables definite localization of focal uptake onto pancreatic head.

A 63-y-old female patient with laparoscopically proven pancreatic carcinoma. (A) Slight enlargement of pancreatic head and without circumscribed tumor on helical CT in arterial phase; suspicion of liver lesions. (B) Marked tracer uptake on 18F-FDG PET in middle abdomen without definite anatomic identification; SUV > 3.5 leads to diagnosis of malignant lesion; additional liver metastases. (C) On image fusion, tracer accumulations are projected on pancreatic body and right liver lobe, proving the presence of hepatic metastases of pancreatic carcinoma.
Although the results relating to the detection of malignancy did not differ statistically significant (Greenhouse–Geisser test, P > 0.05), image fusion offered a huge benefit for the 8 true-positive assessed patients additionally detected with image fusion compared with CT.
Infiltration of Adjacent Tissue
Forty-seven patients of the study population had complete histologic analysis (resection or exploratory surgery) and were suitable for evaluation of tumorous infiltration of adjacent tissue. Statistical parameters of CT and image fusion were assessed but not discussed due to the high prevalence of infiltration (94%). If a pancreatic tumor is detected, an infiltration must be assumed.
Lymph Node Metastases
Of the 31 patients with confirmed lymph node metastasis (diameter, 0.4–2.1 cm; mean, 1.2 cm), CT and PET were able to identify 8 and image fusion was able to identify 10 cases. Image fusion was able to detect additional lymph node metastasis in 2 cases. In one case, CT detected a lymph node with an enlarged diameter of almost 2 cm, which did not show up on PET at all. In another case, a distinct paraaortic focal tracer hot spot identified on PET scans was aligned on CT scans with an obviously normal lymph node (Fig. 4). The other lymph node metastases remained undetected because of their small size (Table 2).

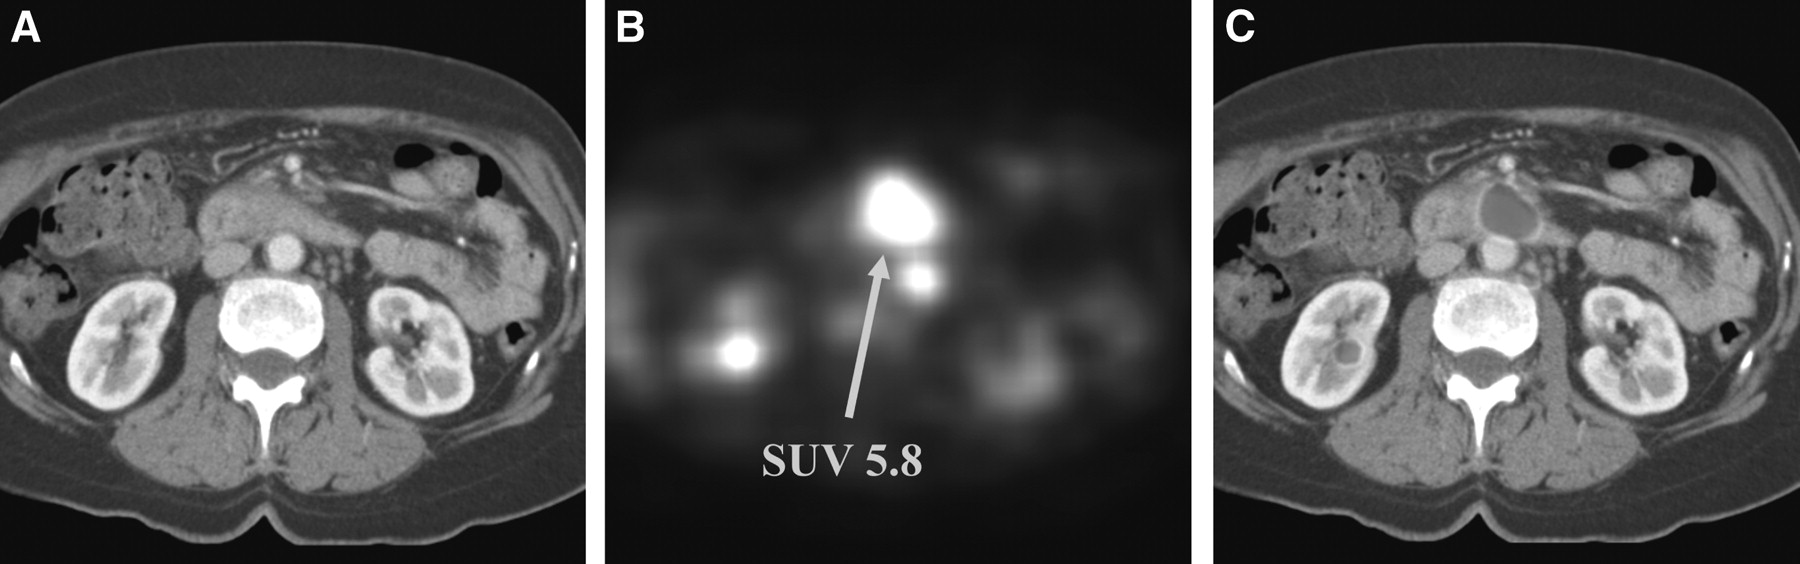
A 54-y-old female patient with surgically proven pancreatic carcinoma. (A) Helical CT demonstrates circumscribed thickening of pancreatic body and atrophy of pancreatic tail commonly seen as indirect sign for malignancy of pancreas. (B) 18F-FDG PET verifies pancreatic carcinoma with SUV of 5.8 and demonstrates additional lesion posterior to first lesion. (C) Image fusion allocates second tumor to unsuspected lymph node on CT representing lymph node metastases.
Statistical Evaluation of Examination Parameter (Greenhouse–Geisser Test)
Distant Metastases
Relating to the question of distant metastases, CT had an inherent disadvantage compared with PET, because PET is capable of imaging the whole body, whereas in the present study CT only was limited on the abdominal region. Therefore, pulmonary tumor manifestation was found in 6 patients using the PET images. In a total of 5 patients, PET raised the suspicion of additional intraabdominal metastases, which then were confirmed by image fusion. Previously unknown liver metastases were detected in 3 cases, and a second pancreatic tumor was detected in 2 cases (Fig. 5). All distant metastases were confirmed histopathologically by biopsy (n = 8) or surgically (n = 6); the lesion diameter ranged from 0.4 to 3.2 cm (mean, 1.2 cm).
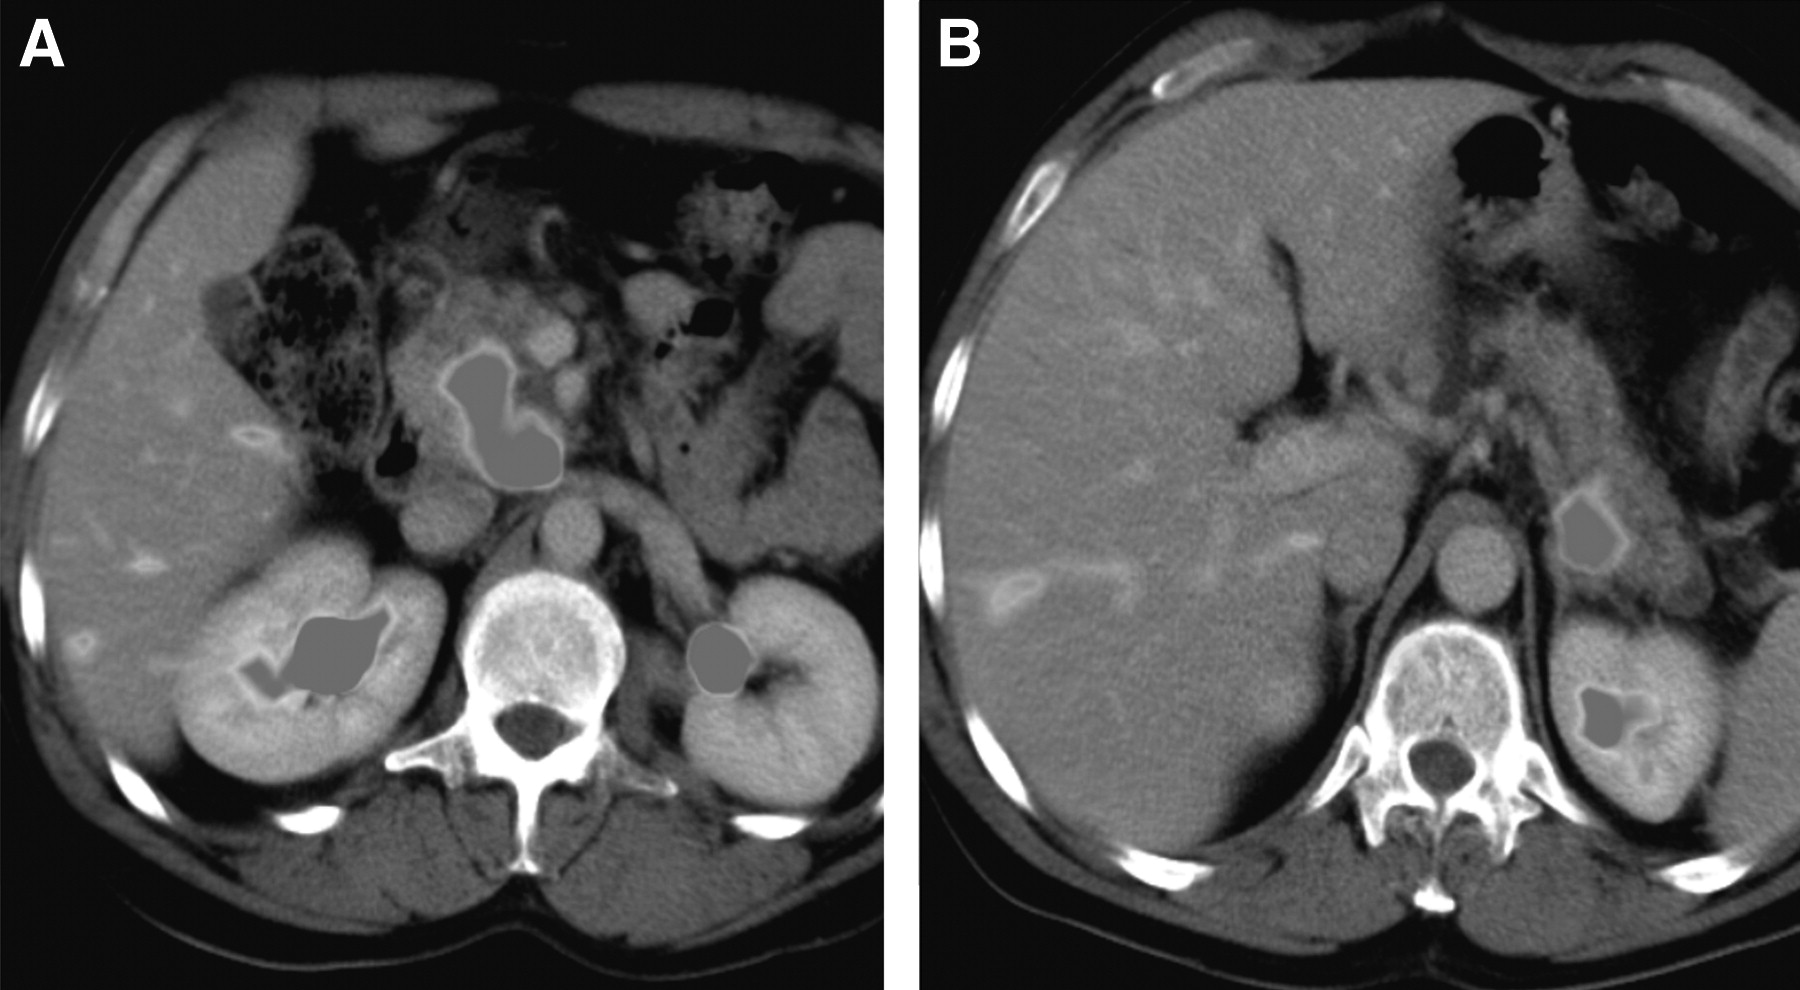
A 62-y-old male patient with surgically proven pancreatic carcinoma. (A) Detection of large pancreatic head carcinoma on retrospective image fusion of helical CT and 18F-FDG PET. (B) Detection of additional pancreatic lesion not evident before image fusion.
DISCUSSION
Digital image fusion is a procedure developed in recent years, which enables spatially correct superposition of data from 2 or more different imaging modalities, thus combining the advantages of each modality. In clinical practice, image fusion has to measure up against the individual imaging modalities with regard to sensitivity and specificity. The discussion on the fundamental necessity of image fusion started with the advent of hybrid PET/CT scanners and is still going on. While Ell and von Schulthess point out the enormous potential and advantages of image fusion (11), Jager et al. doubt the clinical need for image fusion (12). According to Jager et al., in a wide clinical spectrum of FDG PET studies there is only a need to look at the CT scans in 20% of the patients. Studies on the necessity of visual fusion, software fusion, or hardware fusion (using PET/CT) do not exist.
There are encouraging reports in the literature for selected organ systems dealing with the benefit of image fusion relative to the individual modalities. Schaffler et al. fused CT and PET images in 19 patients with abdominal or pelvic malignancies and demonstrated an improvement in the topographic correlation of the lesion as well as in the differentiation between necrosis and active tumor (13). In general, the most important advantage of fusing CT and PET images is the firm correlation of tracer hot spots in PET with the anatomic structures visualized on CT. In the present study, image fusion increased the sensitivity of detecting cancer of the pancreas by about 5%. Since no investigations have been published with regard to the benefit of image fusion in pancreatic tumors, this emphasizes the pilot function of our study. When looking at the infiltration of adjacent tissue, the sensitivity of image fusion improved by 20% compared with CT, but at the cost of a decrease in specificity. The diagnosis of distant metastases with the help of image fusion reveals the problem that usually CT only covers the region of interest, whereas PET is performed as a whole-body scan. The future routine use of fast low-dose CT may allow whole body acquisition.
Accuracy of Image Fusion
Accuracy of image fusion has been stated well in early publications (14,15) but, as far as possible, it must be ensured that both modalities image the same region of the body with no change in its condition (i.e., filling of stomach and bowel, position of upper extremities). For instance, CT scanning of the pancreas is often performed as hydro-CT, while PET imaging is run without gastric loading to avoid gastric contractions, which otherwise would result in increased glucose levels within the gastric wall (16). In CT studies, the fluid-filled stomach displaces adjacent organs, which could lead to misregistration or misalignment of PET activity when superimposed on the structures imaged by CT. To avoid these problems in the current study, CT was performed without gastric filling. the position of the arms in CT and PET is standardized and could not be changed. For CT studies, the arms had to be raised above the head to avoid beam-hardening artifacts; in PET scanning with the scanner used, the arms are kept alongside the body because of the long acquisition time required. Additionally, in PET, blurred organ outlines occur due to respiratory motion during the acquisition period of up to 40 min. The latter problem can be ameliorated by shallow breathing during PET and respiratory midposition during CT. Aside from this, the newest PET generation allows markedly shorter examination time (average bed stop, about 8–10 min) with advanced reconstruction techniques. In the present study, meaningful registration proved to be impractical in 4 patients because of the differences between the images due to severe patient motion (Fig. 6); for image fusion, this resulted in a technical feasibility of 96.2%. The problem might be solved in the future by so-called nonrigid or elastic registration methods, which are capable of correcting for local organ motion or deformation between 2 image acquisitions. The current disadvantage of these still experimental procedures is the long time required by the computations (17), but the use of a shared-memory supercomputer offers the possibility of performing complex nonrigid registrations in only a few minutes (18).

A 45-y-old female patient with clinical suspicion of pancreatic mass. (A) On helical CT, enlargement of pancreatic head and documentation of stent within hepaticocholedochic duct. (B) Corresponding 18F-FDG PET slice demonstrates markedly smaller liver; pancreatic head is not delineated. (C) In this case, image fusion is unadaptable, because incongruent breathing excursions during CT and PET examinations result in misregistration of images in upper abdominal area.
Imaging using hybrid PET/CT scanners, which permit CT and PET scanning in the same study, should improve the rate of successful image fusion but is also fraught with drawbacks and problems. Early hybrid PET/CT scanners provided reduced image quality compared with conventional systems. This problem was solved by integrating state-of-the-art scanners into hybrid systems. Since the CT and PET studies are performed sequentially, it is tempting to rely on the image fusion without questioning; however, there is a time gap between the 2 studies and, thus, the possibility of altered patient positioning. Finally, retrospective image fusion is not limited to CT and PET registration but is available to all tomographic images. It is quite conceivable to integrate images from other imaging centers via digital media (optic disk, network).
CT
CT is a well-established modality in diagnostic imaging and staging of pancreatic cancer. The introduction of fast multidetector spiral CT has made it possible to study the pancreas during different perfusion phases of the organ. Some groups consider CT scanning during the arterial phase of the perfusion as being advantageous in the diagnostic workup of pancreatic cancer, since a large percentage of the cancer tissue is fibrotic, thus resulting in hypoperfusion of this region at that point in time. Some studies demonstrated an advantage for multiphase CT (19). Although performance of hydro-CT (oral contrast enhancement with 800–1,000 mL of water) has become the practice in some institutions due to a better delineation of the pancreas from the posterior gastric wall (20–22), it was not used in the current study to achieve similarity to PET.
In the 100 patients investigated in this study, CT detected malignancies with a sensitivity of 76.6% and a specificity of 63.9%. Thus, our results are much lower than those in other publications. For instance, Catalano et al. studied a total of 46 patients and reported a sensitivity of 97.0% and a specificity of 80.0% (23). Possible explanations are the size of the lesions in the study population and the degree of awareness of the investigators assessing the images. Several studies have demonstrated that CT cannot be relied on to detect lesions with a diameter of <2 cm (20,24–27). However, the primary objective in the diagnostic workup of the pancreas must be the early detection of small malignancies, something that present-day CT seems hard pressed to do. The studies published so far do not break down the lesions according to size, but the percentage of small tumors was substantial and the investigators assessing the lesions did not have any knowledge of the clinical picture. In the literature, the resectability of pancreatic cancer usually is assessed according to presence of infiltration of adjacent tissue or vessels, lymph nodes, and distant metastases. Quite often, these 3 parameters are lumped together, which renders any comparison of the studies more difficult. With regard to the sensitivity, specificity, and accuracy in the detection of vascular infiltration, Furukawa et al. reported values of 83.0%, 100.0%, and 89.0%, respectively (28). Lu et al. reported a sensitivity of 84.0% and a specificity of 98.0% (7), which was confirmed by Bluemke et al. (29). The percentages for infiltration of adjacent tissue given in older publications state an accuracy of 37.0%–45.0%, which is much closer to the results of the present study (30,31). Despite optimum technology, CT still faces the perplexing problem of insufficient contrast between the lesion and the surrounding tissue, particularly when dealing with small tumors. Although some publications demonstrate that combined arterial and venous phase CT scanning will detect even small lesions, the probability of detection seems to be rather small (20,24–26). The discouraging results of lymph node assessment can be explained due to their small diameter (average, 1.2 cm), which is next to the cutoff size (>1 cm) usually used to differentiate between benign and malignant lymph nodes.
PET
PET offers the possibility of studying quite sensitively glucose metabolism, which exhibits different degrees of elevation in inflammation and malignancy. Glucose uptake in the tissue can be measured quantitatively by the SUV. However, glucose uptake depends on numerous factors, which may lower the sensitivity and specificity of the PET study. Differentiation between inflammatory and malignant processes is based on the SUV. The limit of 3.5 chosen in the present study conforms to the values chosen by other groups and our own experience. On the other hand, other limits have also been reported in the literature—for example, Zimny et al. regard an SUV of 6.4 as dealing with a malignancy but accept a range of ±3.6 (32). In a study population of 106 patients, the mean SUV in the case of inflammatory changes is given as 3.4 ± 1.7. Berberat et al. reported a mean SUV of 3.09 for cancer and 0.87 for inflammation (33). The reasons for the difficulty in defining a clear-cut value may be due to actual overlapping of inflammatory and malignant changes in the pancreas but also may be due to differences in the study protocol.
Compared with the present study, other publications have reported better results for FDG PET detection of pancreatic cancer. Berberat et al. found a sensitivity of 94% and a specificity of 88.0% in their 80 patients, whereas Bares et al. reported a sensitivity of 92.0% and a specificity of 85.0% for their group of 40 patients (33,34). Unfortunately, no details are given for the study protocol, which makes comparison of the results more difficult. But there is the note that any false-negative result was diagnosed either in hyperglycemic patients or in those with early tumor stages. The study by Bares et al. primarily enrolled patients with enlarged pancreatic lesions suspected on CT as being malignant. This preselection could explain the excellent results. For their study population of 106 patients, Zimny et al. reported a sensitivity of 89.0% and a specificity of 53.0%, but they evaluated their data only visually (32). The large number of false-negative results was explained as being due to patients with an elevated blood glucose level. After exclusion of this group of patients from the study population, PET exhibited a sensitivity of 98.0%; from this it was concluded that the blood glucose level must be considered as well when evaluating PET. In the present study, the blood glucose level was already accounted for as part of the inclusion criteria. The large number of false-negative patients can be explained with the appearance of tumors in early stages with limited extent. There is no general agreement on the benefit of quantitative assessment by means of the SUV; for instance, Zimny et al. dispute the benefit of the SUV, whereas other authors consider the SUV a valid parameter (32,35). Zimny et al. reported data on PET detection in lymph node and distant metastases, with a correct result of 40.0% in lymph node metastases and 52.0% in distant metastases. Bares et al. compared PET with CT and ultrasound with regard to possible lymph node metastases and found a sensitivity of 76.0% for PET, 42.0% for CT, and 8.0% for ultrasound. A subsequent study of a larger number of patients lowered the value to 61.0% (34,36,37). The poor detection rate of lymph node metastases presumably has several causes. Most of the lymph node metastases that were found were located in the peripancreatic space and could not be differentiated from the pancreatic tumor. Additionally, as mentioned for CT, the mean size of infiltrated lymph nodes must be considered.
CONCLUSION
Detection and localization of small pancreatic malignancies still remain a challenge in radiology. Besides improvements in the established imaging modalities (CT, MRI), image fusion is another simple and robust alternative for more certainty in the diagnosis and localization of pancreatic lesions. Image fusion is technically feasible without flaws in >95% of cases, saving the patient additional imaging studies. In pancreatic cancer, image fusion permits a more accurate assessment of the criteria for resection, and it also enables correct anatomic localization of small lesions. In metastatic cancer of the pancreas, image fusion yields a more accurate diagnosis of the lymph node status if PET has detected metabolic activity, but, in fact, all methods failed to stage lymph node involvement. Although a statistically significant level was not reached, image fusion improved the sensitivity, specificity, as well as negative and positive predictive values with regard to the differentiation between benign and malignant pancreatic processes. Further improvements in image fusion seem possible by optimizing the study protocols of the imaging modalities to be fused and by technical modifications to the registration software (optimizing the current algorithms; introducing algorithms for elastic registration). Already today, software-based retrospective image fusion is a reliable, easy-to-use, and economically prized alternative when it comes to combining different imaging modalities and correlating the specific data of the individual modalities.
Acknowledgments
This work was supported by a grant from the Deutsche Forschungsgemeinschaft Graduiertenkolleg 331 and was supported in part by the National Science Foundation (grant EIA-0104114).
Footnotes
Received Dec. 14, 2003; revision accepted Feb. 5, 2004.
For correspondence or reprints contact: Arne-Jörn Lemke, MD, Universitätsklinikum Charité, Campus Virchow-Klinikum, Klinik für Strahlenheilkunde, Medizinische Fakultät der Humboldt-Universität zu Berlin, Augustenburger Platz 1, D-13353 Berlin, Germany.
E-mail: lemke{at}charite.de
REFERENCES


Jump to section
Related Articles
Cited By...
- PET/CT for Pancreatic Malignancy: Potential and Pitfalls
- Biology and management of pancreatic cancer
- Gene Expression Patterns and Tumor Uptake of 18F-FDG, 18F-FLT, and 18F-FEC in PET/MRI of an Orthotopic Mouse Xenotransplantation Model of Pancreatic Cancer
- Biology and management of pancreatic cancer
- Combined PET/CT colonography: is this the way forward?
- Characterization of Hyperinsulinism in Infancy Assessed with PET and 18F-Fluoro-L-DOPA