

FIGURE 2.

FIGURE 2.
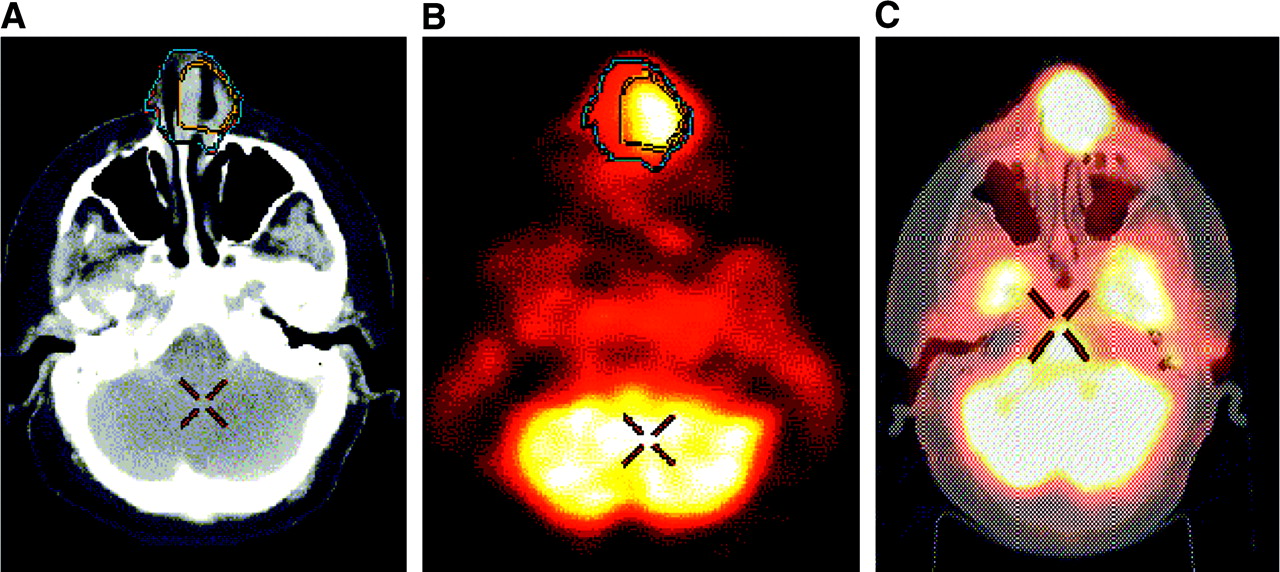
PET contour contained within corresponding CT contour (patient 5). CT (A), corresponding color-enhanced 18F-FDG PET (B), and coregistered images (C). Extent of CT GTV is indicated by blue contour (A and B). Corresponding PET contour is in yellow (A and B). This example demonstrates an 18F-FDG–avid region within CT-defined GTV.
In this issue


Related Articles
Cited By...
- 18F-Fdg-PET-guided Planning and Re-Planning (Adaptive) Radiotherapy in Head and Neck Cancer: Current State of Art
- Workflow and Radiation Safety Implications of 18F-FDG PET/CT Scans for Radiotherapy Planning
- Positron emission tomography imaging approaches for external beam radiation therapies: current status and future developments
- Autocontouring and Manual Contouring: Which Is the Better Method for Target Delineation Using 18F-FDG PET/CT in Non-Small Cell Lung Cancer?
- 18F-FDG PET/CT for Image-Guided and Intensity-Modulated Radiotherapy
- Metabolic Tumor Volume of [18F]-Fluorodeoxyglucose Positron Emission Tomography/Computed Tomography Predicts Short-Term Outcome to Radiotherapy With or Without Chemotherapy in Pharyngeal Cancer
- PET Changes Management and Improves Prognostic Stratification in Patients with Head and Neck Cancer: Results of a Multicenter Prospective Study
- Treatment Monitoring by 18F-FDG PET/CT in Patients with Sarcomas: Interobserver Variability of Quantitative Parameters in Treatment-Induced Changes in Histopathologically Responding and Nonresponding Tumors
- The role of PET/CT scanning in radiotherapy planning
- Advanced imaging applied to radiotherapy planning in head and neck cancer: a clinical review.
- Expanding Role of Positron Emission Tomography in Cancer of the Uterine Cervix
- The contribution of PET/CT to improved patient management
- Comparison of Different Methods for Delineation of 18F-FDG PET-Positive Tissue for Target Volume Definition in Radiotherapy of Patients with Non-Small Cell Lung Cancer
- Staging of Untreated Squamous Cell Carcinoma of Buccal Mucosa with 18F-FDG PET: Comparison with Head and Neck CT/MRI and Histopathology