


Abstract
The accurate quantification of brain radioactivity concentration is limited by the spatial resolution of the PET scanner for structures smaller than 2–3 times the resolution. In the presence of enlarged cerebrospinal fluid spaces or regions of cortical neuronal loss, a significant underestimation of gray-matter radioactivity concentration due to the resulting partial-volume averaging can potentially occur. To recover the true radioactivity concentration from PET data, algorithms that use the high-resolution anatomic information provided by MRI have been developed. Their effect on PET quantification has been assessed using regions of interest and non–operator-dependent voxel-based analyses such as statistical parametric mapping (SPM), although the mechanisms that lead to an improvement in PET quantification after partial-volume correction (PVC), compared with no PVC, have not been addressed. Methods: We studied the influence of our previously described MRI-based PVC algorithm on SPM analysis of age effects on μ-opioid receptor (μ-OR) binding using 11C-carfentanil PET in 14 healthy subjects (age range, 29–74 y). Results: μ-OR binding increased with age at a rate of about 0.9% per year in the left temporal cortex after PVC, consistent with the results obtained from human autoradiographic studies. Without PVC, no significant relationship with age was observed. PVC decreased mainly the residual variability of voxel μ-OR binding values around the age regression line. Conclusion: MRI-based PVC improves the sensitivity and accuracy of voxel-based statistical analysis of PET data.
The PET response to a point source of radioactivity yields a blurred image called the point spread function (PSF), an index of scanner blur, which limits the ability to resolve small objects. This intrinsic blur also limits the quantitative accuracy of PET measurements and results in an incorrect estimate of radioactivity concentration in small structures (1). The observed radioactivity concentration in small structures differs from the true concentration because of blurring of counts out of the structure (“spill-out”) and blurring of counts into the structure from surrounding radioactivity (“spill-in”). We and others have developed algorithms to correct for these so-called partial-volume effects and recover the true radioactivity concentration by combining an accurate measure of brain anatomic structure size provided by high-resolution MRI with coregistered PET images (2–4).
Previous studies describing the development and validation of such partial-volume correction (PVC) approaches have used regions of interest (ROIs) and, more recently, Statistical Parametric Mapping (SPM), a voxel-driven analytic technique that does not require a priori identification of ROIs (5). The combination of PVC with SPM has shown improved sensitivity for the detection of differences in regional cerebral metabolic rate of glucose between controls and patients with Alzheimer’s disease (6). This improvement was attributed to a decrease in interindividual variability in glucose metabolism or to atrophy in elderly controls that obscured the metabolic differences. To better understand the underlying mechanisms leading to an improvement in PET data analysis with PVC, compared with no PVC, we studied the effect of age on regional μ-OR binding in healthy controls.
Our study used data from an ongoing project examining the adaptive neuronal response to aging. We have recently used PET to characterize changes in μ-opiate receptor (μ-OR) binding with 11C-carfentanil PET and ROI analysis (7). Because cerebral atrophy increases with advancing age (8,9), we combined the use of PVC and SPM to analyze age-associated changes in μ-OR in 14 healthy humans using 11C-carfentanil PET.
MATERIALS AND METHODS
Subjects
Ten male and 4 female healthy controls (mean age [±SD], 43.6 ± 13.0 y; range, 29–74 y) without a history of a medical disorder, medication use, or illegal drug use were recruited at the Johns Hopkins University School of Medicine. The women had not taken hormone treatments (birth control pills or replacement therapy) for the last 6 mo before the study. The Johns Hopkins Joint Committee on Clinical Investigation approved the study protocol, and all subjects signed a consent form before inclusion in the study. For each subject, a single PET scan using 11C-carfentanil, a synthetic highly specific μ-OR agonist (10), was used to measure brain μ-OR binding (11).
MRI Acquisition
A thermoplastic mask individually fitted to each subject’s face was first created for immobilization and structural localization with MRI during PET acquisition using a standard technique previously published (2). MR images were also used for PVC of PET data and were acquired using a 1.5-T Signa Advantage system (GE Medical Systems) and a 3-dimensional sequence (spoiled gradient-recalled acquisition in the steady state) with the following parameters: repetition time, 50 ms; echo time, 5 ms; flip angle, 45°; number of excitations, 1; field of view, 24 × 24 cm; slice thickness, 1.5 mm; and reconstruction matrix, 256 × 256, yielding an in-plane pixel size of 0.93 × 0.93 mm.
PET Acquisition
PET data were acquired in 2-dimensional mode on a 4096 Plus PET scanner (GE Medical Systems) with an axial field of view of 10.3 cm. A 10-min transmission scan was first obtained using rotating 68Ge rods and was followed by a 90-min series of emission scans after intravenous bolus administration of 740 ± 74 MBq of 11C-carfentanil with an average specific activity of 81.4 ± 25.9 GBq/μmol. 11C-Carfentanil was synthesized via the reaction of 11C-methyliodide and a nor-methyl precursor (10). Fifteen axial slices extending from the inferior temporal gyrus to the high- convexity region were acquired simultaneously along a plane parallel to a line passing through the center of the amygdala and the occipital cortex during 25 time points (6 × 30 s, 5 × 60 s, 5 × 120 s, and 9 × 480 s). After correction for attenuation using the transmission scan, data were reconstructed using a ramp reconstruction filter into 128 × 128 2-mm pixel matrices and were decay corrected. The final resolution with these parameters was 7 and 8 mm in the transverse (in-plane) and axial directions, respectively, and the slice separation (center-to-center distance) was 6.5 mm.
MRI-Based PVC
A fully automated PVC algorithm was implemented in MATLAB 5 (The MathWorks, Inc.) and was run as a toolbox in SPM99. PVC processing time to obtain a partial-volume–corrected PET image from an MR image and a raw PET image was approximately 15–20 min per study on a 440-MHz processor (Ultra 10; Sun Microsystems, Inc.) with 1 GB of main memory. The application performs 8 major steps to achieve MRI-based PVC of PET images. The steps, based on the theory and algorithm previously developed by us (3,4), are summarized below and in the following equation: IGM = (IOBS − IWM XWM ⊗ h − ICSF XCSF ⊗ h)/XGM ⊗ h, where ⊗ = a convolution operator, h = the 3-dimensional PSF of the PET scanner, IGM = the radioactivity concentration (assumed to be spatially homogeneous) within the gray matter (GM), IOBS = the observed PET image; IWM = the PET value for WM (assumed to be homogeneous), ICSF = the PET value for CSF (assumed to be homogeneous), XWM = the spatial distribution of WM voxels, XCSF = the spatial distribution of CSF voxels, and XGM = the spatial distribution of GM voxels.
Step 1.
The subject-specific MR image was segmented into 3 compartments, GM, white matter (WM), and cerebrospinal fluid (CSF), using probability maps in SPM99. A little radiofrequency (RF) nonuniformity correction was chosen for MR segmentation to compensate for the differences in position of intracranial structures within the MRI head coil (12).
Step 2.
Voxels were assigned into GM, WM, and CSF tissue classes according to the maximum probability encountered for each voxel across the 3 datasets. These 3 tissue classes were subsequently binarized (given a value of 0 for absence of tissue and 1 for presence of tissue).
Step 3.
A mock-PET dataset was simulated from the binarized MR image by weighting the corresponding tissue classes with realistic, empirically determined relative values (GM × 1.0 + WM × 0.3 + CSF × 0.1) and smoothing using a 3-dimensional gaussian kernel approximation of the PSF of the PET scanner. This allows a mock-PET–PET intramodality coregistration, which we have found to be faster and more efficient than MRI–PET coregistration.
Step 4.
The MR image was coregistered to the PET image using the simulated PET data and applying the resultant transformation matrix to the output of step 2. At this point, the binarized GM, WM, and CSF were resliced using nearest-neighbor interpolation to remain in the space (i.e., dimensions and voxel size) of the MR image.
Step 5.
The GM, WM, and CSF binarized images were convolved using a 3-dimensional gaussian kernel corresponding to the PSF of the PET scanner.
Step 6.
The smoothed data were resliced and resampled to the space of the PET image using trilinear interpolation.
Step 7.
The WM and CSF averages were determined by applying a much higher-probability threshold (P > 0.90) to the output from step 1 to classify and binarize only voxels that had a high probability of being the respective tissue. After coregistration and reslicing, these 2 files were smoothed to the resolution of the PET scanner, and another threshold (P > 0.95) was applied to get the subset of WM and CSF voxels that were relatively unaffected by coregistration and smoothing. These WM and CSF voxels were used as a mask to sample the observed PET image and compute a reliable estimate of the average WM and CSF activity.
Step 8.
The scaled WM and CSF compartments obtained after multiplying by the respective average WM and CSF activities were subtracted from the observed PET scan to correct for spill-in of counts from the surrounding medium to GM voxels. Finally, the partial-volume–corrected PET image was obtained by dividing this quantity by the GM recovery coefficients image (GM from the output of step 5) to correct for spill-out of counts from the GM voxels to the surrounding medium. Because the recovery coefficients image also contains low recovery coefficients, a correction mask including only voxels greater than 0.21 (empirically determined value) in the GM recovery coefficients image (where the value varied between 0 and 1) was used to avoid large correction amplification.
Segmentation and Inhomogeneity Correction.
SPM99 uses a clustering algorithm that classifies MR voxels into GM, WM, and CSF on the basis of their intensities and a priori information about their spatial localization, derived from probability maps obtained from many healthy subjects. To minimize partial-volume effects between tissue types, high-resolution and contrast T1-weighted MR images were obtained, and a little RF nonuniformity correction (12) was applied to correct for smooth intensity variations in the MR image. This correction was based on the approximate amount of nonuniformity in our MRI data but does not compensate for systematic biases in the segmentation method that result from a decrease in GM/WM contrast with aging.
In both young and elderly subjects, the MR segmentation algorithm performed well as assessed visually by the high spatial concordance of gray nuclei and cortical structures (i.e., small cortical sulci) between the actual MR image and the GM tissue class as well as other tissue classes. The mismatch in resolution between our MRI data (0.93 × 0.93 × 1.5 mm) and the SPM template (2 × 2 × 2 mm) used for MR segmentation did not introduce any noticeable segmentation inaccuracies as a result of partial-volume averaging. More formal assessment of the quality of segmentation using simulated data (12) has shown that this segmentation method is robust and accurate for high-quality T1-weighted MR images, such as our MRI data. However, some voxels were misclassified as GM at the interface of WM and ventricles. A small amount of nonbrain tissue was also misclassified as GM but was removed almost entirely using morphologic operations in SPM99, by which rendered surface brain is extracted. To improve tissue classification, segmented data for which the probability varied between 0 and 1 were binarized by finding for each voxel its maximum probability among the 3 classes of tissue and assigning this voxel to the appropriate class. In contrast to another study, in which only voxels with P > 0.33 (13) in each of the 3 tissue classes were kept, no additional threshold needed to be applied to our data because no differences were noted between data for which a threshold of P > 0.33 was applied and data for which it was not.
MR–PET Coregistration.
To register MRI segments with PET data, a simulated PET image was first obtained after convolving a weighted sum of the 3 MRI brain compartments to the PSF of the actual PET data. Parameters describing the rigid-body registration between simulated and actual PET images were estimated, and the transformation was applied to MRI brain compartments. The minimization of the squared differences between the simulated PET image and the actual PET image used the Gauss–Newton optimization and in all cases converged rapidly, giving high registration accuracy that was comparable to the level of accuracy achieved by automated MRI–PET (14) or MRI–SPECT with SPM registration (15) based on a similar methodology. To preserve voxel intensities and the ratio of brain to nonbrain present in the original high-resolution MRI data, nearest-neighbor interpolation was used to reslice the registered MR image to MRI space.
Smoothing to Obtain Recovery Coefficients (Spill-out Correction).
Data were convolved with a slightly overestimated PET PSF and resliced to the PET space using trilinear interpolation to compensate for MRI data downsampling. The measured PET PSF was shown to present a 5%–22% variation within 10 cm of the center of the field of view, where the subject’s head is usually confined, which may translate into less than a 7% error in GM recovery coefficients based on PVC simulations (16). These simulations have also shown that errors due to resolution mismatch between convolved MRI data and PET are less severe when scanner resolution is overestimated, as in our study, than when scanner resolution is underestimated, indicating that conservative estimates of PET resolution are accompanied by a more accurate PVC.
Spill-in Correction.
Prior PET experiments after naloxone blockade (11) have shown low and uniform activity in the WM, consistent with the low levels of μ-OR reported by autoradiographic studies (17) and the assumption of WM homogeneity of this PVC algorithm. Simulations found that a 10% variation in WM uniformity will result in less than a 1% error in PVC if WM homogeneity is assumed.
The rationale for this step was to obtain an average WM value from WM voxels that were spatially remote from GM to avoid spill-in of GM activity. For this purpose, a high-probability threshold (P > 0.90) was applied to the WM segments to classify and binarize only voxels that have a very high probability of being WM voxels. After coregistration and reslicing, these subsets of voxels were smoothed to the resolution of the PET scanner and another threshold (P > 0.95) was applied to get the subset of WM voxels relatively unaffected by coregistration and smoothing. These voxels were located at greater than 2 times the PET resolution from any GM voxel in the actual PET or MR image and were consequently relatively unaffected by GM spill-in. These WM voxels are used as a mask to sample the observed PET image and compute a reliable estimate of the average WM activity. Because, in a normal-sized ventricular system, spill-in from GM is likely to contaminate all CSF voxels, CSF radioactivity can be measured invasively by lumbar puncture or noninvasively with PET only in subjects with an enlarged ventricular system. In this study, the assumption of near-zero CSF activity at equilibrium after intravenous administration of 11C-carfentanil is consistent with the low CSF radioactivity that we measured recently using a high-resolution PET scanner in subjects with an enlarged ventricular system (unpublished data, 2003).
Correction Mask.
Finally, a correction mask including only voxels greater than 0.21 in the GM recovery coefficients image (in which values vary between 0 and 1) was used to avoid large correction amplification due to low recovery coefficients at the image periphery. This threshold, empirically determined, resulted in the best tradeoff in sensitivity and specificity in identifying GM voxels because it preserved GM voxels of interest but removed misclassified voxels at interfaces between GM or WM and CSF where the recovery coefficient was small.
Data Processing and Analysis
Data with and without PVC were processed identically using the software packages SPM99 (Wellcome Department of Cognitive Neurology, Institute of Neurology, University College London) and Analyze (Mayo Foundation) running on a SUN workstation (Sun Microsystems). Statistical analysis of volumes of interest (VOIs) used the general linear modeling program SuperAnova (Abacus Concepts, Inc.) and Dataplot software (National Institute of Standards and Technology).
Spatial Normalization and Smoothing.
First, 0- to 90-min average images were created to generate an image with high anatomic detail. This image was then normalized to an 11C-carfentanil template (average, 0–90 min) in a standard space (Montreal Neurological Institute [MNI]) having voxel size equal to 2 × 2 × 2 mm, and the transformation matrix was applied to the 34- to 82-min average image of the non-PVC and PVC data used for subsequent analysis (18). Stereotactic normalization used a 12-parameter affine transformation followed by nonlinear deformations using a linear combination of 3-dimensional discrete cosine transform basis functions (4 × 5 × 4) and 12 nonlinear iterations with medium nonlinear regularization (19). Parametric maps of μ-OR binding were calculated using a tissue-ratio measure ([regional counts/mean occipital counts] − 1) of the spatially normalized average 34- to 82-min data, where the mean occipital counts represented the nonspecific binding. The tissue-ratio measure is proportional to the binding potential Bmax/KD, where Bmax represents the total receptor density and KD is the affinity constant. The tissue-ratio measure is independent of changes in tracer transport resulting from alterations in regional CBF (20). Data were smoothed using a 12-mm FWHM gaussian smoothing kernel to a final isotropic resolution of approximately 14 mm.
Statistical Analysis and Results.
The relationship between μ-OR binding and age was determined at each voxel using the general linear model (21). Analysis of covariance (ANCOVA) was used to remove the confounding effect (nuisance covariate) of intersubject differences in global μ-OR binding (21) to obtain adjusted μ-OR binding values at each voxel. Regional effects of age were assessed using linear regression of μ-OR binding with age at each voxel, which resulted in a t statistic at each voxel and an associated P value. Correction of the P value for the multiple comparisons of voxels in the total volume S used random-field-theory formulas and took into account the high correlation between contiguous voxels due to the image reconstruction process and smoothing (22). Connected sets or clusters of voxels were considered significant if they survived a height threshold of P ≤ 0.001 (uncorrected) and their spatial extent k (size) at this threshold had a volume greater than 49 voxels, the spatial resolution of the PET scanner (i.e., PET resolution/voxel volume = 7 × 7 × 8 mm/2 × 2 × 2 mm).
VOI Analysis of the Age Regression on μ-OR Binding.
The mean adjusted value computed over all voxels in significant clusters shown by PVC was obtained for each subject and compared with mean adjusted values obtained by sampling exactly the same spatial location on non-PVC data (after lowering the height threshold). A test of homogeneity of slopes of the linear regression of age on adjusted μ-OR binding for PVC and non-PVC data was obtained. One-factor ANCOVA with non-PVC and PVC data as grouping nominal variables, age as a covariate, and μ-OR as a dependent variable was used to assess statistical differences in regression slopes. In addition, the correlation coefficients between age and non-PVC data and between age and PVC data for each cluster were assessed for significant statistical differences using the method of Cohen and Cohen (23).
Rate of Change with Age in the Absolute Amount of GM.
To assess how regional differences in GM volume in native space (before spatial normalization to MNI space) may influence PVC, spatially normalized GM segments were multiplied (modulated) by the Jacobean determinants calculated from the spatial normalization process. This produced a measure of absolute amount (density) of GM in native space (12,24), in contrast to nonmodulated data, for which a measure of relative amount (concentration) of GM is obtained. These images were then smoothed with a 12-mm gaussian kernel. Statistical analysis used ANCOVA to remove global differences in GM density, and contrasts [1 0 0] and [−1 0 0] were used to assess, respectively, positive and negative correlation of GM density with age. VOIs were placed on significant clusters, and the percentage change in GM density per year was computed.
RESULTS
Mean Global μ-OR Binding
The mean global μ-OR bindings obtained before PVC (mean [± SD], 1.13 ± 0.30; range, 0.85–1.99) and after PVC (mean, 1.35 ± 0.45; range, 0.93–2.64) correlated positively (R2 = 0.91, F1,12 = 117.8, P < 0.0001, PVC = 1.45 × non-PVC − 0.29) and significantly increased after PVC (paired t test, df = 13, t = −4.27, P = 0.0009). The mean global μ-OR binding increased with age before PVC (R2 = 0.50, F1,12 = 12.2, P = 0.0045) and after PVC (R2 = 0.50, F1,12 = 12.02, P = 0.0047).
Linear Age Effect
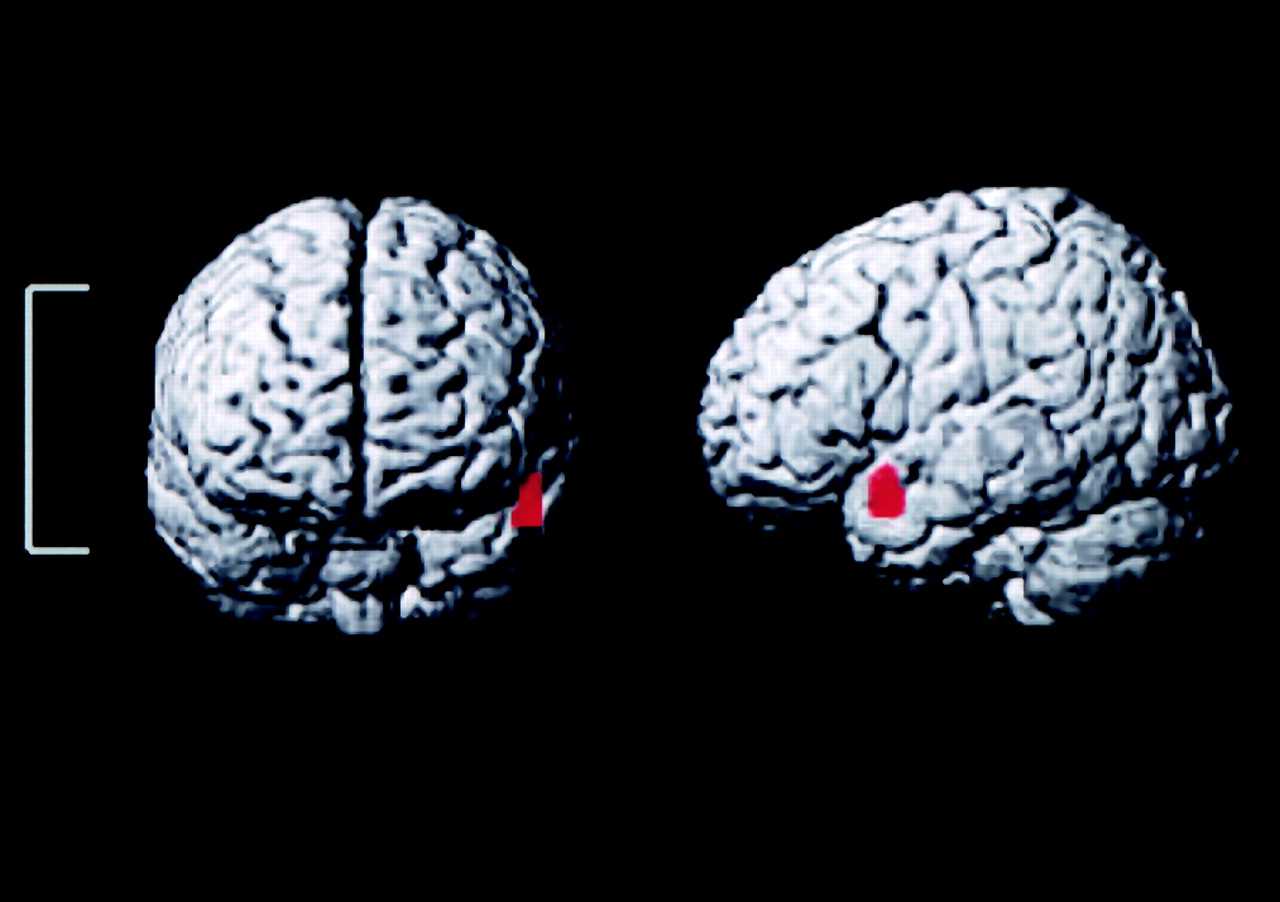
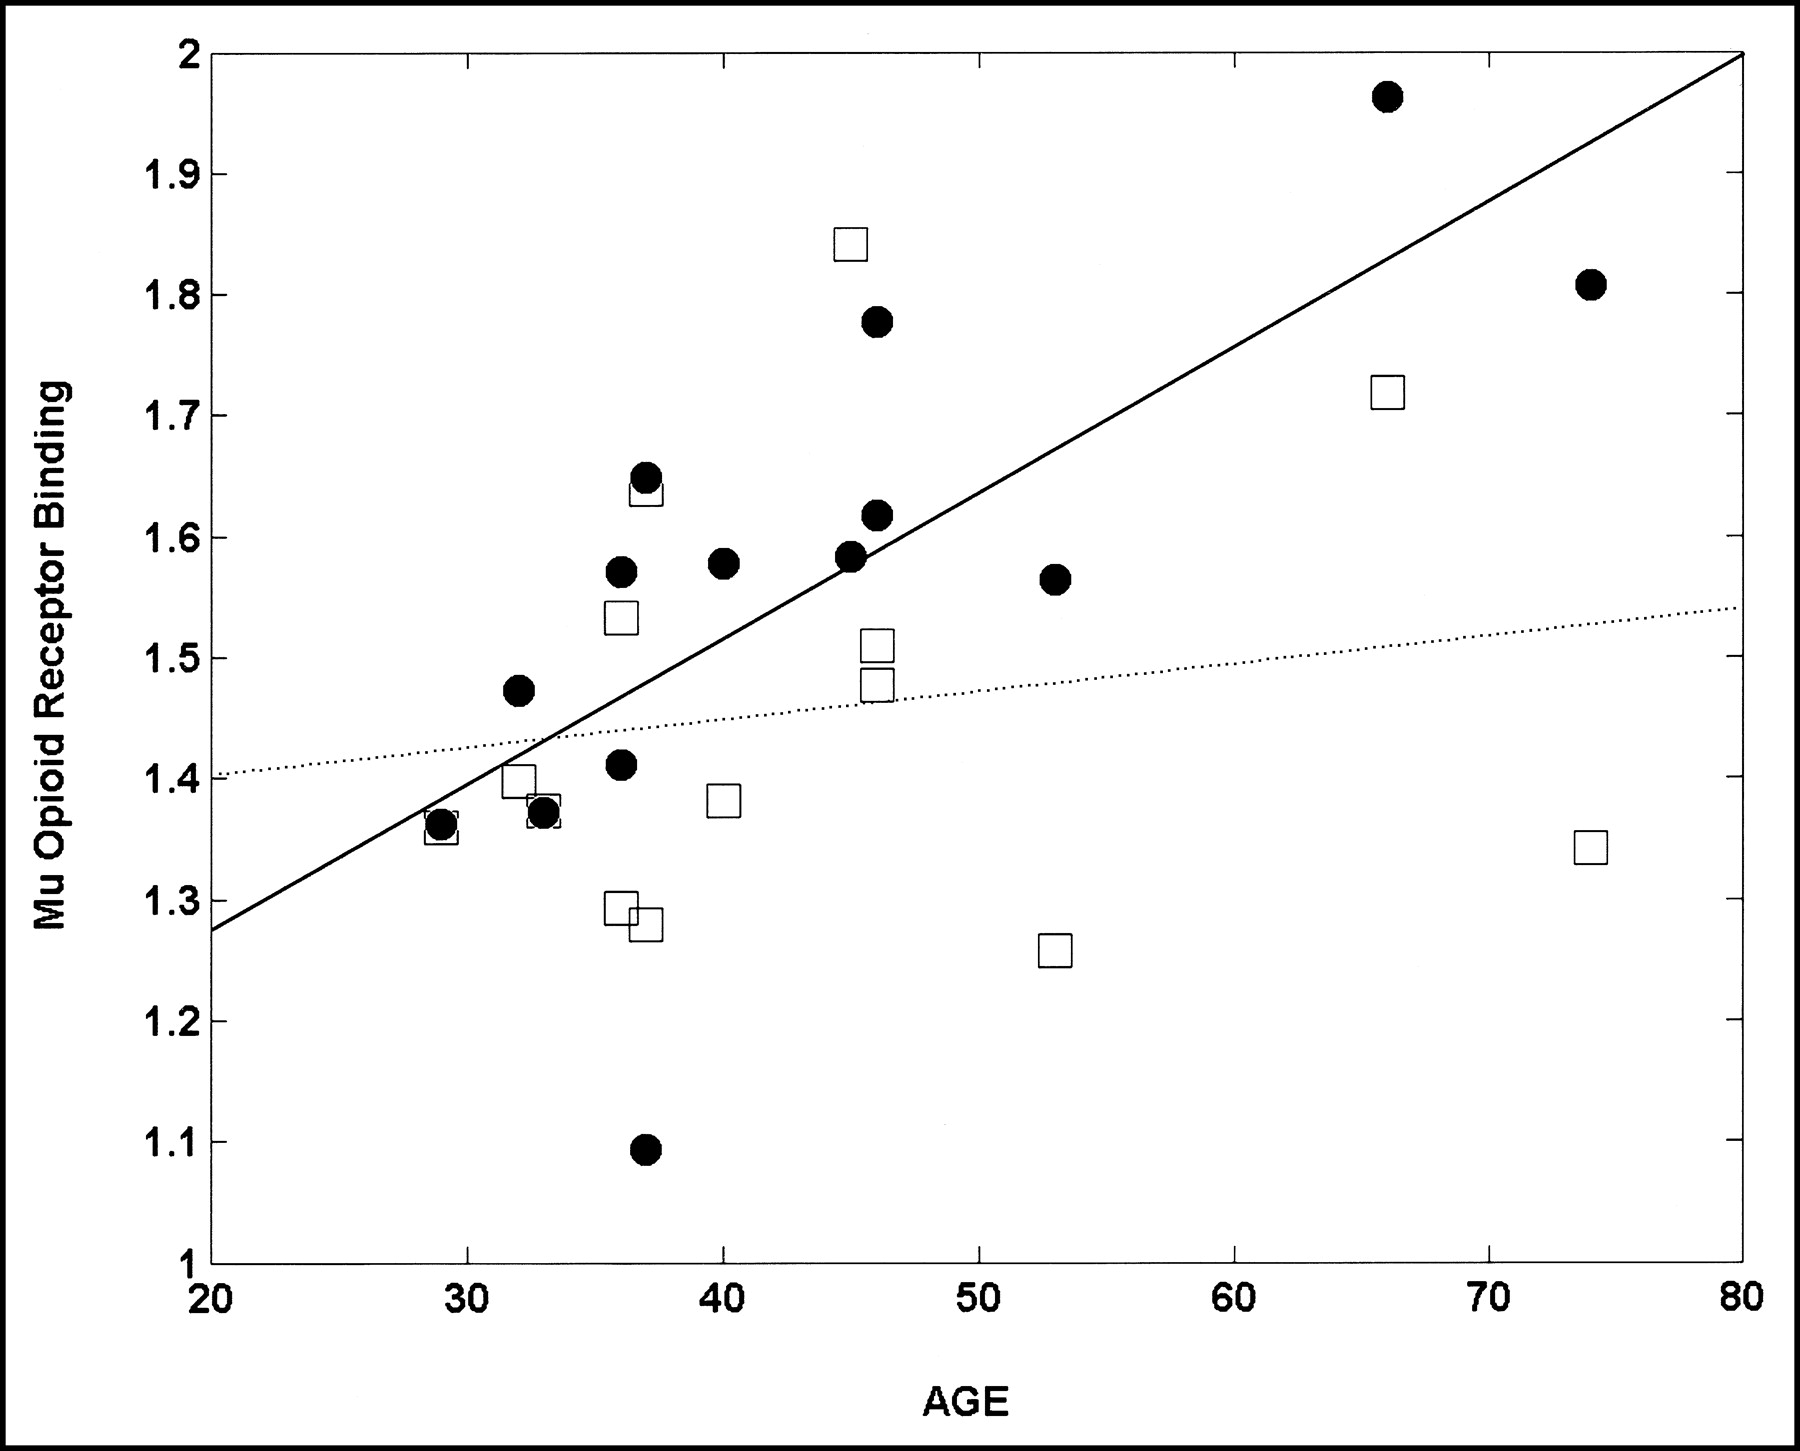
No brain regions showed a positive correlation between μ-OR binding and age before PVC. After PVC, a positive correlation between μ-OR binding and age was found in the left middle and superior temporal cortex (k = 82, Pcorr = 0.16, tmax = 6.99, zmax = 4.23 at x = −52, y = 10, and z = −26) (Fig. 1). The percentage increase per year was 0.9% (μ-OR = 1.03 + 0.012 × age) after PVC, in contrast to a 0.1% (μ-OR = 1.36 + 0.002 × age) increase per year in an equivalent location on non-PVC data (Fig. 2). No brain regions showed a negative correlation between μ-OR binding and age before or after PVC.

Age-associated increase in regional brain μ-OR binding in the left temporal cortex after PVC. Before PVC, regional brain μ-OR binding did not significantly increase with age. The bracket on the left shows brain regions included in the PET axial field of view.

A plot of the temporal cluster μ-OR binding values for the PVC data and a similar location in non-PVC data shows a steeper age regression line and less residual variability for the PVC data (•) than for the non-PVC data (□).
Assessment of Age Regression Slopes and Correlation Coefficients Using VOI Analysis
A trend (P = 0.06) was found toward a significantly steeper slope of the regression line in the temporal cluster after PVC, compared with that from an equivalent location in non-PVC data.
A positive correlation between adjusted μ-OR binding and age was found for the temporal cluster after PVC (r = 0.73, F1,12 = 13.6, P = 0.003) but not for an equivalent location in non-PVC data (r = 0.17, F1,12 = 0.37, P = 0.55). Because the validity of statistical tests used to assess significant differences in correlation coefficients depends on the 2 samples belonging to the same distribution, normal probability and quantile–quantile plots for each cluster were first obtained. These plots for the PVC temporal cluster and its equivalent location in non-PVC data were linear or very close to linear, consistent with a similar normal distribution of these data. The Anderson–Darling statistics (AD) (25) computed for the PVC temporal cluster (AD = 0.27) and its equivalent location in non-PVC data (AD = 0.52) were less than the critical value at α = 0.05 (AD = 0.70), indicating that both distributions were approximately normal. Consequently, a t statistic (11 df) was used to assess differences in correlation coefficients using previously published formulas (23). The t values equal to 2.85 (P = 0.01, 1-sided test) indicate a significant increase in correlation after PVC, compared with non-PVC data.
Rate of Change with Age of the GM Compartments
A trend was found toward decreased global GM volume with age (R2 = 0.26, F1,12 = 4.31, P = 0.06, GM = −0.001 × age + 0.36). Negative correlations between GM density and age were found using the voxel-based analysis in the left temporal, frontal, and parietal cortices (k = 7361, Pcorr = 0.000, tmax = 7.81 [zmax = 4.57], at x = −60, y = −8, and z = 38).
The regional rate of GM decrease in the temporal cluster was approximately 0.66% per year at x = −52, y = 10, and z = −26 and significantly correlated with age (R2 = 0.45, F1,12 = 9.9, P = 0.008, GM = −0.0025 × age + 0.56).
DISCUSSION
The major finding of this study was that the application of PVC to an SPM analysis of age-associated changes in brain μ-OR is accompanied by the emergence of a highly significant cluster that was not present before PVC. The improved cluster detectability observed after PVC results from the decreased influence of GM volume/density variability on the voxel values as a function of age. These findings suggest that the use of PVC can result in the detection of regional brain abnormalities using smaller group sample sizes. Furthermore, the accuracy of PET quantification can be improved by accounting for loss of GM volume.
The emergence of a cluster showing a significant relationship with age after PVC could result from a steeper slope of the age regression line or a decrease in residual variability of the data around this line. An increase in the slope of the age regression line after PVC was hypothesized a priori because a more pronounced recovery of PET activity was expected in elderly subjects after PVC because of GM reduction and CSF expansion (i.e., atrophy and accompanying partial-volume effects). GM atrophy with age translates into higher GM values after PVC and steeper slopes in age-regression lines. In the temporal cluster, the GM decrease of only 0.66% per year was accompanied by a trend toward an increase in slope after PVC, compared with non-PVC data, suggesting that this small rate of change is the limiting factor in determining the significance of change in regression slope. A decrease in residual variability of the data around the age regression line was observed after PVC, compared with non-PVC data, which resulted in a significant improvement in the correlation coefficient between age and μ-OR binding in the temporal cluster. Because there is individual variability in both μ-OR binding and GM amount (i.e., partial-volume effects), reducing or eliminating the variability stemming from GM atrophy reduces total variability, thus enhancing the overall sensitivity to detect true changes. This reduction in variability observed in subjects with varying amounts of atrophy after PVC, compared with non-PVC data, could potentially provide greater power to detect changes in a given sample size. Accordingly, an age-related increase in μ-OR binding was observed after PVC only in the middle temporal cortex, in agreement with a postmortem study that showed a significant increase in μ-OR in the same region (17).
Comparison of the current results with a previous study using ROI analysis (7) is difficult, since in the current study data were stereotactically normalized, μ-OR binding values were adjusted using ANCOVA to correct for intersubject global differences in μ-OR binding, a different statistical analysis was used, and the population was smaller (n = 14, 10 male and 4 female) than that of the ROI study (n = 30; 12 male and 18 female). Despite these methodologic differences, there was good agreement for the regional localization of age-associated increase in μ-OR binding in the neocortex, although changes observed in the putamen and anterior cingulate cortex with ROIs were replicated by the voxel-based method only after lowering the height threshold to P < 0.05. With the voxel-based method and a height threshold of P < 0.05, large clusters of age-associated increase in μ-OR binding were found in the frontal, temporal, parietal, and anterior cingulate cortices and in the putamen (data not shown), which corresponded to the regions reported by ROI analysis (7).
Although our current study focused on μ-OR binding and aging, our results are potentially applicable to any situation in which atrophy may occur. As was the case here, atrophy is a common effect of aging, and research studies that use elderly populations are particularly susceptible to such effects. In relatively young subjects, neuropsychiatric diseases such as bulimia nervosa (26), addiction to cocaine (27), AIDS dementia complex (28), or alcohol dependence (29) are also accompanied by significant brain atrophy, which may confound comparisons with healthy subjects or introduce a significant bias when assessing relationships with behavioral measurements or treatment response. For example, in patients with Alzheimer’s disease, PVC improved neuropsychological correlations with regional glucose metabolism (30) and confirmed that the reduction in glucose metabolism observed in the neocortex before PVC was not an artifact due to partial-volume averaging with enlarged CSF spaces (6,30). Similarly, the decline with aging in serotonin type 2A receptors (31) and CBF (32) before PVC persisted for the serotonin receptors but not for CBF after PVC.
CONCLUSION
MRI-based PVC of PET data with subsequent voxel-based analysis showed that the spatial distribution of age-associated increases in μ-OR binding agreed with in vitro data, whereas no significant regional associations were seen before PVC. This study showed that MRI-based PVC improves sensitivity in detecting and quantifying neurobiologic changes in the presence of age-related brain atrophy. This can be particularly helpful whenever there is a possibility that structural changes due to the aging process or neuropsychiatric diseases will introduce a significant bias in PET quantitation.
Acknowledgments
The authors thank David Clough and Karen Edmonds for performing PET studies and Alexis J. Simich for providing administrative support. This work was supported by grants R01 AA11855-01, R01 AA11872-01A1, R01 DA12274-03, and R01 DA22774-03 from the National Institutes of Health and the National Institute on Drug Abuse.
Footnotes
Received Nov. 12, 2002; revision accepted Nov. 24, 2003.
For correspondence or reprints contact: James J. Frost, MD, PhD, Department of Radiology, The Johns Hopkins University School of Medicine, 601 N. Caroline St., JHOC 3225, Baltimore, MD 21287.
E-mail: jfrost{at}jhmi.edu
REFERENCES
In this issue


Jump to section
Related Articles
Cited By...
- MR Imaging-Based Correction for Partial Volume Effect Improves Detectability of Intractable Epileptogenic Foci on Iodine 123 Iomazenil Brain SPECT Images: An Extended Study with a Larger Sample Size
- Serotonin2A receptor binding potential in people with aggressive and violent behaviour
- Frontal lobe hypoperfusion and depressive symptoms in Alzheimer disease
- MRI-Based Correction for Partial-Volume Effect Improves Detectability of Intractable Epileptogenic Foci on 123I-Iomazenil Brain SPECT Images
- Characterization of Normal and Infarcted Rat Myocardium Using a Combination of Small-Animal PET and Clinical MRI