

FIGURE 3.
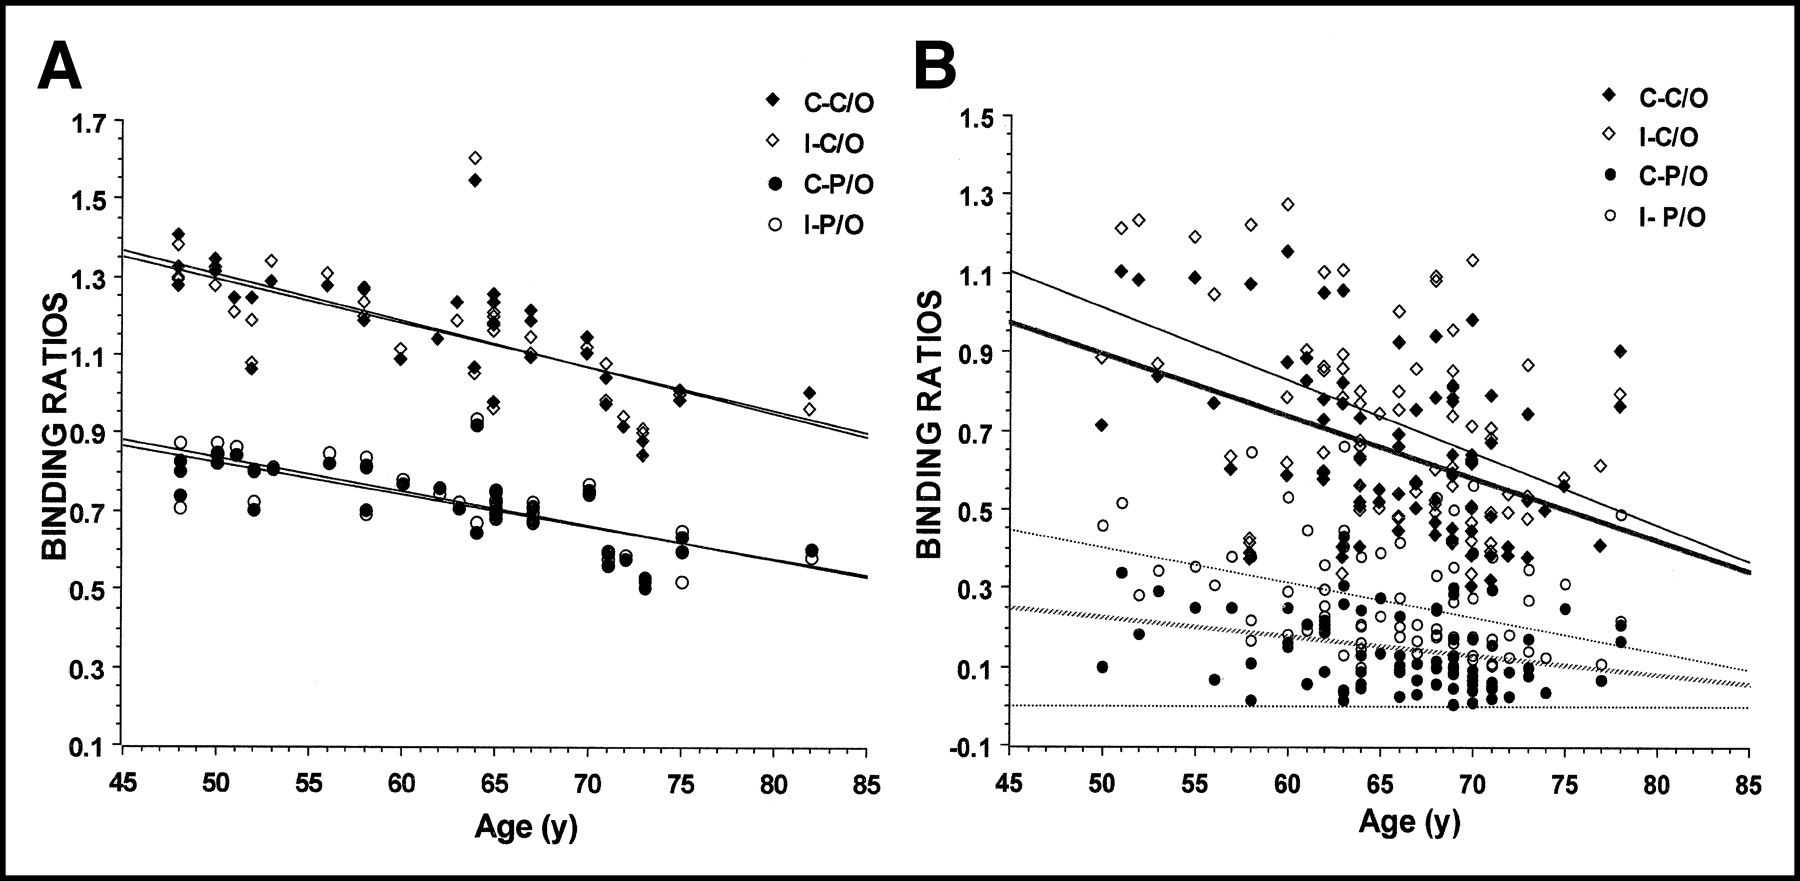
FIGURE 3.
The correlation of age and the C/O and P/O ratios in the controls (A) and PD patients (B). In the control group, the reduction of the binding ratios with normal aging was symmetric and even loss. The binding ratios also decreased with aging, except the contralateral P/O ratios in the PD patients with a similar duration and severity of disease (C-C/O, P = 0.0004; I-C/O, P = 0.016; C-P/O, P = 0.211; I-P/O, P = 0.045). The pattern of the age-related decline of binding ratios was quite different between the PD patients and the normal controls., regression line for C-C/O;, regression line for I-C/O; ····, regression line for C-P/O; ·····, regression line for I-P/O.


