


Abstract
We investigated the impact of the quantitation and reconstruction protocol on clinical tasks. The performance of standard clinical reconstruction procedures in discrimination tasks related to the diagnosis of prodromal Alzheimer’s disease (AD) was compared with the performance of a quantitative approach incorporating improved corrections for scatter, attenuation, intrinsic spatial resolution, and distance-dependent spatial resolution. Methods: Seventeen normal controls (normal group), 56 subjects who did not have dementia, who did have memory problems, but who did not develop AD within 5 y of follow-up (questionable group), and 27 subjects who did not have dementia, who did have memory problems, and who did develop AD over the follow-up period (converter group) were considered in this study. 99mTc-hexamethylpropyleneamine oxime SPECT and MRI studies were performed for each subject at baseline. The standard quantitation protocol (STD), routinely used in our clinic, consisted of Compton window scatter correction followed by filtered backprojection with attenuation correction using a uniform attenuation map. In the improved quantitative approach (QUAN), projections were corrected for scatter by use of a general spectral method and reconstructed by use of ordered-subset(s) expectation maximization, incorporating corrections for collimator response and attenuation using both a uniform attenuation map (QUANunif) and a nonuniform attenuation map (QUANnonunif). Mean SPECT activity concentration and MRI volume were estimated for 7 structures: rostral anterior cingulate gyrus, caudal anterior cingulate gyrus, posterior cingulate gyrus, hippocampus, basal forebrain, amygdala, and the banks of the superior temporal sulcus. Data were analyzed by pairwise discriminant analysis, and performance in binary group discrimination was measured by correlated receiver-operating-characteristic analysis. Results: The use of QUANnonunif yielded a small but systematic improvement in discrimination accuracy for normal versus converter groups (accuracy or area under the receiver-operating-characteristic curve [Az], 0.965), normal versus questionable groups (Az, 0.973), and questionable versus converter groups (Az, 0.881) compared with the results obtained with QUANunif (Az, 0.955, 0.962, and 0.866, respectively). Discrimination performance was significantly lower (P < 0.05) with STD than with QUAN in all 3 tasks (Az with STD, 0.906, 0.878, and 0.768, respectively). MRI volume estimation led to a lower overall performance in all 3 tasks than did QUANnonunif (Az with MRI, 0.947, 0.917, and 0.872, respectively). Conclusion: Improved quantitative image reconstruction with accurate compensation for scatter, attenuation, and variable collimator response led to significantly better performance in discrimination tasks related to the diagnosis of prodromal AD than did standard clinical reconstruction procedures. The use of a nonuniform brain attenuation map yields a small improvement in discrimination accuracy.
- quantitative brain SPECT
- prodromal Alzheimer’s disease
- iterative reconstruction
- attenuation correction
- scatter correction
- resolution recovery
Scatter, attenuation, and variable collimator response corrections are required for quantitative brain SPECT. In most clinical brain studies, however, uniform attenuation of the brain is assumed, and scatter and variable collimator response are ignored. Several studies have compared uniform and nonuniform attenuation correction schemes for quantitation in SPECT (1–4). These studies used simple phantoms or patients for whom no gold standard was available.
It is known that established Alzheimer’s disease (AD) is characterized by perfusion abnormalities; the most consistent finding in mildly or moderately impaired patients with probable AD is decreased perfusion, compared with that in controls, in the temporoparietal association neocortex (5–8). There is currently great interest in determining whether perfusion abnormalities precede overt disease. Identification of brain perfusion patterns that predict the subsequent development of AD has practical as well as theoretic significance; early prediction of AD would make it possible to implement strategies to prevent or delay dementia. Decreased perfusion in the posterior cingulate gyrus in prodromal AD has been reported in SPECT studies targeting specific volumes of interest (VOIs) (9,10). MRI studies reporting decreased volumes of various brain structures in prodromal AD also have been published (11–16). El Fakhri et al. previously identified and ranked brain regions involved in prodromal AD for clinical discrimination tasks with SPECT and MRI and showed that combining information from SPECT and MRI yields better performance than using information from either technique alone (17).
In this study, we compared standard clinical and quantitative SPECT reconstruction techniques on the basis of performance in imaging tasks relevant to prodromal AD.
MATERIALS AND METHODS
Subject Studies
One hundred subjects 65 y of age or older and free of significant underlying medical, neurologic, or psychiatric illness were included in this study (17). Subjects were classified as either “normal” or “questionable” on the basis of the Clinical Dementia Rating (CDR) criterion (18), which stages individuals according to their functional ability, with 0 representing normal function and 5 representing the terminal phase of dementia. At baseline, 17 subjects had normal cognition (CDR, 0.0) and 83 subjects met criteria for questionable AD (CDR, 0.5). 99mTc-Hexamethylpropyleneamine oxime (HMPAO) SPECT and MRI studies were performed for each subject at baseline. After enrollment in the study, subjects were evaluated annually.
After a follow-up period of 5 y, subjects were divided into 3 groups on the basis of their functional status at baseline and at follow-up. The normal group consisted of 17 subjects who entered the study with normal cognition at baseline and remained cognitively intact after 3–5 y of annual follow-up evaluations; the questionable group consisted of 56 subjects who did not have dementia but who had evidence of memory impairment in daily life and remained in that status after 3–5 y of follow-up; and the converter group consisted of 27 individuals who did not have dementia but who had evidence of mild memory impairment at baseline and whose cognitive difficulties progressed after 3–5 y of follow-up to the point at which they met National Institute of Neurologic and Communicative Disorders and Stroke-Alzheimer’s Disease and Related Disorders Association) criteria for probable AD (19).
Data Acquisition and Processing
SPECT and MRI.
SPECT and MRI studies were performed for all subjects at baseline. Although the imaging data were obtained at baseline, the data were analyzed on the basis of the subject’s status at follow-up. Projections were acquired 20 min after injection of 740.0 ± 37.0 (mean ± SD) MBq of 99mTc-HMPAO (Ceretec) with the subjects supine, at rest, and with eyes open in a darkened room with ambient noise. Brain SPECT was performed by use of a dedicated system (CeraSPECT; Digital Scintigraphics, Inc.) with a stationary annular NaI crystal, within which rotates a collimator consisting of 3 parallel-hole segments. A total of 120 projections (128 × 64; 1.67-mm isotropic voxels) were acquired over 30 min in 13 energy windows equally spaced in the interval from 80 to 154 keV. A T1-weighted gradient-echo MRI scan (1.5-T Signa; General Electric) was also acquired for all subjects with a repetition time of 35 ms, an echo time of 5 ms, and a flip angle of 45°. The slice thickness was 1.5 mm, and the matrix size was 256 × 256.
The brain structures considered in this study were outlined manually on the MR images as VOIs by neuroanatomists using methods that have been shown to be reliable (14,20). Most of the structures were selected for analysis on the basis of neuropathologic or functional neuroimaging data suggesting that they are affected early in the course of AD. We also included some structures believed to be involved in the later stages of disease (17). Each VOI consisted of a pair of left and right structures (Fig. 1); VOIs were estimated from the number of MRI voxels contained within them. A surrogate of structure perfusion, the mean activity concentration within the VOI, was derived from the SPECT studies.

Locations of 6 VOIs defined on MR images used in SPECT-based discrimination tasks. (A) Banks of superior temporal sulcus (red). (B) Basal forebrain (orange) and amygdala (blue). (C) Rostral anterior cingulate gyrus (orange), caudal anterior cingulate gyrus (blue), and posterior cingulate gyrus (white).
Mean SPECT activity concentration and MRI volume were estimated for 7 structures (Fig. 1): rostral anterior cingulate gyrus, caudal anterior cingulate gyrus, posterior cingulate gyrus, hippocampus, basal forebrain, amygdala, and the banks of the superior temporal sulcus.
Scatter Correction.
Acquired projections were corrected for scatter by use of either a Compton window (CW) subtraction method (21), which could be implemented on almost any modern SPECT camera system, or a general spectral (GS) method (22), which would require a system with multiple-energy-window or list-mode acquisition capability. For the CW method, half the scatter window projection (90–120 keV) was subtracted from the corresponding primary window projection (126–154 keV). For the GS method, the number of primary unscattered photons (Nprim) in each pixel was estimated by a weighted linear combination of the counts detected in the same pixel in each of seventeen 4-keV-wide windows spanning the energy range from 90 to 160 keV, as follows:
 Eq. 1 where wk is the spectral weight and Nk is the number of photons detected in window k.
The spectral weights were optimized for 99mTc in an earlier study (22) on the basis of the accuracy and precision with which spheric lesion and cylindric background activity concentrations could be estimated simultaneously from projection images. This optimization was accomplished by minimizing the sum of the mean-square errors of weighted least-squares estimates of lesion and background activity concentrations. The 1.27-cm-radius sphere was centered in a 10-cm-radius cylinder to model approximately brain-sized objects. The mathematic methods underlying the weight optimization procedure are described in detail in the earlier study (22); that article also presents an evaluation of the performance of the GS method for spheres of different sizes, located in different radial positions, and containing different activity concentrations with respect to the background. Because the data in the present study were collected in energy windows somewhat different from those used in the earlier study (22), the weight factors were modified from their original values by use of spline interpolation (Fig. 2) (23).
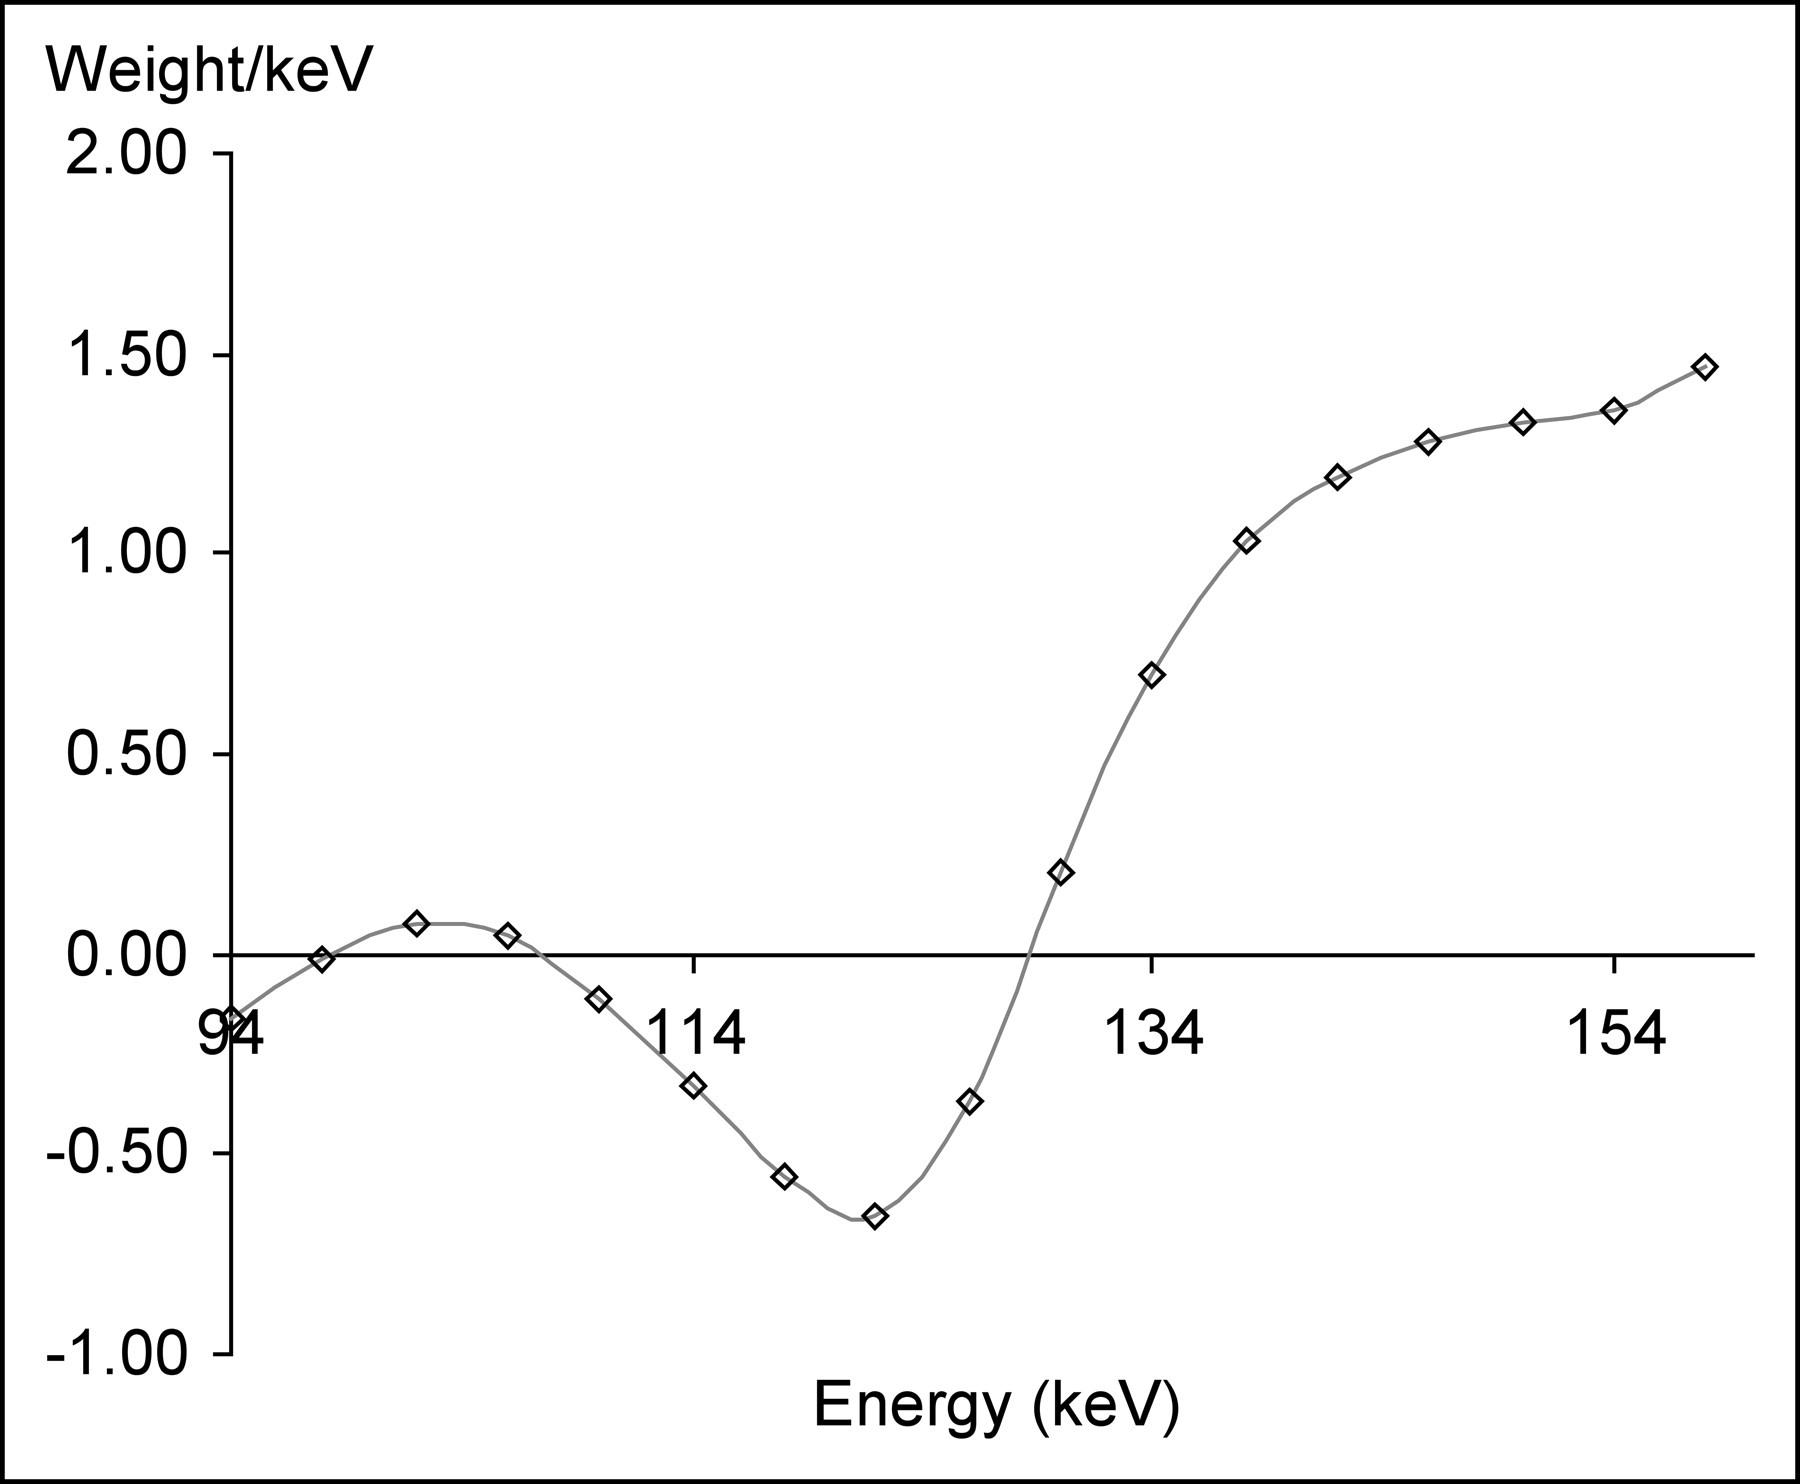
General spectral energy weights optimized on the basis of the accuracy and precision of simultaneous estimations of lesion and background activities.
Attenuation and Collimator Response Corrections and Reconstruction.
Projections corrected for scatter by use of the CW subtraction method were corrected for attenuation by the Chang method (24) and reconstructed by use of filtered backprojection and a Butterworth filter (n = 10; cutoff frequency [fc] = 1.0), as done routinely in our clinic (standard approach [STD]). The attenuation correction was based on a uniform attenuation map obtained by segmenting an MR image of the brain (including the scalp) and assigning a uniform attenuation value (0.15 cm−1).
The projections corrected for scatter by use of the GS method were reconstructed by use of an improved quantitative approach (QUAN) to yield the perfusion image. Attenuation correction was accomplished with both a uniform attenuation map (QUANunif) (described above) and a nonuniform attenuation map (QUANnonunif). QUANnonunif was estimated individually for each subject by the following procedure. First, projections were reconstructed by use of ordered-subset(s) expectation maximization (OSEM) (6 subsets, 12 iterations) (25) without corrections for attenuation and collimator response. Second, this preliminary SPECT image was registered to the MR image by use of a brain surface-based rigid-body transformation (26,27). Third, the MRI volume was segmented into bone and soft-tissue compartments to yield an attenuation map that was used to correct for nonuniform attenuation as previously described (23). Finally, a second OSEM reconstruction (6 subsets, 13 iterations) was performed with corrections for attenuation and variable collimator response incorporated in the iterative algorithm by modeling of the intrinsic and distance-dependent components of spatial resolution and the attenuation map in the OSEM algorithm (23,25).
The number of iterations for the OSEM reconstruction was optimized for the most significant clinical task, that is, discrimination between the questionable group and the converter group. The number of subsets (6) was selected to yield equal numbers of projections per subset (20 projections per subset). Next, the number of iterations was varied between 5 and 20, and the VOI activity concentrations were used as inputs for a pairwise discriminant analysis as described below. Finally, the number of iterations yielding the best discrimination accuracy was used for the rest of the study. Figure 3 shows a transverse slice of a converter study reconstructed by use of STD and by use of QUANunif and QUANnonunif.
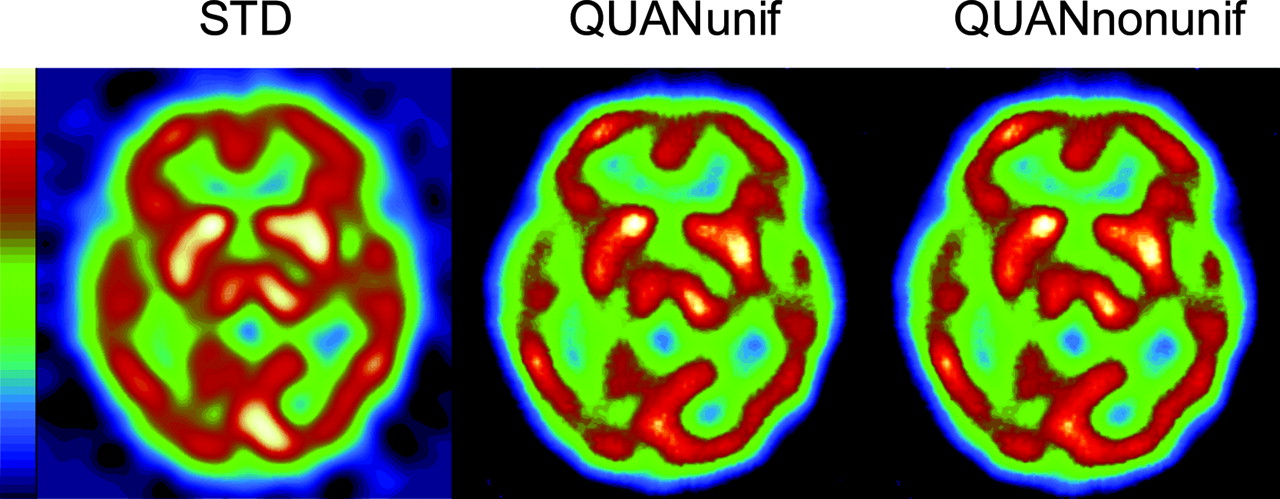
Transverse slice of a converter study reconstructed with STD, QUANunif, and QUANnonunif.
Discriminant Analyses
Overall Linear Discriminant Analysis.
We performed an overall linear discriminant analysis (28) to ensure that the 7 VOIs considered in this study significantly differentiated the 3 groups of subjects, that is, the control group, the converter group, and the questionable group. The statistical power of this analysis is based on the overall sample size rather than on the sizes of the individual groups. For the MRI analysis, 8 variables were used: the 7 volume estimates and the intracranial volume, which was included to adjust for any differences among the groups attributable to total brain volume. For the SPECT analysis, the 8 variables used were estimates of the activity concentrations for the 7 structures and the total brain perfusion. The significance of the discriminant analysis was tested by use of an F test approximation of the Wilks λ test (28).
Pairwise Discriminant Analysis.
For each subject, estimates of activity concentrations or structure volumes for the 7 brain structures of interest were used as features in a discriminant analysis. We assumed that these variables were distributed normally in each of the 3 groups. The validity of this assumption was tested by the Kolmogorov-Smirnov test (29). The hypothesis that the actual distribution was significantly different from the normal distribution was rejected for variables in all 3 groups; P values for the converter, questionable, and normal groups were 0.88, 0.56, and 0.97 for structure volumes and 0.44, 0.15, and 0.31 for activity concentrations, respectively. Mean vectors and covariance matrices were calculated for both the normal and the converter groups (or both the normal and the questionable groups or both the questionable and the converter groups); on the basis of these calculations, we determined, for each subject, the likelihood ratio of being in the converter group rather than in the normal group, as follows:
 Eq. 2 where L ratiojk is the likelihood ratio that subject j is in group k, k is the group (normal vs. questionable, normal vs. converter, and questionable vs. converter), j is the subject in the group, mk is the mean vector (7 features) for group k, fjk is the vector of 7 VOIs for subject j of group k, t is the standard symbol for the transpose operation, Σk is the covariance matrix (size, L × L [L × L is the standard notation for the size of a matrix with L columns and L rows]) for the group, and |Σk| is the determinant of Σk.
These likelihood ratios were used as inputs to a continuous receiver-operating-characteristic (ROC) analysis, accomplished with ROCKIT, a publicly available software package that fits a binormal ROC curve to continuously distributed data by use of maximum-likelihood techniques (30–32). Because images from the 2 reconstruction procedures being compared were based on the same raw projection data, a correlated analysis was used. Discrimination performance was quantified by the area under the ROC curve.
RESULTS
Figure 4 shows the ROC curves obtained for discrimination between the questionable group and the converter group with QUANnonunif and 7, 11, 13, 15, and 19 iterations. It is clear that the best discrimination performance was achieved with 13 iterations. Similar results were also obtained for discrimination between the normal group and the converter group (13 iterations) and between the normal group and the questionable group (12 iterations). The following results were obtained with 6 subsets and 13 iterations.

Fitted ROC curves obtained for discrimination between questionable and converter groups by use of QUANnonunif and 7, 11, 13, 15, and 19 iterations (it).
The overall discriminant function determined by the F test was highly significant for QUANunif, QUANnonunif, and MRI (P < 0.001) and was significant for STD (P < 0.003).
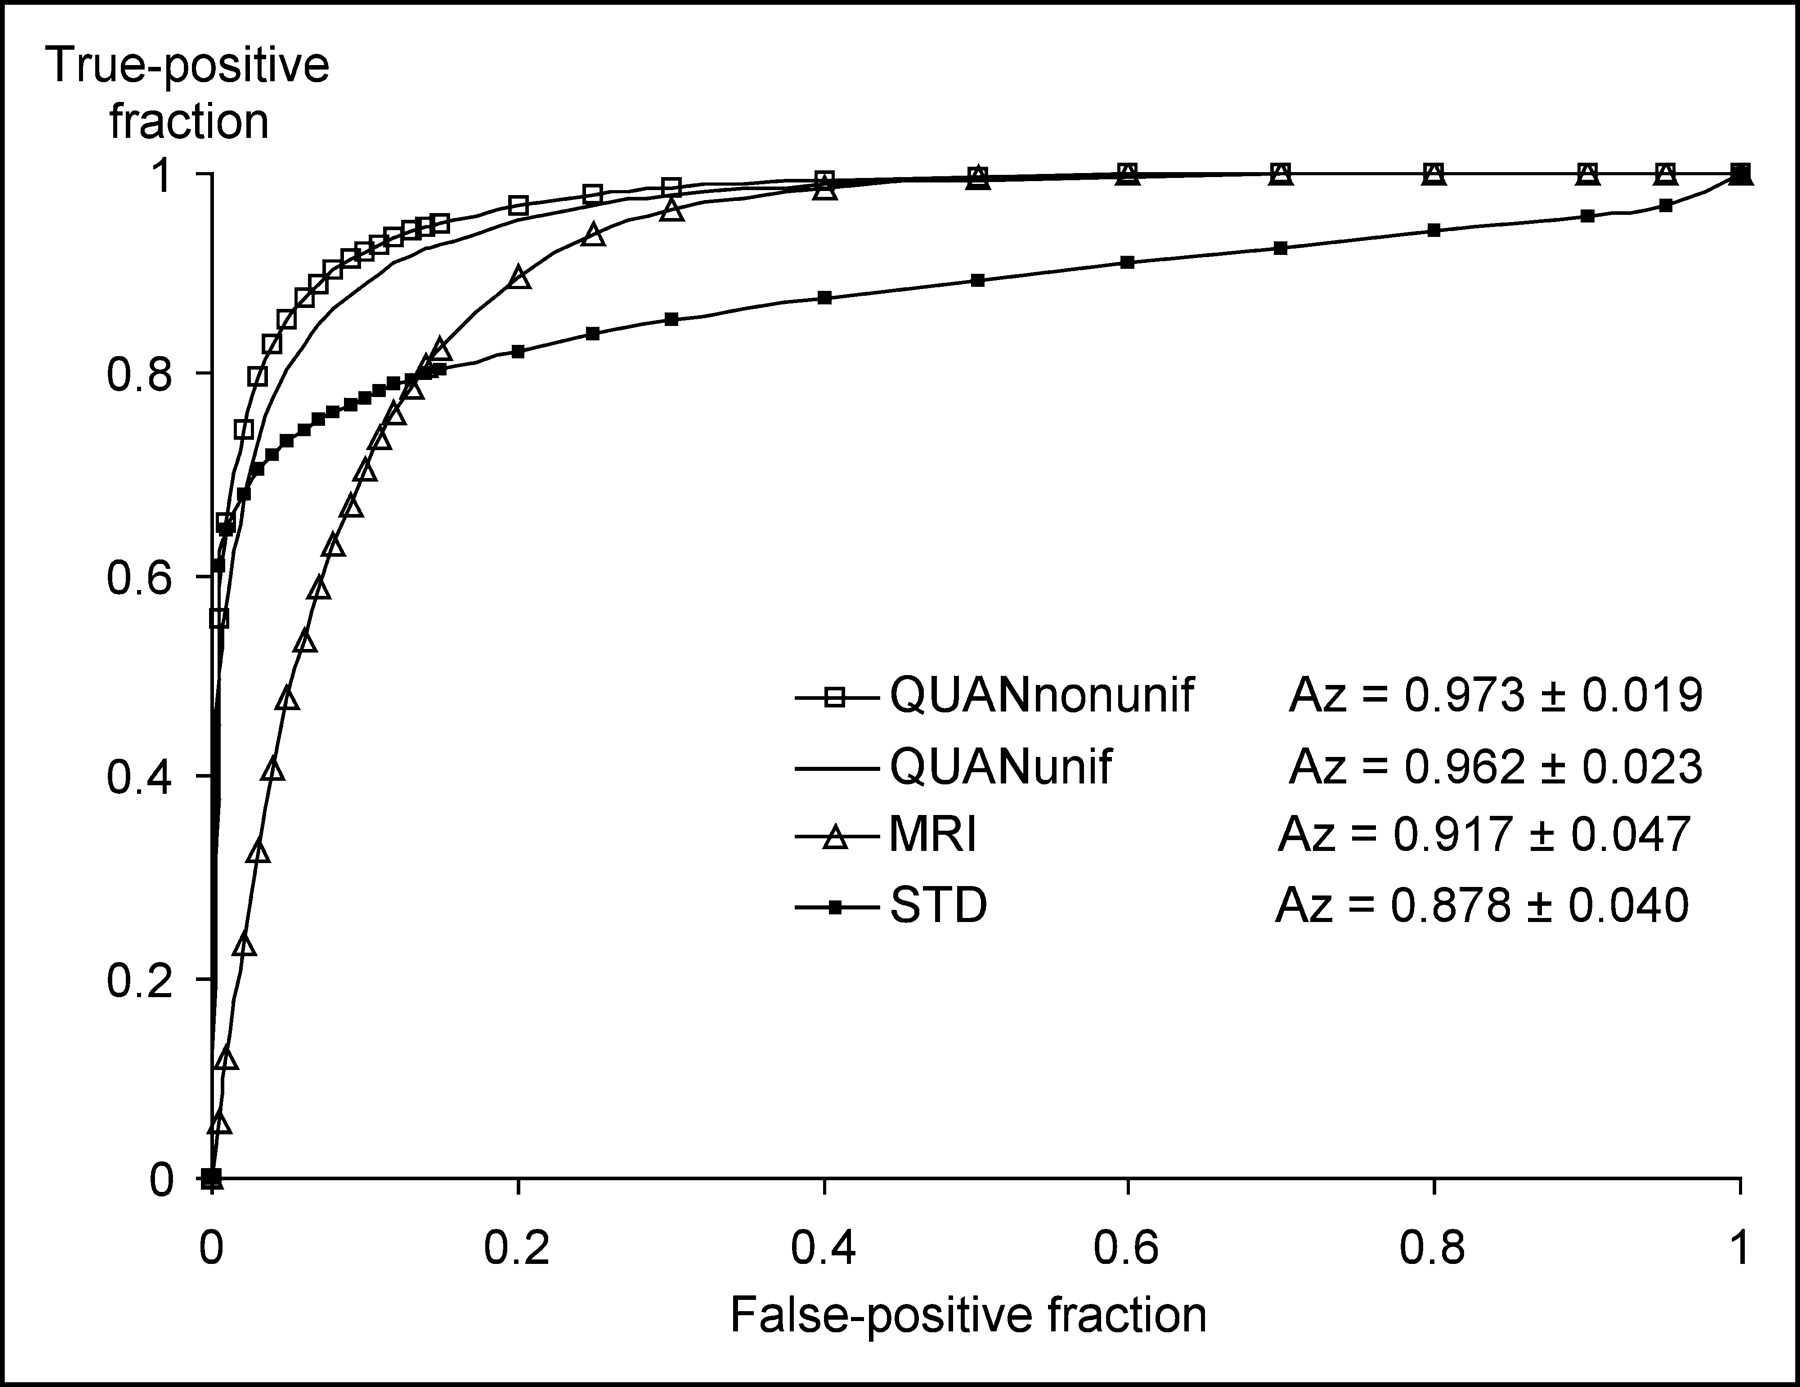
Figures 5–7 show the ROC curves obtained for discrimination between the normal and converter groups, the normal and questionable groups, and the questionable and converter groups, respectively, with QUANnonunif, QUANunif, STD, and MRI. Attenuation correction with QUANnonunif yielded a small but systematic improvement in discrimination accuracy for normal versus converter groups (accuracy or area under the ROC curve [Az], 0.965), for normal versus questionable groups (Az, 0.973), and for questionable versus converter groups (Az, 0.881) compared with attenuation correction with QUANunif (Az, 0.955, 0.962, and 0.866, respectively). Performance with STD was comparable to that with QUANnonunif for normal versus converter groups (Az, 1% lower) (Fig. 5) but significantly lower (P < 0.05) for the more clinically relevant tasks of discriminating between normal and questionable groups (Az, 11% lower) (Fig. 6) and between questionable and converter groups (Az, 15% lower) (Fig. 7).

Correlated ROC curves obtained for discrimination between normal and converter groups by use of OSEM with QUANunif, OSEM with QUANnonunif, filtered backprojection with a uniform attenuation map (STD), and MRI data.

Correlated ROC curves obtained for discrimination between normal and questionable groups by use of QUANunif, QUANnonunif, STD, and MRI data.

Correlated ROC curves obtained for discrimination between questionable and converter groups by use of QUANunif, QUANnonunif, STD, and MRI data.
DISCUSSION
Overall performance was better with QUAN than with MRI for all tasks; however, MRI yielded better performance in the low false-positive rate regime for QvsC. For management of prodromal AD patients, however, high specificity is less important than it is in other contexts, as neuroprotective drugs administered for early AD patients have few side effects.
QUANnonunif performance in discriminating between questionable and converter groups was significantly worse (Az, 0.881) than that in discriminating between normal and converter groups (Az, 0.965) or between normal and questionable groups (Az, 0.973) (P < 0.01). This finding was probably attributable to the fact that some of the subjects in the questionable group were destined to develop AD at a later time and therefore had SPECT perfusion and MRI volume abnormalities that were similar to those of subjects in the converter group. In this work, we did not rank the different brain structures on the basis of their discriminant power, as this information was reported previously (17).
It is highly unlikely that the discriminating power of the SPECT variables obtained with the QUAN protocols were attributable to disease-related atrophy and consequent partial-volume bias. Our quantitative reconstruction methods led to improved spatial resolution and, consequently, minimal confounding between estimates of SPECT activity concentrations and structure volumes (23). On the basis of previous work (17,33), we estimated the effects of limited spatial resolution on estimates of activity concentrations within the amygdala and the banks of the superior temporal sulcus (the smallest brain structures in which, because of their small size, atrophy effects would be greatest) to be less than 12%. This degree of bias is comparable to the best accuracy (10% error) that can be achieved in compensating for all physical factors affecting quantitative SPECT (33).
One of the principal goals of the research presented in this article was to compare discrimination task performance by use of data acquisition and reconstruction methodologies that are straightforward for implementation in most clinical settings with that achievable by use of more technically sophisticated acquisition and processing techniques. Iterative reconstruction software, which can compensate for distance-dependent collimator response and for attenuation, given a reasonable estimate of the attenuation map, is already commercially available. Even though almost all SPECT systems can acquire 2 or a few energy windows simultaneously, most manufacturers have not implemented any scatter correction methods in their clinical brain SPECT protocols. Therefore, it might be interesting to compare discrimination task performance achieved with no scatter correction to that achieved with a simple scatter correction method. Previous work addressing the effects of scatter correction on cardiac (33,34) and brain SPECT demonstrated that accurate scatter and attenuation compensations are required for absolute activity quantitation, although they are less important for relative quantitative tasks. Performance in the discrimination task either with or without scatter compensation will be the subject of future research.
Estimates of areas under the ROC curves were affected by resubstitution bias, because the binary classification tasks were accomplished by use of rules established with the same subjects as those used to derive the Lratio. Therefore, the ROC performance measures that we obtained here may be better than those achieved with a new group of subjects. They can, however, be viewed as upper bounds on the ability of image-derived measures to discriminate among diagnostic categories.
CONCLUSION
Quantitative brain SPECT and MRI allow the identification of group differences in the prodromal phase of AD. The use of QUAN, incorporating compensation for distance-dependent collimator response and improved correction for scatter and attenuation, led to significantly better performance than did the use of STD. Quantitative reconstruction protocols should be incorporated into clinical settings so that all of the diagnostic information implicit in the acquired projection data is available.
Acknowledgments
This work was supported in part by National Institutes of Health grants RO1-EB000802, RO1-EB001989, and PO1-AG04953. The contents of this article are the responsibility of the authors and do not represent the views of the National Institutes of Health.
Footnotes
Received Feb. 11, 2004; revision accepted Jul. 15, 2004.
For correspondence or reprints contact: Georges El Fakhri, Department of Radiology, Brigham and Women’s Hospital, 75 Francis St., Boston, MA 02115.
E-mail: elfakhri{at}bwh.harvard.edu


