


Abstract
Gated myocardial perfusion SPECT allows assessment of left ventricular end-diastolic volume (EDV), left ventricular end-systolic volume (ESV), left ventricular stroke volume (SV), and left ventricular ejection fraction (LVEF). Acquiring images with the patient both prone and supine is an approved method of identifying and reducing artifacts. Yet prone positioning alters physiologic conditions. This study investigated how prone versus supine patient positioning during gated SPECT affects EDV, ESV, SV, LVEF, and heart rate. Methods: Forty-eight patients scheduled for routine myocardial perfusion imaging were examined with gated 99mTc-sestamibi SPECT (at rest) while positioned prone and supine (consecutively, in random order). All parameters for both acquisitions were calculated using the commercially available QGS algorithm. Results: Whereas EDV and SV were significantly lower (P < 0.0004) for prone acquisitions (EDV, 110.5 ± 39.1 mL; SV, 55.9 ± 13.3 mL) than for supine acquisitions (EDV, 116.9 ± 36.2 mL; SV, 61.0 ± 14.5 mL), ESV and LVEF did not differ significantly. Heart rate was significantly higher (P < 0.0001) during prone acquisitions (69.1 ± 10.5 min−1) than during supine acquisitions (66.5 ± 10.0 min−1). Conclusion: The observed position-dependent effect on EDV, SV, and heart rate might be explained by decreased arterial filling and increased sympathetic nerve activity. Hence, supine reference data should not be used to classify the results of prone acquisitions.
In myocardial perfusion SPECT, acquiring images with the patient both prone and supine is also known as poor man’s attenuation compensation (1), as it represents an easy and effective way to identify and reduce attenuation artifacts, particularly in the inferior segments (2). Hayes et al. reported that despite ambiguous or pathologic findings on supine-only acquisitions, the prognostic value of a normal finding on combined acquisitions is equivalent to that of a normal finding on supine-only acquisitions (3).
In coronary artery disease, cardiac function is both an essential diagnostic and an essential prognostic criterion to assess for heart failure. Impairment of systolic function as determined by increased left ventricular volumes and decreased left ventricular ejection fraction (LVEF) is a powerful and reliable predictor of poor long-term prognosis (4,5).
Electrocardiography-gated SPECT allows myocardial perfusion imaging (6) with subsequent analysis of regional wall motion and quantification of global function by left ventricular end-diastolic volume (EDV), left ventricular end-systolic volume (ESV), left ventricular stroke volume (SV), and LVEF (7,8). The clinical relevance of this integrated approach has already proven useful in tissue characterization (9) and prediction of outcome (10). For computing volumes and LVEF, the commercially available automated Quantitative Gated SPECT algorithm (QGS; Cedars-Sinai Medical Center) has most often been validated using the current gold standard, cardiovascular MRI (11–14). So far, these validation studies have dealt with SPECT data acquired only with the patient supine. Although prone positioning is known to affect intraabdominal pressure (15) and sympathetic nerve activity and is also suspected of impeding arterial filling (16), the effects of these physiologic changes on EDV, ESV, SV, LVEF, and heart rate during gated SPECT remain unclear. Berman et al. reported that EDV, ESV, and LVEF from prone and supine acquisition of gated SPECT images after stress correlated well with one another (17), but SV and heart rate were not given. Because this was a poststress study, the often-seen time-dependent ischemic stunning after exercise (18,19) or the lingering hypercontractility in normal myocardium may have influenced the results to an uncertain extent. Therefore, the aim of our study was to compare EDV, ESV, SV, LVEF, and heart rate from prone and supine acquisition of gated SPECT images after tracer injection at rest.
MATERIALS AND METHODS
Study Population
Forty-eight patients (36 men and 12 women; mean age, 59 ± 13 y; age range, 33–82 y; body-mass index, 28.3 ± 4.0 kg × m−2) scheduled for routine myocardial perfusion imaging with 99mTc-sestamibi SPECT were included in the study. The 2-day protocol started with a SPECT examination after stress and continued two or more days later with prone and supine acquisition of gated SPECT images at rest.
Nineteen of the patients had been referred for SPECT because of suspected coronary artery disease. Of the remaining 29 patients, who were known to have coronary artery disease, 18 had a history of one or more myocardial infarctions and 8 had previously undergone coronary artery bypass grafting.
Image Acquisition
Gated prone and supine images were acquired on a MULTISPECT 3 triple-head γ-camera (Siemens Gammasonics Inc.) about 60 min after intravenous administration of 450 MBq of 99mTc-sestamibi with the patients at rest. Images were acquired in a 64 × 64 matrix with 20 views and 30 s per view, using a zoom factor of 1.23. The acquisition order was random.
The cardiac cycle was divided into 8 equal intervals. All datasets were reconstructed using filtered backprojection (third-order Butterworth filter; critical frequency, 0.5 Nyquist). The datasets were subsequently transferred to an ICON system (Siemens Gammasonics Inc.), where they were reoriented on the transverse planes, first parallel to the septum and then parallel to the inferior wall. The reoriented short-axis datasets, with a voxel size of 5.8 × 5.8 × 5.8 mm3, were stored for analysis.
Image Analysis
SPECT data were analyzed for EDV, ESV, SV, and LVEF with QGS (8) on the ICON system. Automatic processing was used for QGS, without the option of manual correction. Heart frequency in beats per minute (min−1) was calculated by dividing the total number of beats in the net acquisition time by the net acquisition time itself (10 min).
Analysis by EDV and ESV Values.
The patients were categorized into 2 groups according to EDV and ESV values. The first group consisted of patients with a supine EDV less than the maximum ESV, and the second consisted of patients with a supine ESV more than the minimum EDV. This grouping was used to test prone EDV/ESV versus supine EDV/ESV within an identical volume interval to determine whether the technical settings of the different acquisition conditions influenced the estimated values.
Analysis by Ventricle Size.
The patients were also categorized into 2 groups according to ventricle size, measured in EDV. The first group consisted of patients with larger ventricles, and the second consisted of patients with smaller ventricles, applying a threshold that yielded samples of nearly equal size. This grouping was used to determine whether patients with differently sized ventricles were differently affected by changes of position.
Statistical Analysis
All analyses were done using SPSS 10 (SPSS Inc.) and Origin 6.1 G (OriginLab Corp.) software. Data are shown as mean ± SD. Mean values of EDV, ESV, SV, LVEF, and heart rate were tested for significance using the Wilcoxon matched-pairs signed rank test, with a 2-tailed P value of <0.05 considered significant. Applying the Bonferroni adjustment for multiple comparisons (n = 5) to the main groups yielded a 2-tailed P value of <0.01, which is considered significant.
RESULTS
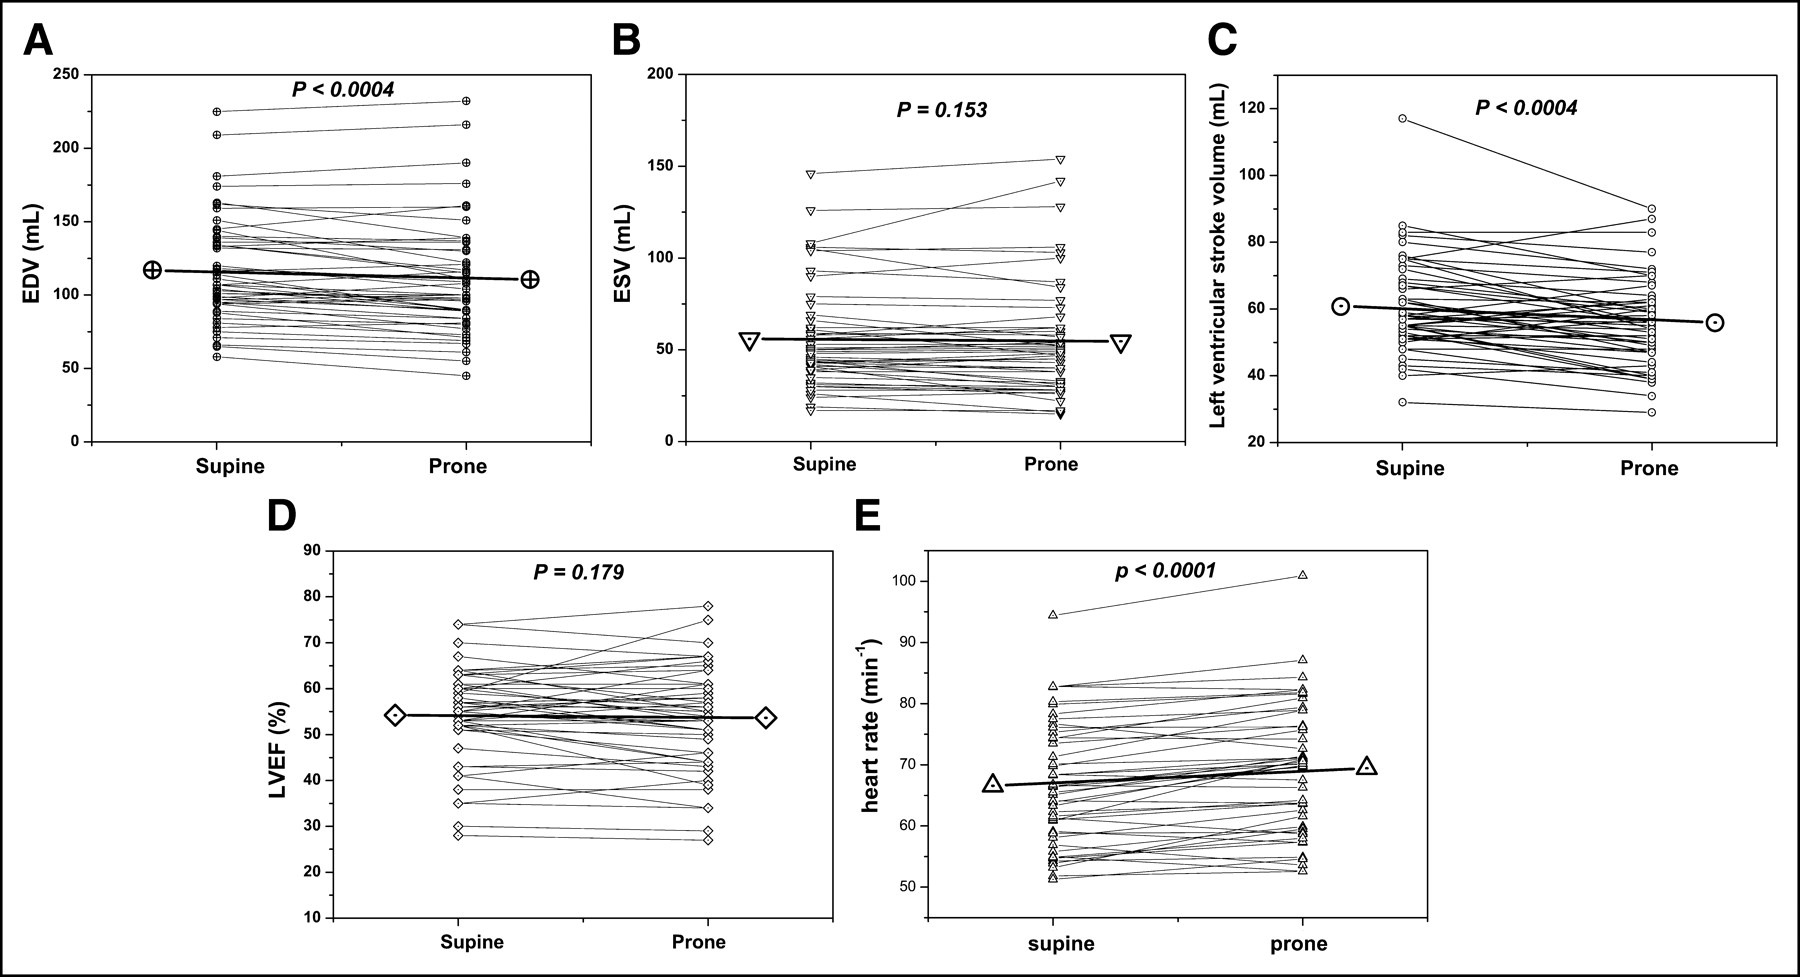
EDV was significantly lower for prone acquisitions (110.5 ± 39.1 mL [45–232 mL]) than for supine acquisitions (116.9 ± 36.2 mL [58–225 mL], P < 0.0004) (Fig. 1A), at a reduction of 5.5%. SV was also significantly lower for prone acquisitions (55.9 ± 13.3 mL [29–90 mL]) than for supine acquisitions (61.0 ± 14.5 mL [32–117 mL], P < 0.0004), at a reduction of 8.4% (Fig. 1C). Heart rate was significantly higher for prone acquisitions (69.1 ± 10.5 min−1 [52.6–100.9 min−1]) than for supine acquisitions (66.5 ± 10.0 min−1 [51.3–94.4 min−1], P < 0.0001), at an increase of 3.9% (Fig. 1E).

Mean and individual EDV (A), ESV (B), SV (C), LVEF (D), and heart rate (E) calculated from prone and supine acquisition of gated SPECT. P values from Wilcoxon signed rank tests are shown.
ESV did not differ significantly between prone acquisitions (54.6 ± 31.5 mL [15–154 mL]) and supine acquisitions (55.9 ± 28.5 mL [17–146 mL], P = 0.153), at a reduction of 2.3% (Fig. 1B), nor did LVEF, at a 1.7% relative reduction from supine (54.3% ± 10.3% [28%–74%]) to prone (53.4% ± 11.4% [27%–78%]) (P = 0.179) (Fig. 1D).
Results for Grouping by EDV and ESV Values
The group with a supine EDV less than the maximum ESV included 40 patients, and their supine EDV values were ≤146 mL (maximum supine ESV). The group with a supine ESV more than the minimum EDV included 17 patients, and their supine ESV values were ≥58 mL (minimum supine EDV). Hence, the EDV values of the first group fell within the same range as the ESV values of the second group (Fig. 2), with some patients being in both groups. EDV in the first group was significantly lower for prone acquisitions (98.0 ± 24.8 mL) than for supine acquisitions (104.7 ± 23.1 mL) (P < 0.0003), whereas ESV in the second group did not differ significantly between prone acquisitions (85.8 ± 32.2 mL) and supine acquisitions (86.2 ± 26.4 mL) (P = 0.604).
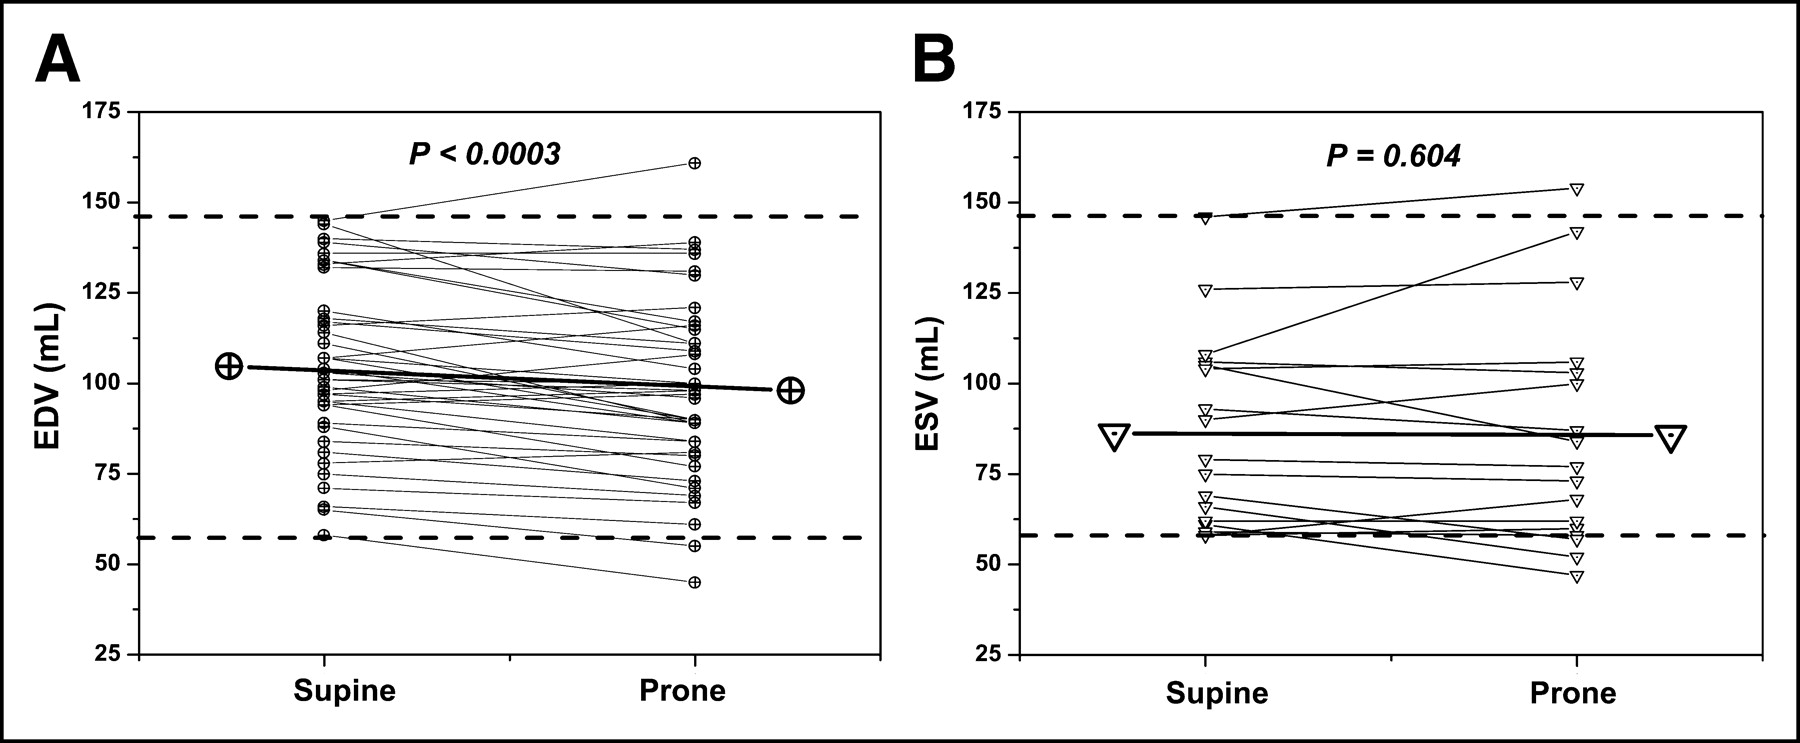
Grouping by EDV and ESV values. Mean and individual EDV values are shown for the 40 patients with supine EDV ≤ 146 mL (A) and for the 17 patients with supine ESV ≥ 58 mL (B). The 2 groups lie within the same supine volume range, indicated by dashed lines, and some overlap of patients occurs between them. P values from Wilcoxon signed rank tests are shown.
Results for Grouping by Ventricle Size
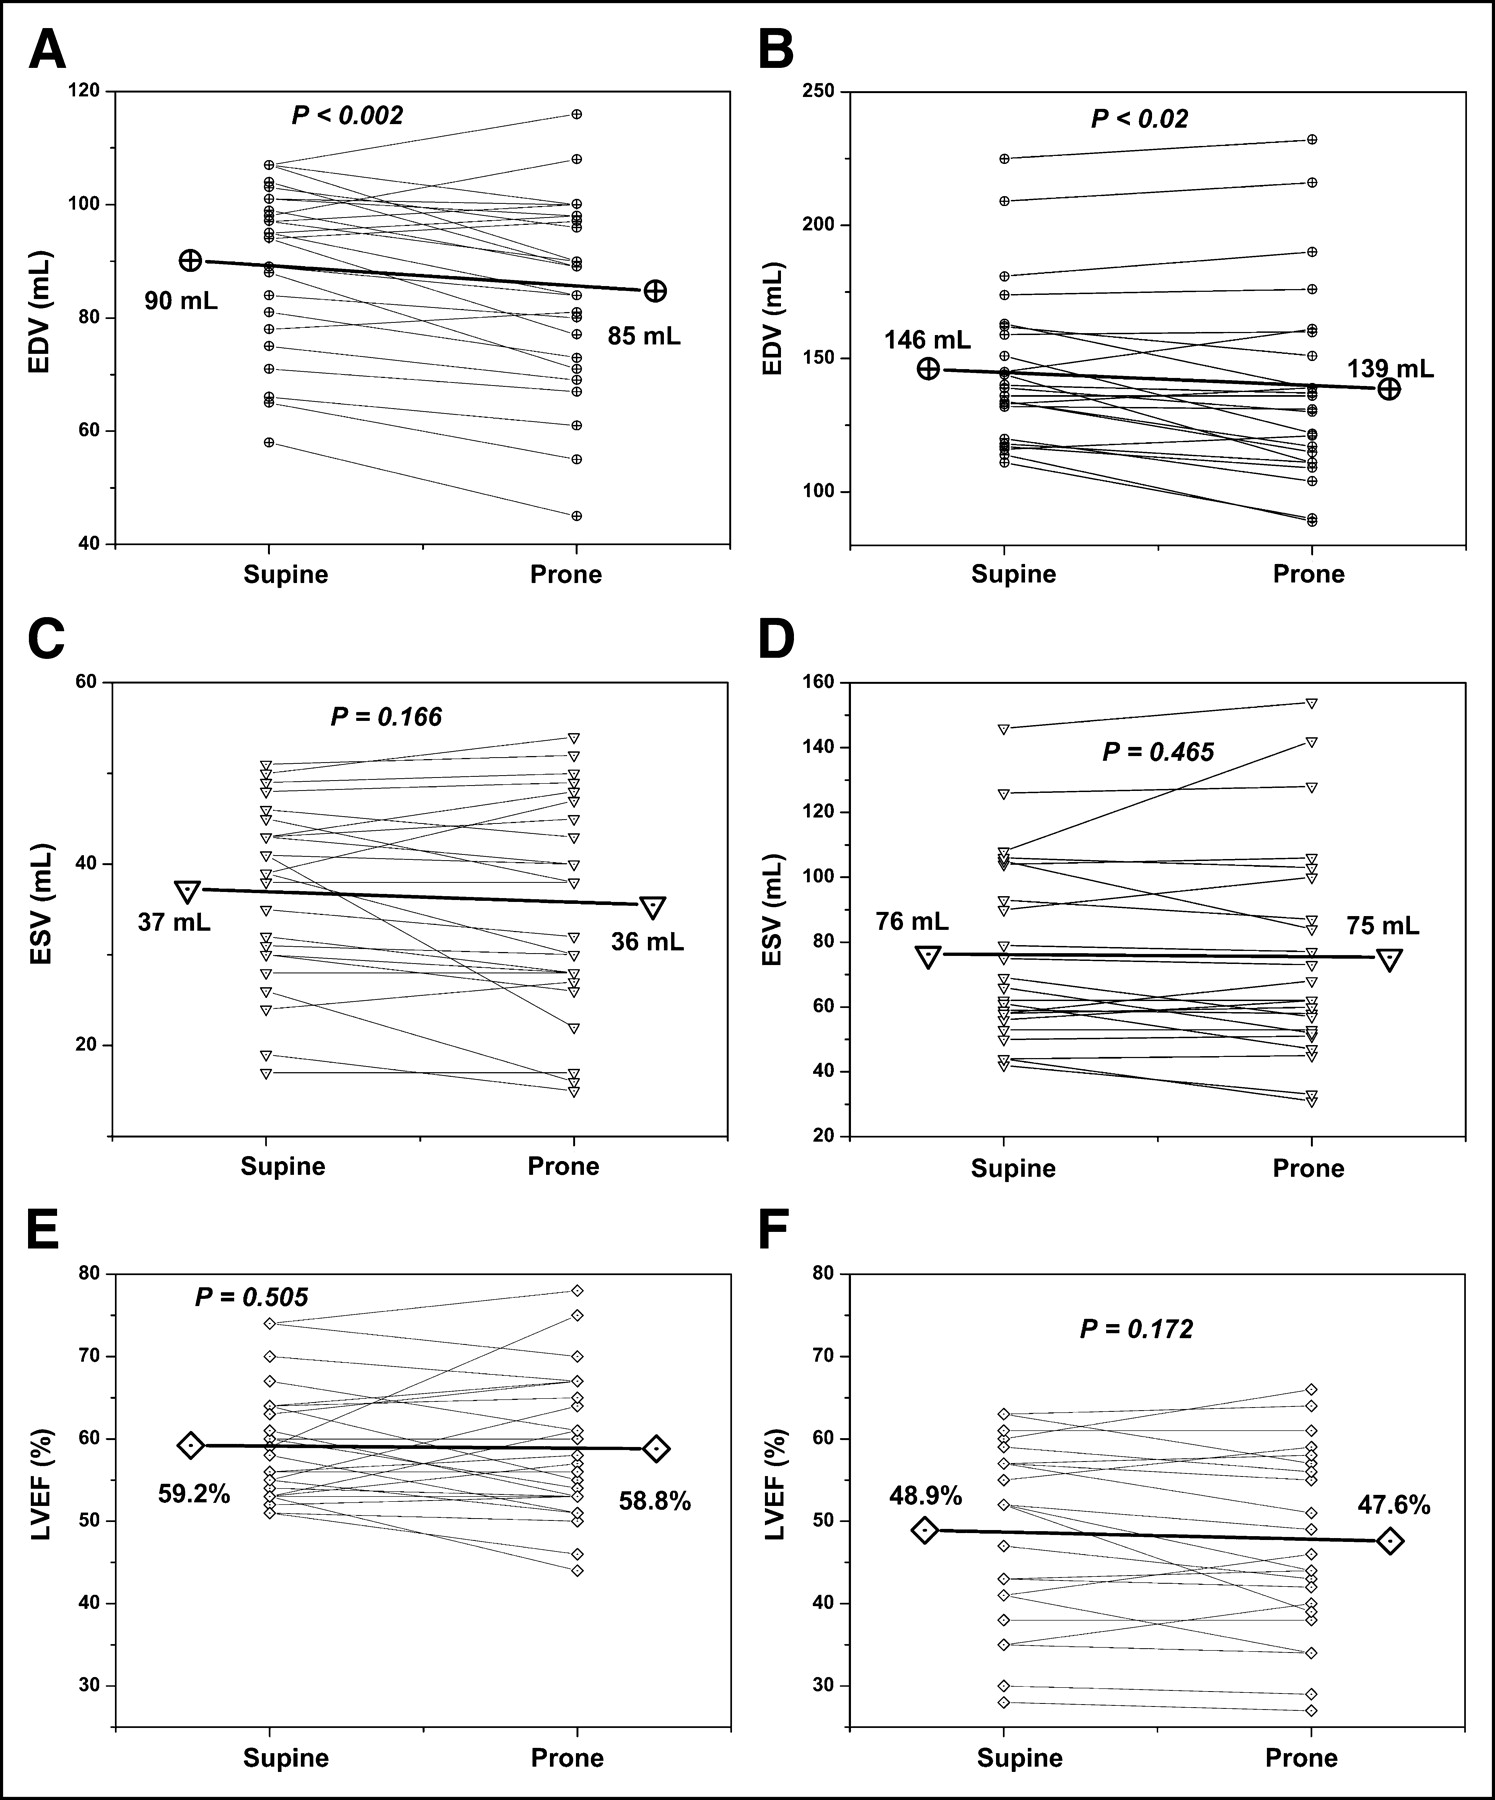
The group with smaller ventricles included 25 patients, and their supine EDV values were ≤107 mL. The group with larger ventricles included 23 patients, and their supine EDV values were >107 mL. Analysis of EDV, ESV, and LVEF for these groups is shown in Figure 3. EDV was significantly lower for prone than for supine acquisitions in both groups, whereas ESV and LVEF did not differ between prone and supine acquisitions in either group. SV was significantly lower for prone than for supine acquisitions in both groups (smaller-ventricle group, 49 mL for prone vs. 53 mL for supine [P < 0.02]; larger-ventricle group, 63 mL for prone vs. 70 mL for supine [P < 0.003]). Heart rate was significantly higher for prone than for supine acquisitions in both groups (smaller-ventricle group, 70.4 min−1 for prone vs. 68.2 min−1 for supine [P < 0.007]; larger-ventricle group, 67.7 min−1 for prone vs. 64.7 min−1 for supine [P < 0.0001]). The relevant differences in parameters between prone and supine acquisitions seen within the entire study cohort persisted in both the smaller-ventricle and larger-ventricle groups.

Grouping by ventricle size. Mean and individual EDV (A and B), ESV (C and D), and LVEF (E and F) are shown for the 25 patients with supine EDV ≤ 107 mL (A, C, and E) and for the 23 patients with supine EDV > 107 mL (B, D, and F). P values from Wilcoxon signed rank tests are shown.
DISCUSSION
This study investigated how prone and supine patient positioning during gated 99mTc-sestamibi SPECT acquisition affects EDV, ESV, SV, LVEF, and heart rate. Unlike earlier studies addressing the same issue for acquisitions after stress (17), tracer was injected at rest to avoid time-dependent stunning in ischemic myocardium or lingering hypercontractility in normal myocardium (18,19). We found a significant decrease in EDV and SV and a significant increase in heart rate during prone versus supine acquisitions, whereas ESV and LVEF remained unchanged.
The analysis of groups allowed us to exclude any influence of algorithm-specific characteristics of QGS on the effects observed. Resultant from the grouping by EDV and ESV values, the EDV of the first group fell within the same range as the ESV of the second (Fig. 2). Because a significant reduction in EDV occurred in the first group but no ESV difference was seen in the second group, one can deduce that the effects were indeed mostly physiologic and not algorithm inherent. If these effects were technical artifacts, they would have appeared for both EDV and ESV, especially since the volume ranges of both groups were identical.
Separating the study population into 2 groups by ventricle size allowed us to determine its influence as a measure of ventricular performance on the position-related effects. The relative reductions in EDV and SV were comparable in the 2 groups: 5.6% for the EDV of smaller ventricles and 4.8% for the EDV of larger ventricles, and 7.5% for the SV of smaller ventricles and 10% for the SV of larger ventricles. The increase in heart rate was likewise comparable, at 3.2% for the smaller ventricles and 4.6% for the larger ventricles. Significant ESV and LVEF alterations due to a change in position were seen neither for the smaller nor for the larger ventricles. Thus, in this patient cohort the physiologic response to a change in position did not depend on ventricular performance. Besides, no predictive parameter for the magnitude of these effects was found for the individually greatly varying EDV, SV, and heart rate.
The alterations seen for the entire cohort as well as for the groups agreed well with data published by Pump et al., who found a significant decrease in SV and a significant increase in heart rate when subjects changed their position from supine to prone (16). These effects were associated with a significant increase in norepinephrine and atrial natriuretic peptide blood levels. Their study dealt with a much longer interval than did ours. However, during 10 min of acquisition after about 5 min of preparation in prone positioning, the most readily determinable parameter in our study—heart rate—showed an increase of about 2.6 min−1, whereas Pump et al. observed an increase of about 4 min−1 over several hours. Even though the observed differences in our volume data were small, the change of −8.4% for SV (for all patients) is comparable to a decrease of about 9% within the first 90 min of prone positioning as described by Pump et al. We did not observe a significant alteration of LVEF between the 2 positions, most likely because of simultaneously decreasing EDV and SV, which cancel out in division.
Considering physiologic reasons for the effects of positioning on EDV, SV, and heart rate, we suggest that altered intraabdominal and intrathoracic pressures are mainly responsible. Hering et al. reported that prone positioning of ventilated patients with acute lung injury significantly increased intraabdominal pressure (15). Following the paper of Pump et al. (16), we hypothesize that compression of the thorax in the prone position reduced EDV- and SV-attenuating pulsation of the arterial tree. The presumable inhibition of the arterial baroceptors results in, consecutively, increased sympathetic nerve activity and heart rate.
Concerning the impact of the observed physiologic alterations on gated SPECT acquisition, we suggest that if prone and supine acquisitions are combined to identify and reduce artifacts, the supine acquisition should be gated since all reference methods—for example, cardiovascular MRI (20)—are performed with the patient supine. When gating prone acquisition, one must keep in mind that physiologic effects may alter the parameters, needlessly reducing comparability with reference data obtained from supine positioning.
CONCLUSION
Values of EDV, SV, and heart rate differ between prone and supine acquisitions of gated 99mTc-sestamibi SPECT. Therefore, comparison of prone gated SPECT data with reference values obtained from supine data is unsuitable and should be avoided.
Footnotes
Received Feb. 19, 2004; revision accepted Jul. 15, 2004.
For correspondence or reprints contact: Wolfgang M. Schaefer, MD, PhD, Department of Nuclear Medicine, University Hospital Aachen, Pauwelsstrasse 30, 52074 Aachen, Germany.
E-mail: wschaefer{at}ukaachen.de


