


Abstract
It has been shown in vitro that the cell uptake of 18F-FDG, a tracer of glucose metabolism, increases under hypoxia. This is consistent with increased glycolytic metabolism. We have previously shown that in ischemic heart ex vivo the rates of uptake of 18F-FDG and 2-14C-deoxy-d-glucose (14C-2DG) are both reduced. In this study, we investigated this effect in tumors by comparing the microdistribution of 18F-FDG and 14C-2DG in hypoxic and normoxic regions. Methods: Mice (MF1) bearing LS174T human tumor xenografts were injected with premixed 18F-FDG (100 MBq), 14C-2DG (0.37 MBq), and pimonidazole hydrochloride (60 mg/kg). After 30, 60, and 120 min, tissues (n = 4) were taken and counted for whole-body biodistribution. Tumors were frozen, sectioned, and exposed to phosphor image plates to obtain a quantitative digital image of radionuclide distribution. Sections were then stained to reveal tumor pathophysiology: Hematoxylin and eosin staining demonstrated viable and necrotic regions, and immunohistochemical staining detected pimonidazole metabolism in hypoxic cells. The images of radionuclide microdistribution and histology were then coregistered and analyzed to assess radionuclide trapping throughout the tumor on a pixel-by-pixel basis. The Pearson correlation coefficients between the 2 radionuclides were calculated. The relative amounts of nuclide were then analyzed in viable and necrotic regions and in normoxic and hypoxic regions. Results: Whole-body biodistributions for the 2 radiotracers were similar. A high Pearson correlation coefficient was obtained for the 2 radionuclides throughout the tumors (r = 0.85 ± 0.10, P < 0.0001), indicating a highly similar microdistribution. When the tumors were divided into viable and necrotic regions, the ratio of mean counts per pixel was 1.96 (P < 0.0001), whereas for hypoxic versus normoxic regions it was 1.26 (P < 0.0001). There was no significant difference in selectivity for hypoxia between the 2 radiotracers (P = 0.86). Conclusion: The tumor microdistribution of deoxyglucose in viable, hypoxic, and necrotic regions show that there was little change in the microdistribution of deoxyglucose throughout this time course. This study extends previous in vitro work and confirms the selectivity of deoxyglucose for viable cells over necrotic regions and for hypoxic cells over normoxic regions in vivo.
As the field of PET expands within nuclear medicine and allied specialties, the glucose analog radiopharmaceutical 18F-FDG is proving to be a radiochemical of wide utility. Ostensibly a tracer of glucose metabolism, it yields valuable information regarding the physiologic and biochemical status of tissues.
Initially, 2-14C-deoxy-d-glucose (14C-2DG) was used to study rates of glucose utilization in the brain (1). 18F-FDG was later developed (2) and this has proved of use in brain, heart, and tumor investigations (3–5). These tracers are transported into the cell mainly by the glucose transporters GLUT1 and GLUT4. Like glucose, they are then phosphorylated by hexokinase, but, unlike glucose, they are not metabolized further significantly. The phosphorylated metabolites are unable to leave the cell and their accumulation may be imaged. The use of sugar analogs to detect tumor sites and identify physiologic compartments is based on the increased rate of glycolysis of tumor cells. Variations in uptake of glucose analog throughout the tumor are assumed to reflect heterogeneity of tumor pathophysiology. Thus, increased uptake indicates viability and hypoxia, whereas decreased uptake indicates necrosis (6).
Information about the existence and extent of hypoxia in a tumor is useful, as hypoxic tumors are refractory to conventional therapy and are more likely to form metastases. The increased uptake of 18F-FDG in vitro by hypoxic tumor cells has been demonstrated (7–9). It may be that the increased rate of glycolysis of tumors is largely ascribable to increased uptake of glucose to support anaerobic glycolysis, mediated by an increase in expression of GLUT1 or translocation of GLUT4 to the cell membrane.
However, in ex vivo ischemic heart studies, in which one side of the heart was made ischemic or hypoxic while keeping the other side as a normoxic control, deoxyglucose analog uptake was decreased in the affected side compared with the control (10–12) (ischemia is a low tissue oxygenation state resulting from an obstruction of the vascular supply or inadequate blood flow, whereas tumor hypoxia is the reduction of tissue oxygen levels below normal physiologic levels, arising due to vascular obstruction [acute hypoxia] or the diffusion distance of oxygen through respiring tissue [chronic hypoxia]). The effect was more pronounced for 18F-FDG than 14C-2DG. This observation could have important implications when interpreting 18F-FDG oncologic images as it would go against the current doctrine of higher uptake in hypoxia compared with normoxia. If this effect of dissociation of the metabolism of glucose and its analogs also holds for regions of tumor that are hypoxic, then they will have decreased uptake of tracer relative to normoxic regions. This study was undertaken to investigate this effect in human colorectal xenografts.
We have undertaken this study to address the following: Having found that 14C-2DG is not a faithful surrogate for 18F-FDG in ischemic hearts, is it also not a faithful surrogate in hypoxic regions of tumors? We have compared the whole-body biodistribution of 18F-FDG and 14C-2DG in tumor-bearing mice. We report the microdistribution of both tracers in whole colorectal tumor sections, at times after isotope injection that would be used clinically. Radioluminography was used to quantitatively map the submillimeter distribution of injected tracer on a pixel-by-pixel basis. This technique has a resolution of 100 μm and gives a linear response over 4 orders of magnitude (13). Subsequently, the tumors were divided into regions of interest (ROIs) and the radioactivity in viable, hypoxic, and necrotic fractions of tumors was measured. This study follows our earlier work in ischemic heart with the aim of translating the findings to hypoxic tumor (10) and also yields valuable information regarding the localization of 18F-FDG in the major pathophysiologic tumor compartments.
MATERIALS AND METHODS
Animal Studies
The human colonic adenocarcinoma cell line LS174T (European Collection of Animal Cell Cultures) was used to develop a xenograft model in the flanks of female nude (nu/nu) mice (MF1; from our own breeding colony), which were 2- to 3-mo old and weighed 20–25 g. Subsequent passaging was by subcutaneous implantation of small tumor pieces (approximately 1 mm3). This tumor is a moderately differentiated carcinoembryonic antigen (CEA)-producing xenograft with small glandular acini, which secretes no measurable CEA into the circulation. All experiments complied with the United Kingdom Coordinating Committee on Cancer Research Guidelines for the Welfare of Animals in Experimental Neoplasia.
Whole-Body Biodistribution.
Food was withdrawn from cages 3 h before injection. Water remained available ad libitum. For comparative 18F-FDG/14C-2DG studies, each mouse was injected intraperitoneally with 0.4 mL of sterile saline containing 100 MBq 18F-FDG, 0.37 MBq 14C-2DG (specific activity, 1,861 MBq/mmol) (Sigma-Aldrich), and 1.5 mg of pimonidazole hydrochloride (60 mg/kg) (Natural Pharmacia International). At selected time points (30, 60, and 120 min), mice (n = 4 at each time point) were sacrificed by cervical dislocation and tissues were removed for counting. For 18F-FDG uptake, tissues were placed in preweighed tubes and counted on a Canberra-Packard Cobra 5003 counter. For 14C-2DG biodistribution, a method was adopted that has been previously described (14). Briefly, the same tissues were solubulized in 7 mol/L KOH for 2 wk. An aliquot (20 μL) of the resulting liquid was placed on a glass slide and allowed to dry. This was then exposed to a phosphor image plate for 8 d. The counts within the resulting images were then compared with standards to calculate the percentage injected dose per gram of tissue (%ID/g).
Radioluminography.
Tumors were frozen in isopentane cooled with liquid nitrogen. Sections were cut on a cryostat (10-μm thick, 16 sections at 3 different levels through the tumor, total of 48 sections from each tumor), air dried, fixed in acetone (10 min), and exposed to a phosphor storage plate (model SO230; Amersham) at room temperature. Direct contact was achieved using an exposure cassette. The images of 18F distribution were acquired by exposing the sections for 2 h. The 18F was then left to decay for 7 d. A second exposure for 21 d was used to obtain the distribution of 14C. Before each exposure, the residual image on the plate was erased with an Image eraser (Amersham). The latent image formed was converted to a quantitative digital image using a MD Storm 860 Phosphor plate reader (Amersham).
After exposure to phosphor storage plates, each tumor section was stained. Half of the sections were stained to demonstrate viability, and alternate sections were stained using an immunohistochemical technique to detect hypoxia. The sections were scanned and digitized using an HP desk scanner (Hewlett Packard Ltd.); the images were saved in true color tiff format (TIFF). Images of 18F-FDG and 14C-2DG distribution were registered independently with the corresponding stained histologic section using cross-correlation (15) and was performed using MD ImageQuant and Interactive Data Language (IDL). All registration software was written in IDL and was compiled on a personal computer, with a Pentium processor, running Windows NT (Microsoft).
Tumor Microdistribution of 18F-FDG and 14C-2DG
The radioluminograph images were interrogated, via the histologic section, to measure the degree of correlation of localization of the 2 radionuclides, on a pixel-by-pixel basis. An ROI was drawn around each tissue section on the true color image to define the tissue border. This ROI was then automatically copied onto the same position on the 18F-FDG and the 14C-2DG images. The Pearson correlation coefficient was then calculated between the pixel values within the ROI on the 18F and the 14C images.
Viability was demonstrated using hematoxylin and eosin (H&E). Eosin is a general cytoplasmic stain, whereas hematoxylin stains nuclei. Viable regions of tissue stain purple and necrosis stains pink, allowing the discrimination of these regions. ROIs were drawn to define the viable and necrotic regions. The counts and pixels in each compartment from each tumor were recorded and used to calculate the mean counts per pixel. Data presented are the means ± SD for 4 tumors.
Pimonidazole is a 2-nitroimidazole that is trapped and metabolized only in viable hypoxic cells (<10 mm Hg (16)). Pimonidazole metabolites were detected using an established technique (17). Briefly, a rabbit polyclonal primary antibody (a gift from Prof. James A. Raleigh, University of North Carolina School of Medicine, Chapel Hill, NC) was applied to sections after incubation with a blocking serum (3%) to detect pimonidazole metabolites that had formed protein adducts only in hypoxic cells. Hypoxia was then visualized using a sequence of avidin-biotin peroxidase complexes and diaminobenzidine tetrahydrochloride, which produces an insoluble dark brown precipitate at the site of antibody binding, and these regions where defined as hypoxic while the remaining viable region was defined as normoxic. ROIs were drawn on images of pimonidazole-stained sections of the tumor. H&E-stained adjacent sections were used to determine viable and necrotic regions on the pimonidazole-stained sections. Once the ROI was drawn, the blue normoxic and brown hypoxic pixels were identified using an in-house written program, discriminating between the 2 on a color (red, green, blue) basis to take account of the complex staining patterns. Counts per pixel were then calculated as with viable or necrotic analysis.
RESULTS
Whole-Body Biodistribution
The whole-body biodistributions of 18F-FDG and 14C-2DG in nude mice bearing LS174T human tumor xenografts at 0.5, 1, and 2 h after injection are presented in Table 1. Overall, the pattern of distribution of each nuclide was similar, with differences in the blood, liver, and kidney, suggesting a difference in mechanism of clearance.
Biodistribution of 18F-FDG and 14C-2DG in Nude Mice Bearing LS174T Human Tumor Xenografts
Tumor Microdistribution of 18F-FDG and 14C-2DG
A typical H&E-stained section, a section demonstrating hypoxia as indicated by pimonidazole metabolites, and corresponding radioluminographs of 18F-FDG and 14C-2DG from the same sections are shown in Figure 1. The phosphor images shown arise from the tissue section on the same panel. Contiguous sections were stained using H&E and immunohistochemistry. Visually, the distributions of the 2 tracers were very similar.
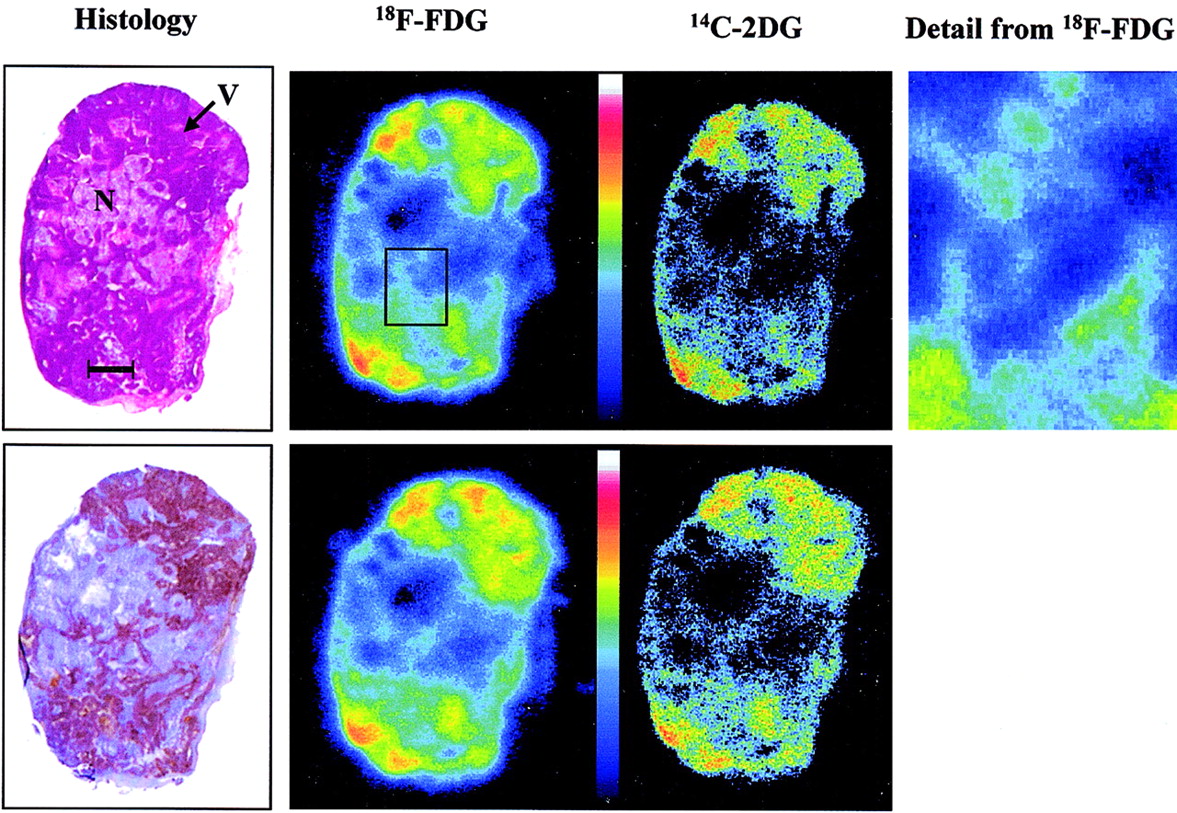
Typical images show histology and corresponding radioluminographs show radionuclide distribution within tumor sections. H&E demonstrates general morphology (top), staining viable regions (V) darker than necrotic regions (N). Hypoxia was demonstrated using immunohistochemical method to detect 2-nitroimidazole metabolites (bottom). Bar = 2.0 mm. High-resolution image shows detail from 18F-FDG image.
Based on the injected activity of 18F (100 MBq) and 14C (0.37 MBq) and decay constants of 1.052 × 10⁻⁴ s−1 and 3.836 × 10⁻¹² s−1 for 18F and 14C, respectively, we estimate that the contribution of 18F to the first image was 99.16% and contribution to the second image was of the order of 1 × 10⁻³²%.
The Pearson correlation coefficient comparing the overall tumor distribution of the 2 radionuclides was calculated and found to be 0.85 ± 0.10 (mean ± SD; P < 0.0001), indicating that their microdistribution was highly similar.
Twelve sections were analyzed per tumor (144 sections in total), comprising a total of 4.5 × 106 pixels interrogated to investigate the localization of the tracers in viable and necrotic tissue. It was found that counts from both radiotracers were higher in the viable fraction of the tumors. The ratio between viable and necrotic mean counts per pixel was 1.96 (P < 0.001). The mean counts per pixel in the viable region were normalized to 100, and overall mean counts per pixel in the necrotic region for 18F-FDG and 14C-2DG were 48.73 ± 28.5 and 51.75 ± 23.8, respectively. Figure 2A shows that this relationship remained time invariant throughout the course of the experiment.

Graphs show relative distribution of radiotracers within major pathophysiologic compartments of tumor. (A) Comparison of mean counts per pixel from 18F-FDG and 14C-2DG in viable and necrotic regions. (B) Comparison of mean counts per pixel in hypoxic and normoxic regions, throughout time course described (n = 4 for each time point; error bars are 1 SD about mean).
Again, 12 sections were analyzed for the hypoxia selectivity of the tracers for each tumor, giving a total of 144 sections throughout the experiment and 2.3 × 106 pixels interrogated. It was found that 53.6% ± 6.9% of viable pixels stained positive for hypoxia (Po2 < 10 mm Hg) (16). This was consistent throughout the time points. Higher mean counts per pixel were detected from both radiotracers in the hypoxic region. The ratio between hypoxic mean counts per pixel and normoxic mean counts was 1.26 (P < 0.005). The mean counts per pixel in the hypoxic region was normalized to 100, and overall mean counts per pixel in the normoxic region for 18F-FDG was 79.74 ± 11.74 and for 14C-2DG was 78.91 ± 10.66. Figure 2B shows that the microdistribution of the 2 tracers in the compartments described was consistent and did not vary appreciably over this time course. Hypoxic uptake compared with normoxic uptake for the 2 tracers was not significantly different (P = 0.85).
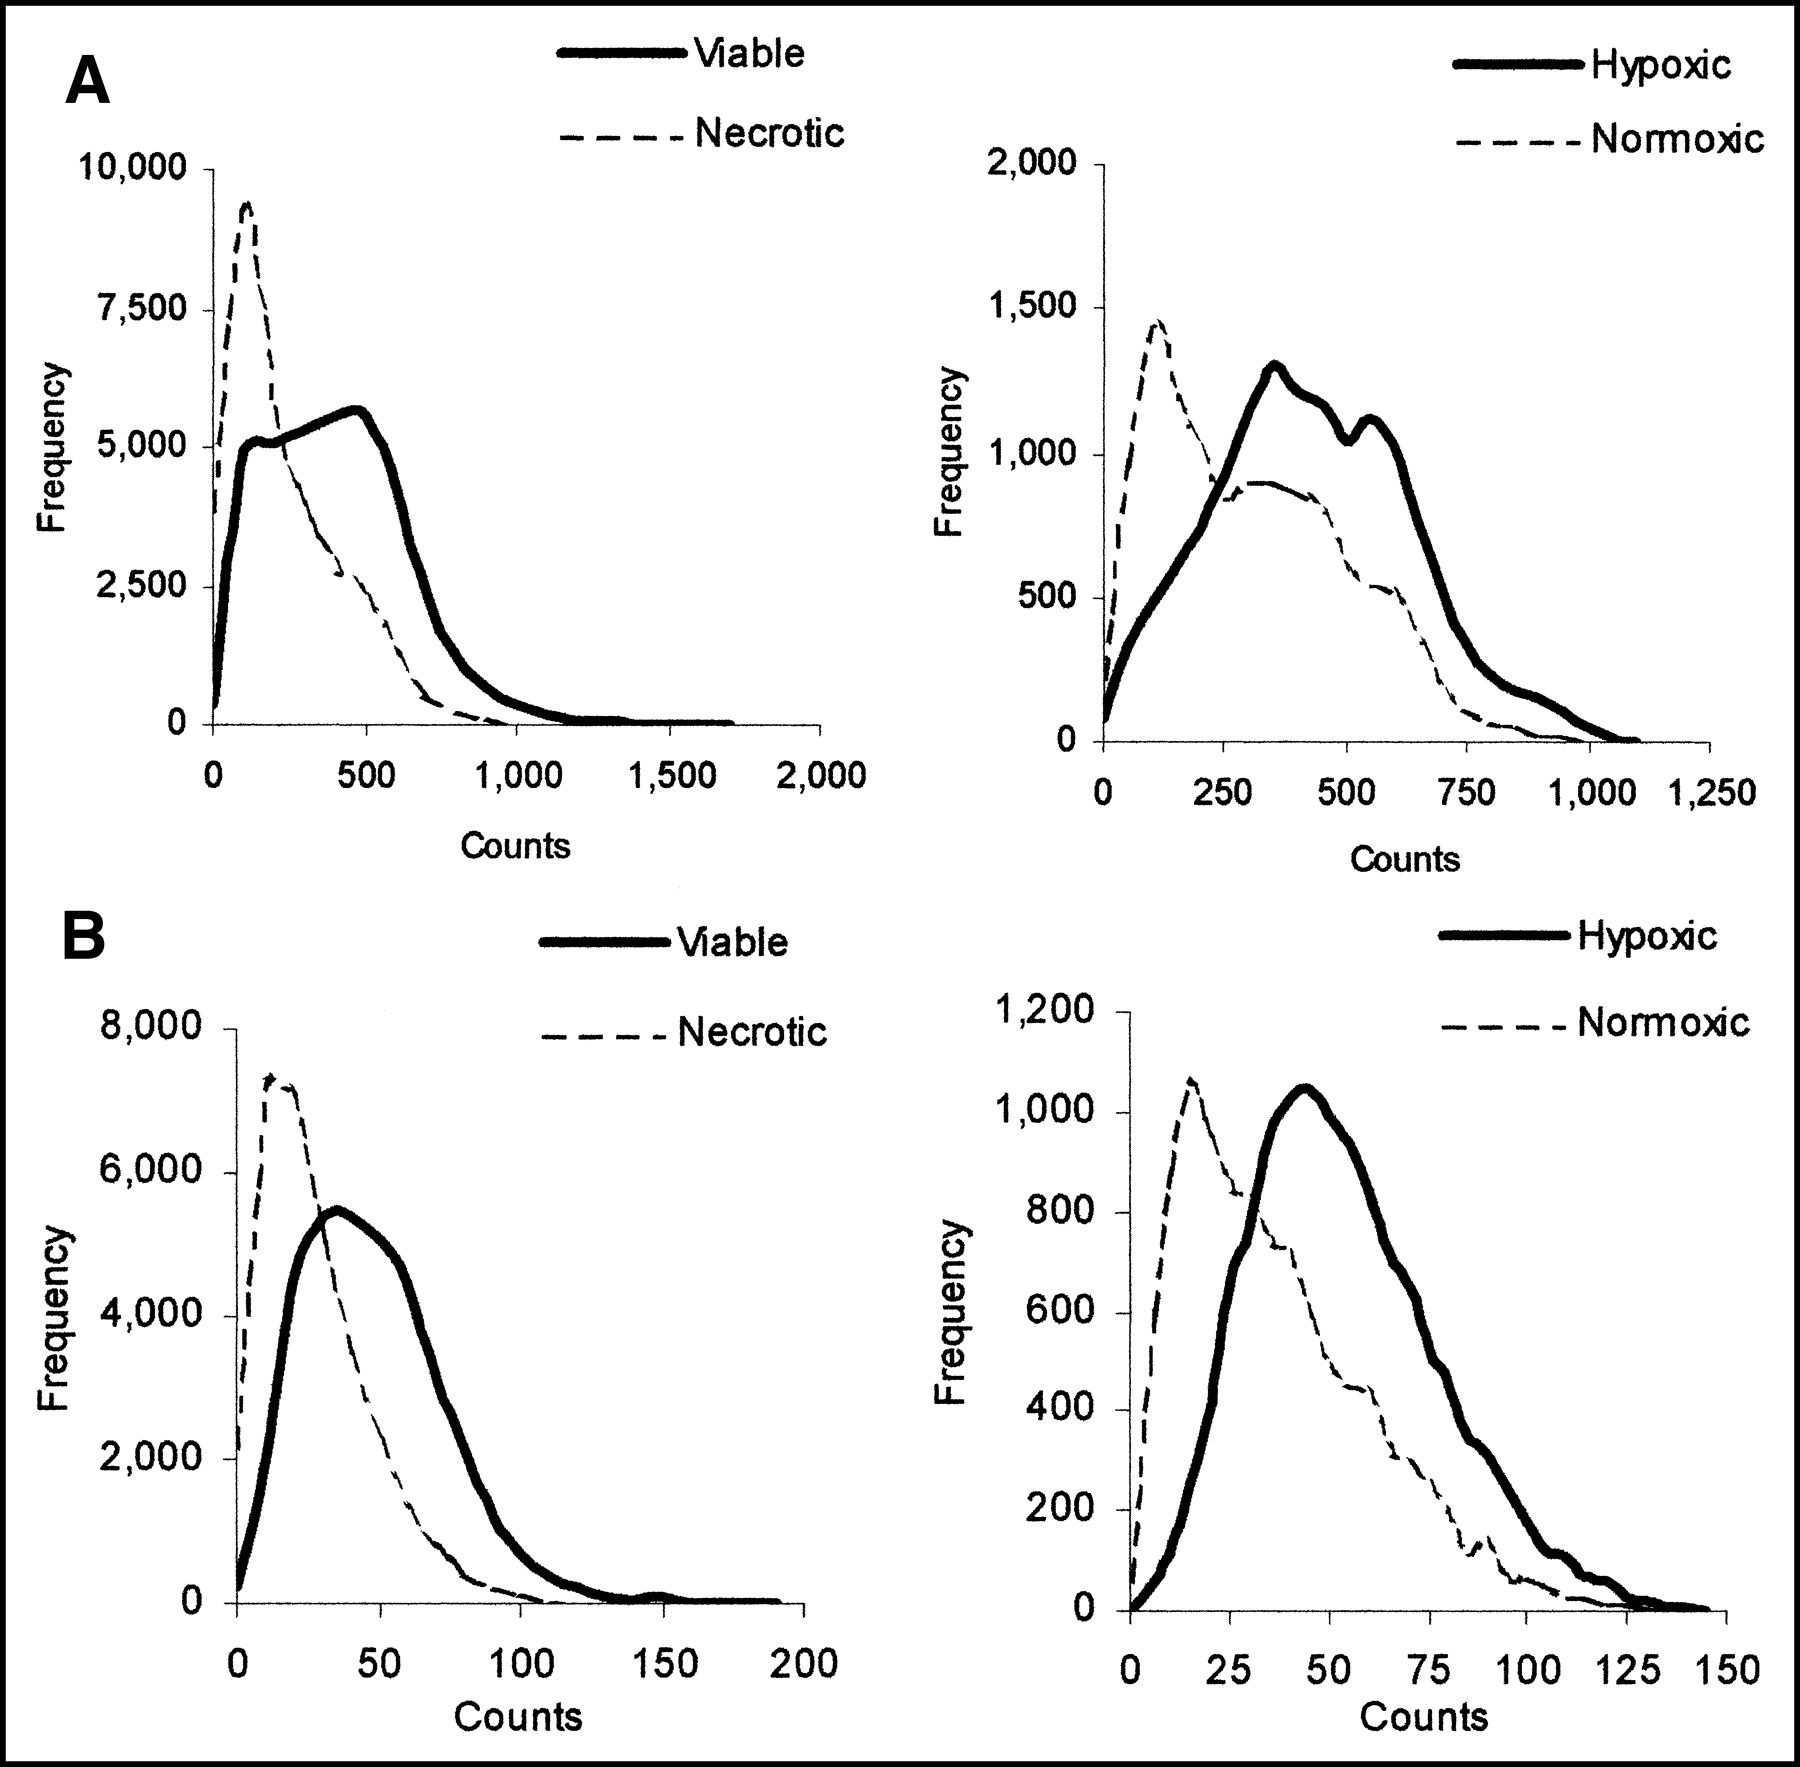
Graphs in Figure 3 show the mean background, minimum, mean, and maximum counts in viable and necrotic regions (Fig. 3A) and in hypoxic and normoxic regions (Fig. 3B) for each time point. Comparable maximum and minimum counts were detected in all regions—that is, whereas the mean counts per pixel were highest in the hypoxic region, then the viable normoxic region, and, finally, lowest in the necrotic region, comparable hot spots and cold spots were detected in all. To show that these data are representative and were not due to noise, graphs of count frequency of both tracers in viable and necrotic regions and in hypoxic and normoxic regions at 30 min are presented in Figure 4.
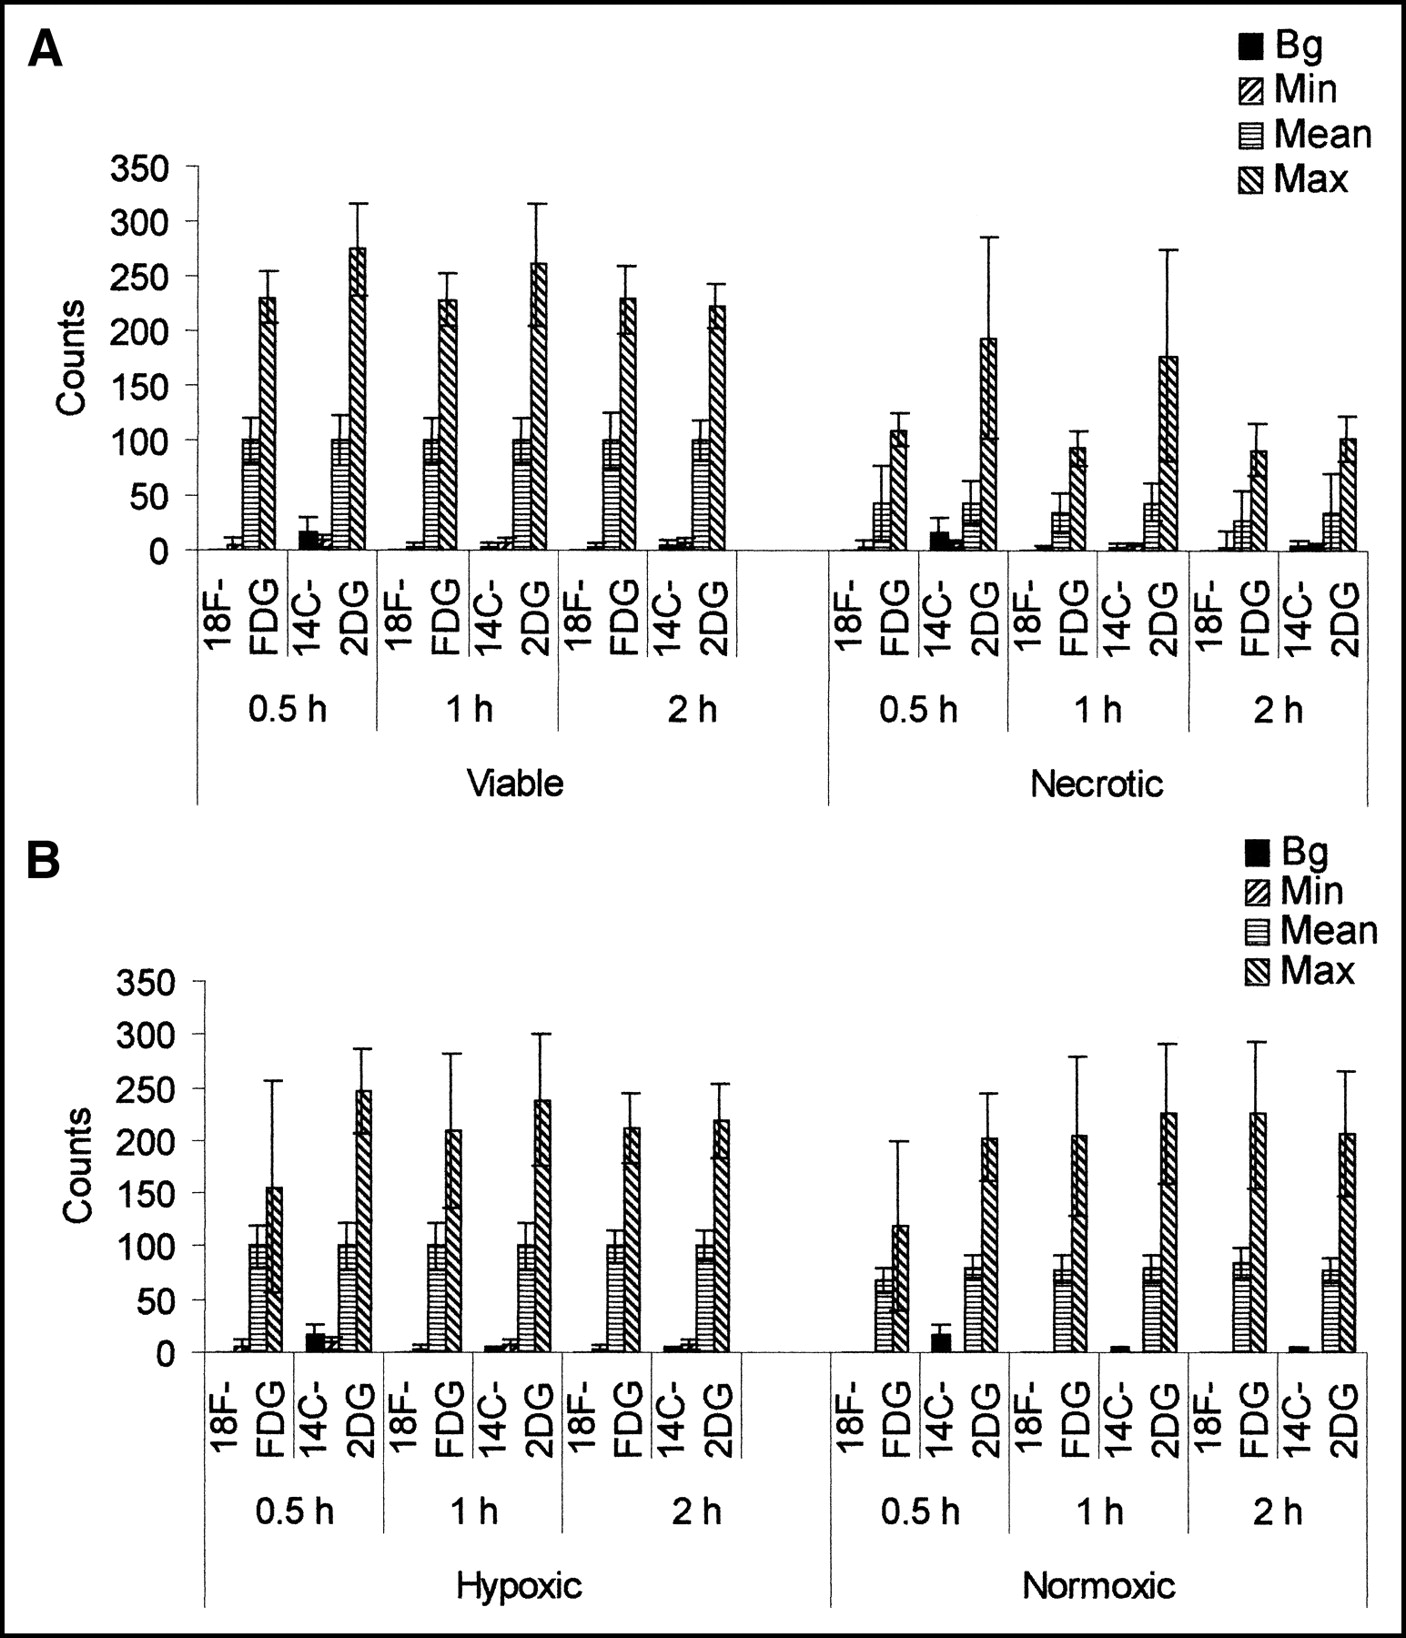
Graphs show background (Bg), minimum (Min), mean, and maximum (Max) counts in viable and necrotic (A) and in hypoxic and normoxic (B) regions of tumor. For sake of comparison, datasets were normalized so that mean viable and mean hypoxic values on y-axis are 100 (n = 4 for each time point; error bars are 1 SD about mean).

Graphs show count frequency in viable and necrotic regions and in hypoxic and normoxic regions of tumors from 18F-FDG (A) and 14C-2DG (B) at 30 min. Counts on x-axis are actual counts recorded.
DISCUSSION
In this study, the whole-body biodistributions and the tumor microdistributions of 18F-FDG and 14C-2DG, at times after isotope injection that would be used clinically, have been investigated in a model system. Whole-body biodistributions of the 2 tracers are reported in Table 1. The data, with significant (P < 0.05) differences in blood, kidney, and liver, suggest that clearance of the 2 radiopharmaceuticals, or their metabolites, may differ.
The microdistributions of the 2 radionuclides across whole tumor sections appeared to be very similar (Fig. 1). This was confirmed by a Pearson correlation coefficient of 0.85 ± 0.10 (P < 0.0001). A similarly high Pearson correlation coefficient was found when 18F-FDG and 14C-2DG heart microdistributions were compared in an ex vivo rat heart study (12), but analysis of relative counts in ischemic and control regions revealed significant differences in their uptake. The aim of this study was to investigate this effect in the tumor.
Viable and necrotic regions of tumor were identified using the H&E stain. ROIs were drawn and counts in each area were recorded. The observation that more deoxyglucose (both 18F-FDG and 14C-2DG) appeared to be trapped in viable regions than in necrotic regions was confirmed, with the ratio between viable and necrotic mean counts throughout the experiment being 1.96 (P < 0.005).
Similarly, the mean counts per pixel in the viable hypoxic and normoxic regions were compared. Identification of regional hypoxia was achieved using a well-established immunohistochemical system, involving the detection of metabolites of a 2-nitroimidazole, pimonidazole, in hypoxic tissue (17). Counts within regions that had stained positive for hypoxia were compared with counts in the rest of the viable region (defined as normoxic). The ratio between mean counts in hypoxic and normoxic regions for the 2 tracers was 1.26 (P < 0.001), demonstrating that higher counts are observed in hypoxic regions than in normoxic regions of tumors. The mean counts per pixel from 18F-FDG and 14C-2DG in hypoxic regions compared with normoxic regions were compared and no statistically significant difference was detected (P = 0.86). This ratio compares with that observed by others using in vitro systems to compare uptake of 18F-FDG by hypoxic cancer cells. Human cancer cells, incubated under a range of oxygen concentrations (0%–20%) for various periods of time (15 min to 24 h), have demonstrated a significant increase in uptake of FDG by hypoxic cells compared with normoxic controls. This increase has tended to show some positive relationship with the duration and level of hypoxia. After a 1.5-h exposure to a 5% O2 atmosphere, melanoma cells and ovarian carcinoma cells increased 3H-FDG uptake by 40% and 37%, respectively (7), and, in anoxic human breast carcinoma cells, uptake over normoxic controls was increased by 2.53 ± 0.79 fold over 1 h (9). The increase in uptake we have found is comparable with that reported by others in vitro, though our in vivo ratio is smaller. This may reflect the availability of systemically delivered tracer that may be trapped initially by normoxic cells in vivo, reducing the amount available to hypoxic cells. Though it may be assumed that such an increase may be mediated by increased production of GLUTs and hexokinase, there was no significant increase in expression of genes that are influenced by hypoxia (HIF-1α, HIF-1β, Hex-II, GLUT-1, GLUT-3) (9). However, increased membrane expression of GLUTs has been observed in hypoxic cells (7), suggesting that one cause of the increase observed may be the translocation of transporters to the cell membrane.
A range of counts was recorded in all 3 regions (viable normoxic, viable hypoxic, and necrotic), including comparable minima and maxima (Figs. 3 and 4)—that is, both hot spots and cold spots were observed in all regions. Hot spots may reflect variations in cell biology, such as increased expression of GLUTs, whereas cold spots may be due to poor perfusion. Localization of the nuclides in viable regions is presumably due to active uptake, metabolism, and cellular trapping of the radiotracer. However, localization in the necrotic region may be nonspecific retention of the radiotracer or its metabolites (18) or active uptake by white blood cells, as has been previously reported in vitro (19,20). To demonstrate how the counts were distributed, Figure 4 shows the count frequency within each region at 30 min, for both tracers. The data for 60 and 120 min were similar to the 30-min data.
It is notable that the tumor microdistribution of neither tracer changed between tumor regions throughout the time course. Optimally, 18F-FDG scans for clinical imaging of oncologic patients would be performed at 1 h after injection, the point of peak uptake (4), but this is not always practical. Given that PET scanners often obtain a whole-body scan by combining several sections of the body, a more realistic scanning time is between 30 min and 2 h. It was found in this study that the tumor microdistribution in viable normoxic, viable hypoxic, and necrotic compartments, for both 18F-FDG and 14C-2DG, is comparable throughout this time course. This may indicate that the trapping of the radiotracers is stable or that their microdistributions between these compartments are subject to a dynamic equilibrium that becomes established <30 min after injection.
In ex vivo ischemic rat heart studies, where one side of the heart was made ischemic and the other was maintained as normoxic control, the uptakes of 18F-FDG and 14C-2DG were both decreased compared with that of the control, but 18F-FDG uptake was depressed further than 14C-2DG (12). It was postulated that this difference arose because of the cellular response to ischemia or hypoxia—that is, when the cell becomes hypoxic, hexokinase, which is the primary enzyme responsible for deoxyglucose trapping, is translocated to the mitochondria. This is advantageous to the cell, as adenosine triphosphate may be supplied directly to the enzyme to increase the efficiency of glucose metabolism. However, this also alters the affinity of the enzyme for glucose analogs. Deoxyglucose uptake is therefore decreased as its previously good fit for hexokinase is decreased, and this is more marked for 18F-FDG because it is less similar in structure to glucose than 14C-2DG.
18F-FDG is a tracer of glucose metabolism widely used in PET imaging. Its usefulness in an oncologic setting is largely due to the increased utilization of glucose by tumors. The tumor image often has cold spots, usually interpreted as necrosis, and hot spots, which are frequently interpreted as regions of hypoxia. In this study, we also investigated whether the dissociation of glucose and deoxyglucose metabolism, which we previously observed in ischemic hearts, also occurs in tumor metabolism, as a significant fraction of all solid tumors is hypoxic. We found, however, that this was not the case for tumors, because no significant difference in uptake of the 2 tracers was observed.
The reason for the dissociation not being observed here may be due to tumor cell biology. In the heart, the tissue is well supplied with nutrients, such as glucose and oxygen. It is not until the heart is stressed—for example, made ischemic—that its constituent cells alter their metabolism and the dissociation that we have reported occurs. However, in the tumor the situation is very different. The tissue is permanently in a stressed state, with uncontrolled proliferation, regions of low pH, angiogenesis being driven by stress factors, significant proteomic and genomic variations, and, of course, hypoxia prevalent throughout. All of these may contribute to a situation in which the majority, if not all, tumor cells are in what might be regarded as a stressed state. Therefore, we may not have observed a difference in trapping between 18F-FDG and 14C-2DG in normoxic and hypoxic tumor cells because the cells that occupy the region we described as normoxic are effectively reacting in the same way to stress as the hypoxic cells and may not be metabolically and physiologically distinct.
CONCLUSION
In this study, the whole-body distribution and tumor microdistribution of 18F-FDG and 14C-2DG have been compared and have been found to be highly similar in each case. The microdistribution of both radiotracers in human tumor xenografts over a clinical scanning time frame have been analyzed and found to be time invariant in all major pathophysiologic compartments (viable normoxic, viable hypoxic, and necrotic) throughout the time course.
Acknowledgments
We express our gratitude to Prof. James A. Raleigh for the kind gift of polyclonal antibody raised against pimonidazole protein adducts. We are grateful for financial support provided by Cancer Research UK, the Association for International Cancer Research, and the Trusthouse Charitable Foundation.
Footnotes
Received May 14, 2003; revision accepted Oct. 3, 2003.
For correspondence or reprints contact: Jason L.J. Dearling, PhD, Cancer Research UK Targeting and Imaging Group, Academic Department of Oncology, Royal Free and University College Medical School, Royal Free Campus, University College London, Rowland Hill St., Hampstead, London NW3 2PF, U.K.
E-mail: j.dearling{at}ucl.ac.uk
REFERENCES
In this issue


Jump to section
Related Articles
Cited By...
- Concomitant [18F]F-FAZA and [18F]F-FDG Imaging of Gynecological Cancer Xenografts: Insight into Tumor Hypoxia
- Lactic Acid Accumulation in the Tumor Microenvironment Suppresses 18F-FDG Uptake
- Combining Radioimmunotherapy with Antihypoxia Therapy 2-Deoxy-D-Glucose Results in Reduction of Therapeutic Efficacy
- Impact of Animal Handling on the Results of 18F-FDG PET Studies in Mice
- Biologic Correlates of Intratumoral Heterogeneity in 18F-FDG Distribution with Regional Expression of Glucose Transporters and Hexokinase-II in Experimental Tumor