


Abstract
Because recent reports have questioned the traditional 2-compartment model for calculating tracer clearance after a single intravenous injection, a 3-compartment model was evaluated in this study. Methods: Bayesian statistics were used, which facilitated curve fitting by treating all subjects simultaneously. 99mTc-Mercaptoacetyltriglycine clearance data from 154 adults and 109 children were measured at several centers, typically 6–9 plasma samples spanning 5–90 min, and fitted by 2- and 3-compartment Bayesian models. Results: Clearance estimates were found to be systematically lower for the 3-compartment model than for the 2-compartment model. A single-sample procedure based on the 3-compartment model was found to eliminate most of the known discrepancy between formulas based on single-injection and continuous-infusion reference methods. Conclusion: A 3-compartment model led to lower and probably more accurate clearance estimates than the conventional 2-compartment model. A new single-sample method is presented, based on the 3-compartment model as reference standard.
The usual reference method for measuring clearance of the tubular tracers 131I-o-iodohippurate (131I-OIH) and 99mTc-mercaptoacetyltriglycine (99mTc-MAG3) has been based on multiple plasma samples after bolus intravenous injection. The plasma time–activity curve is fitted to a sum of 2 exponential terms (corresponding to a 2-compartment model), and clearance is calculated from the area under the fitted curve after extrapolating to infinite time. Although this technique has been repeatedly validated against continuous-infusion p-aminohippurate clearance for 131I-OIH (1–6) and against single-injection urine clearance for 99mTc-MAG3 (7), several recent reports raise questions of its validity.
One discrepancy is between single-sample formulas based on the single-injection multisample reference method (8–10) and a formula (11) that is based partly (i.e., for adult subjects) on a continuous-infusion reference method and partly (for pediatric subjects) on a multisample reference method. The formulas agree well at low-to-moderate levels of clearance but diverge in the high normal range. A second discrepancy is between the usual 2-compartment model for 99mTc-MAG3 (with data collection to 90 min) and a 3-compartment model (with data collection to 180 min) (12–15).
In this study, a new and more stable curve-fitting procedure based on Bayesian statistics (16) was used to fit a 3-compartment model to 99mTc-MAG3 clearance curves from 154 adults and 109 children. When the 3-compartment model was used, most of the discrepancy between single-injection and continuous-infusion results vanished.
MATERIALS AND METHODS
Data from a prior publication (8) were reevaluated. For the adult subjects (n = 154), data were obtained from the University of Alabama at Birmingham (Birmingham, AL), the Veterans Administration Medical Center (Salt Lake City, UT), Emory University (Atlanta, GA), St. Joseph’s Health Center (London, Ontario, Canada), and, by courtesy of Dr. Amnon Piepsz, several centers in Belgium. For children (n = 109), data were obtained from members of the Pediatric Task Group of the European Association of Nuclear Medicine (17). The pediatric subjects ranged in age from 6 mo to 19 y old, including 4 who were <1 y old.
Plasma activity (expressed as a percentage of the administered dose per liter of plasma) and corresponding sample times (expressed as time after injection) were measured for at least 6 samples per subject. Typical data consisted of 8 points spanning the time interval beginning 5–10 min after injection and ending 90 min after injection for adults and 60 min after injection for children, although sampling continued to 180 min for 5 adults (for these, the 99mTc-MAG3 preparation had been purified by high-performance liquid chromatography). The height and weight of each subject were recorded. Further details can be found in the original reports (8,17,18).
In contrast to the traditional practice of fitting separately the data from each subject, the Bayesian treatment fits all subjects simultaneously, forcing subjects of similar size to have similar compartmental parameters. This stabilized the problem and permitted fitting a third compartment. This model was previously applied to the clearance of 99mTc-diethylenetriaminepentaacetic acid (99mTc-DTPA) and a full discussion is included in this earlier work (16). Briefly, in the present work, a 2-compartment model was first fitted by Bayesian regression (19) to yield compartmental parameters V1, L21, and L12, corresponding, respectively, to the volume of the sampled compartment (compartment 1) and to the transfer rates from compartment 1 to compartment 2 and from compartment 2 to compartment 1. Next, a catenary 3-compartment model was fitted, with additional parameters L32 and L23 representing the transfer rates from compartment 2 to compartment 3 and from compartment 3 to compartment 2, respectively. All available samples were used for the 3-compartment model, but when only 2 compartments were used, samples later than 100 min were excluded to match the time interval used in most previous studies of tubular agents that used the 2-compartment model. The parameters V1, L21, L12, L32, and L23 were permitted to vary randomly (lognormally) from subject to subject. In contrast, the clearance for each subject was treated as a fixed (not random) parameter characteristic of that subject. A lognormal gaussian distribution was assumed for the errors of measurement (assuming that volumetric errors dominate). The likelihood function for the resulting nonlinear model was derived by the procedure described by Gelman et al. for the closely related linear model (16,19). The Bayesian prior distribution was taken, as suggested by Gelman et al., as a scaled inverse χ2 distribution that embraced a physically reasonable range for the variance parameters (1%–11% relative SD for plasma tracer activity and 8%–40% for compartmental parameters). Clearances were constrained to be nonnegative, and V1 values were constrained to be not less than the normal plasma volume of 3 L. These constraints were active for only occasional subjects and the effect on normalization of the likelihood function was ignored. The mode of the posterior distribution was calculated using the maximum-likelihood program published by Bunch et al. (20), using a matrix diagonalization algorithm to represent the compartmental model (21).
Compartmental parameters were scaled for patient height and weight, scaling the volumes (V1) by body weight and fluxes (L21, L12, L32, L23) by body surface area. The rationale for this scaling method has been discussed elsewhere (16,22). Body surface area was calculated by the formula of Haycock et al. (23).
After fitting a preliminary Bayesian model to the entire group of 263 subjects simultaneously, the fitted time–activity curves were examined for each subject. Gross deviations were found for 4 of 154 adults and for 7 of 109 children. These datasets were excluded from calculation of statistical parameters but were retained for the illustrations. Because of the more robust properties of the Bayesian model, fewer exclusions were necessary than when these data were fitted by conventional means (8), despite fitting an additional compartment.
RESULTS
Clearances calculated by the 2-compartment and 3-compartment Bayesian models are compared in Figure 1. The 2-compartment model is plotted as ordinate against the 3-compartment model as abscissa, with the line of identity shown for comparison. These 2 estimates of clearance were closely correlated, but the 2-compartment estimates were systematically higher, with a mean difference of 20.3 mL/min/1.73 m2. Data for all 263 subjects are shown in Figure 1, although 11 of these were excluded from the statistical calculations because of poor fit between the model and the plasma time–activity curve. Only 1 of the 11 rejected curves was an outlier in terms of clearance and is conspicuous in Figure 1.

Comparison between 2- and 3-compartment models: multisample plasma clearance (mL/min/1.73 m2) from 2-compartment model vs. that from 3-compartment model. Line of identity is shown.
The estimated compartmental parameters are shown in Table 1 for the 2-compartment model and in Table 2 for the 3-compartment model. The median and relative SD are given for each parameter, because the model assumed that logarithms of the parameters were normally distributed and those statistics retain simple forms under logarithmic transformation.
Parameter Estimates (Lognormal) for 2-Compartment Model
Parameter Estimates (Lognormal) for 3-Compartment Model
To estimate clearance from a single plasma sample, various formulas have been proposed. Instead of an empiric formula, the compartmental model can be used directly, using Newton’s method to find the clearance corresponding to any observed plasma activity (24). The results of Newton’s method are shown in Figure 2 for 2- and 3-compartment Bayesian models. For comparison, the widely used formula of Bubeck et al. (11) is also shown. (The plasma sample nearest 45 min was used for adults and the one nearest 35 min was used for children.) There was less scatter with the Bayesian methods than with the method of Bubeck et al., but the 2-compartment single-sample clearance was systematically high (relative to the 3-compartment multisample reference method), with most points lying above the line of identity. This difference in the single-sample estimates reflects the systematic difference between the 2 models that was noted above for multisample estimates. Statistics are presented in Table 3. The systematic error for the 2-compartment method was 21.4 mL/min/1.73 m2 (mean difference) using a single sample, which may be compared with the above value of 20.3 mL/min/1.73 m2 for multiple samples.

Clearance calculated by different single-sample methods (mL/min/1.73 m2), each vs. Bayesian multisample clearance. cpt. = compartment.
Comparison of Various Methods with 3-Compartment Multisample Reference Method
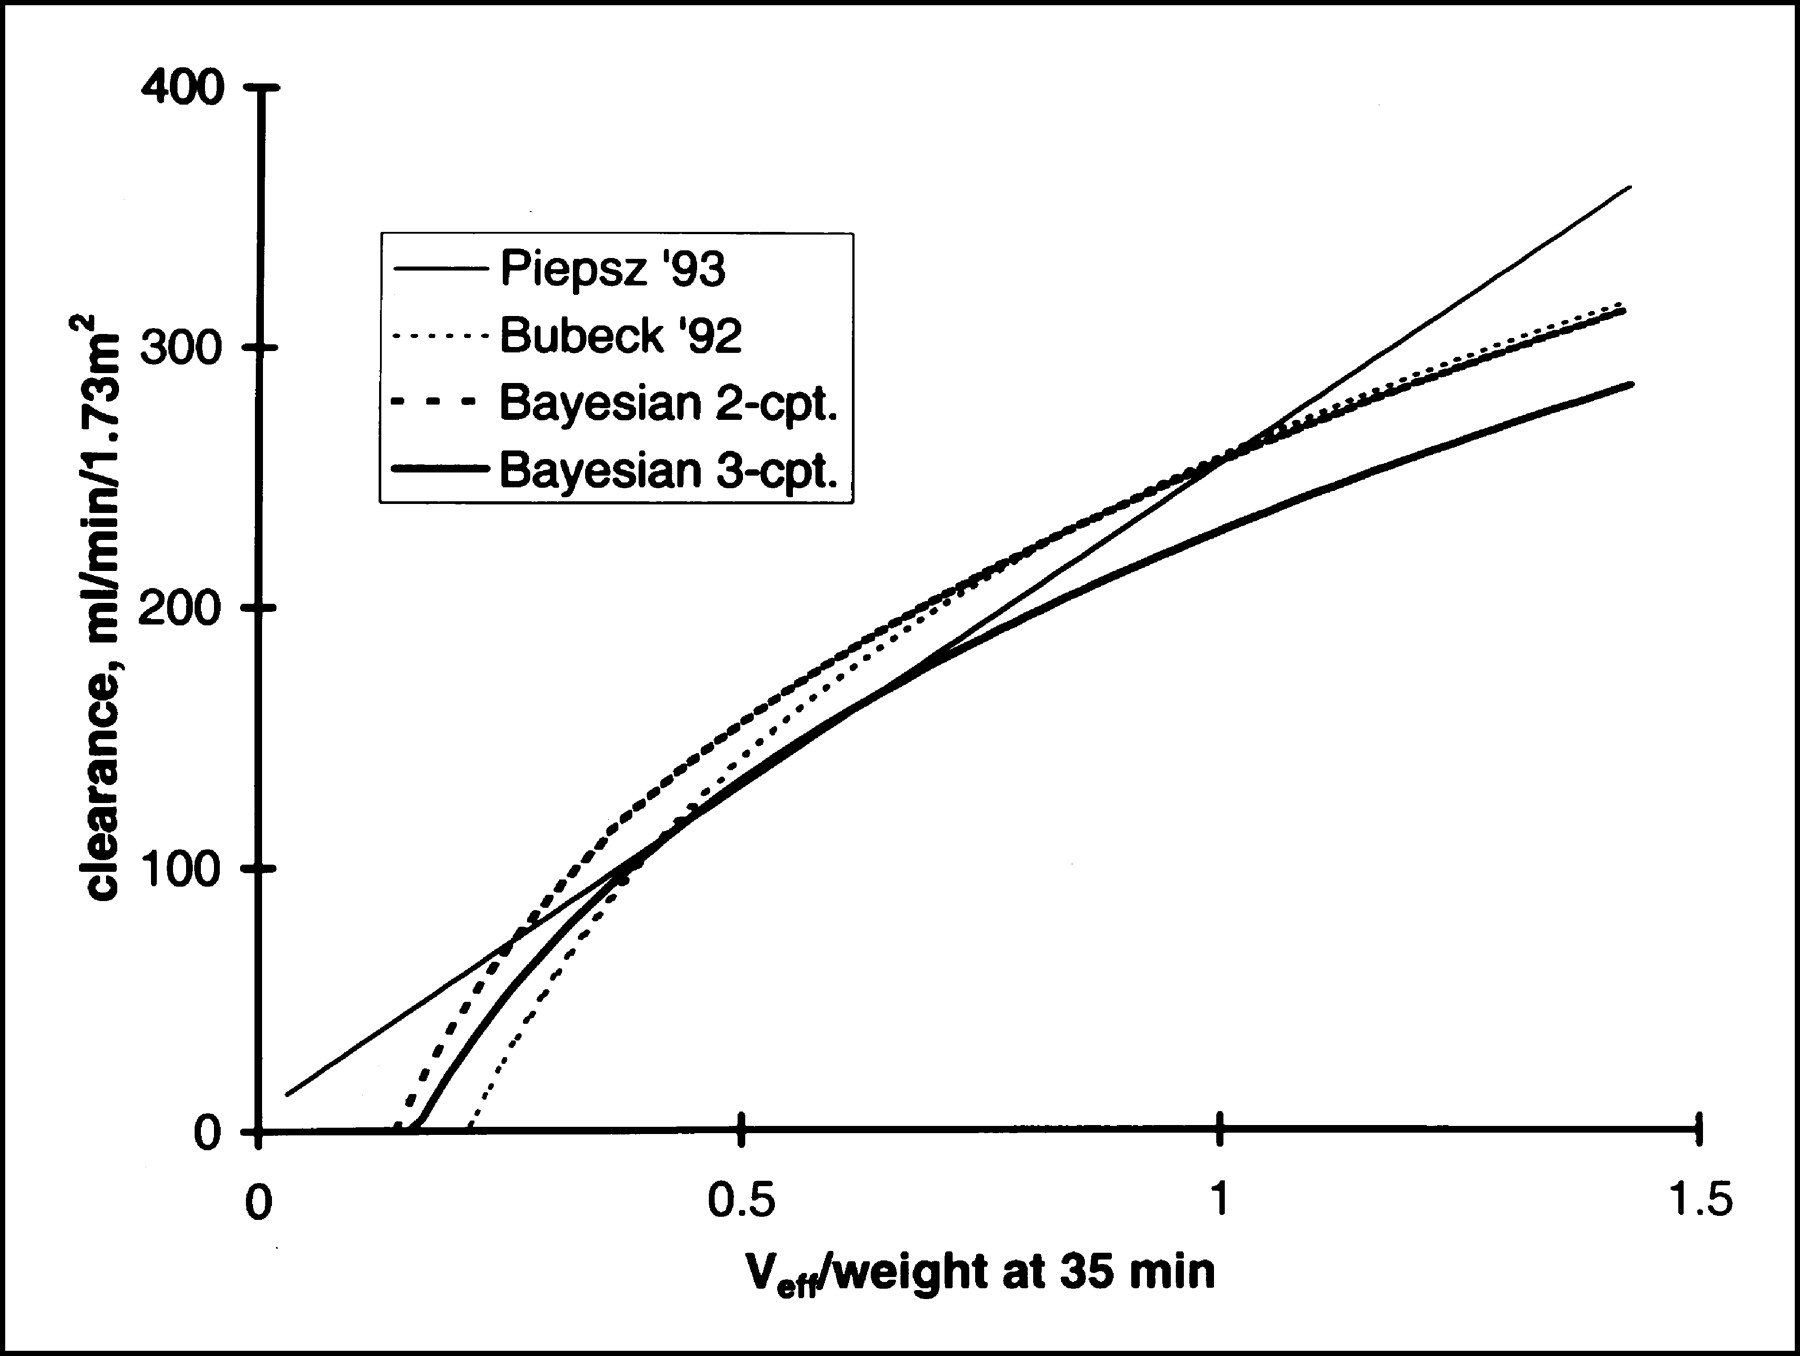
The single-sample methods are compared another way in Figure 3. Clearance estimates calculated by different single-sample methods are shown as a function of plasma activity for an adult of normal height and weight (taken as 170 cm and 70 kg). Plasma activity, plotted on the abscissa, was expressed as effective volume of distribution at 45 min after injection. The 2- and 3-compartment Bayesian models are shown as heavy lines. The method of Bubeck et al. (11) and our previous empiric method (8) are shown as lighter lines. The 2-compartment model agreed closely with our previous empiric formula (also based on 2 compartments) except at the highest clearance values, where it yielded lower values. The 3-compartment model yielded results at high clearance that were lower still, not far from those of the method of Bubeck et al. Similar plots for a 1-y-old child of normal height and weight (taken as 76.1 cm and 10.15 kg) are shown in Figure 4. The 2- and 3-compartment Bayesian models are shown as heavy lines and the methods of Bubeck et al. (11) and Piepsz et al. (17) are shown as lighter lines. For the 1-y-old child, agreement among the methods was only moderate.
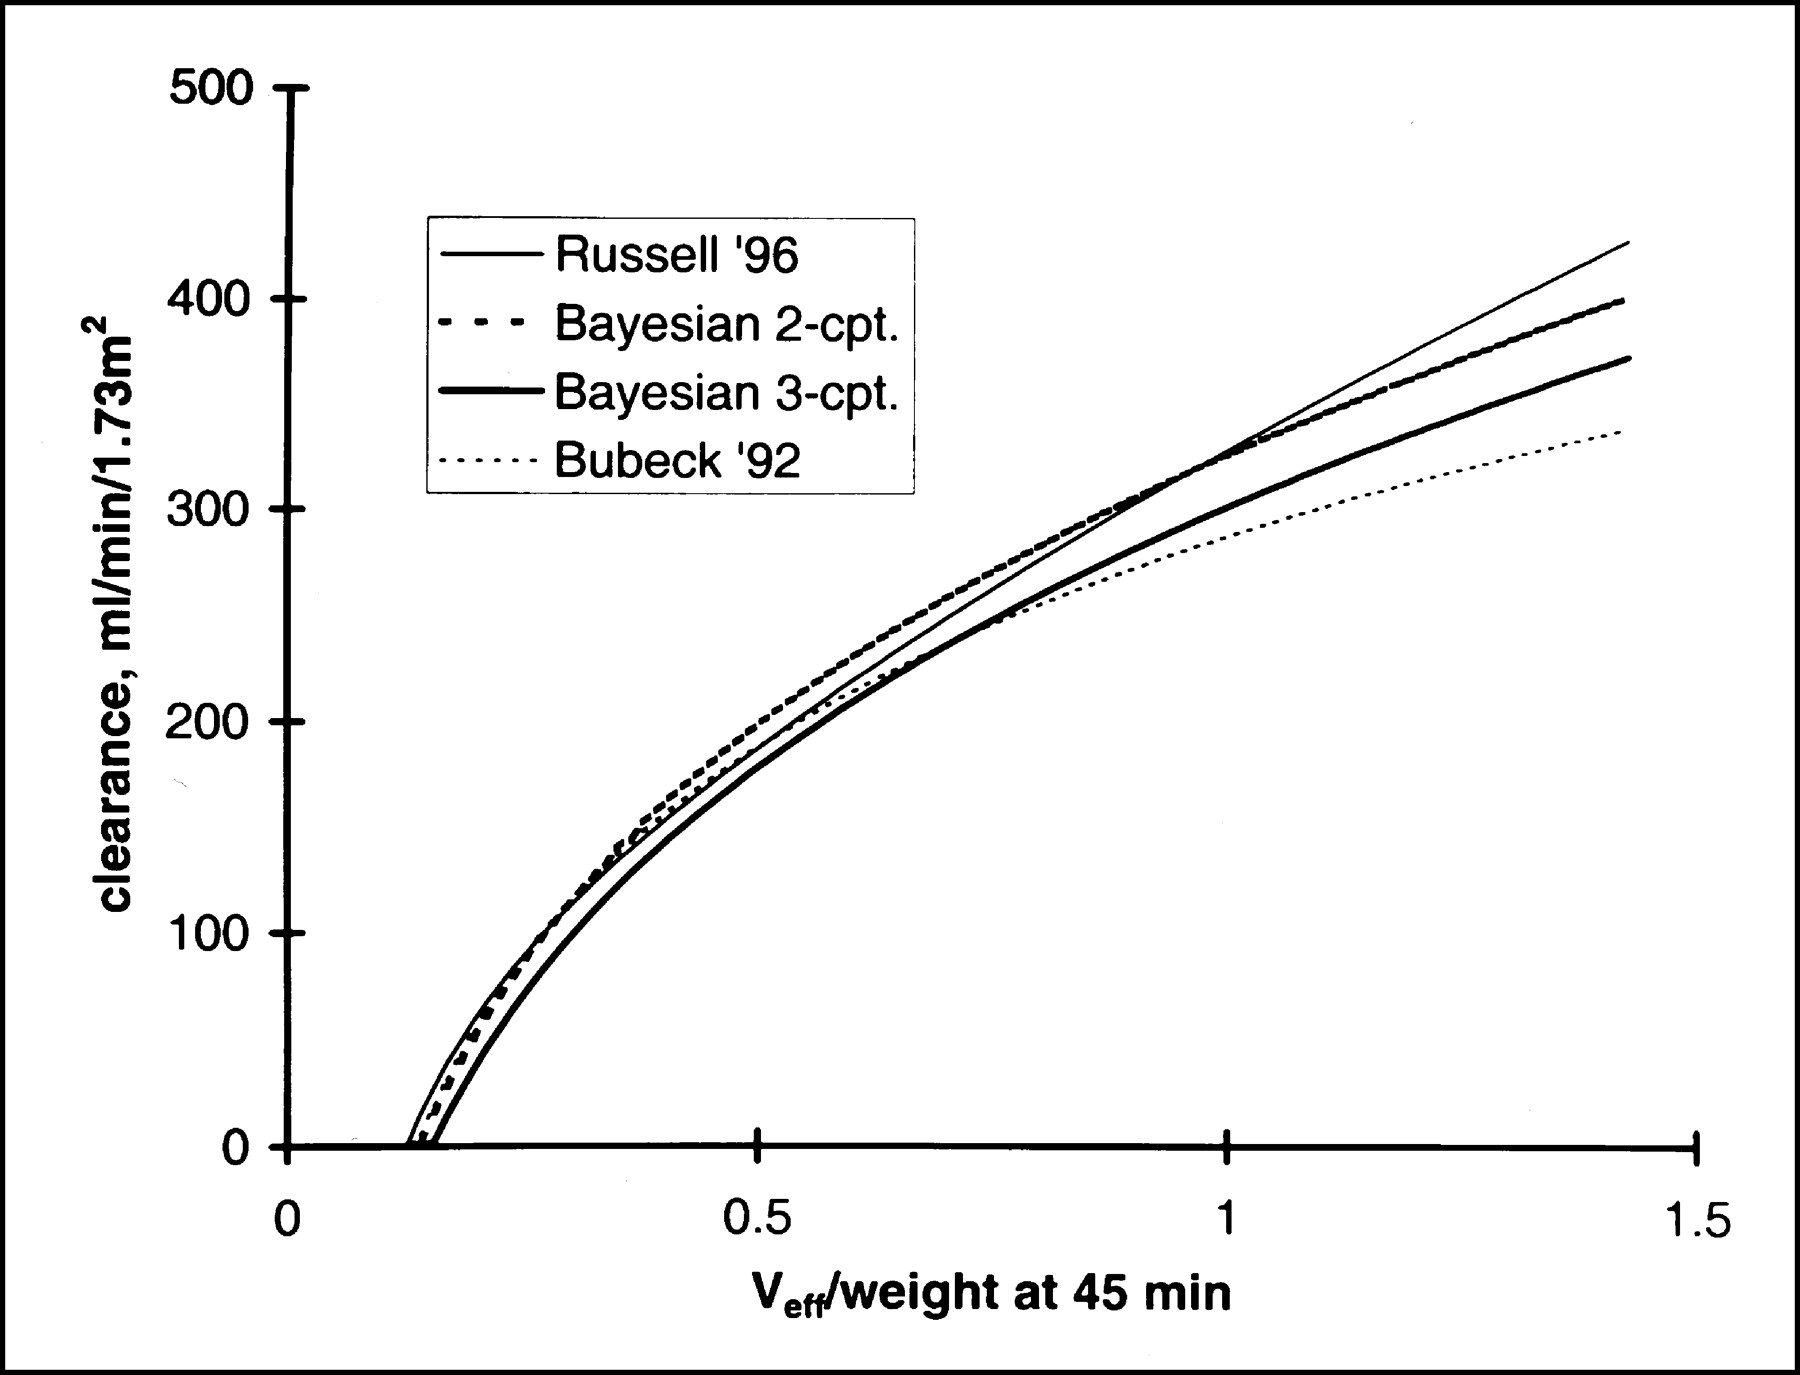
Clearance calculated by 4 methods from effective volume of distribution (Veff) at 45 min for adult of normal height and weight. cpt. = compartment.

Clearance calculated by 5 methods from effective volume of distribution (Veff) at 35 min for 1-y-old child of normal height and weight. cpt. = compartment.
DISCUSSION
Multisample clearances calculated from the 3-compartment model were systematically lower than those from the 2-compartment model, the difference averaging 20.3 mL/min/1.73 m2. Every single-sample method is based on some reference method as the gold standard and, because the 3-compartment model led to lower reference values, the single-sample method based on 3 compartments also led to lower values. The lower values eliminated most of the reported discrepancy (8,10) between formulas based on a single-injection reference method and the formula of Bubeck et al. (11), which was based on a combination of reference methods (for adults, continuous infusion; for children, single injection with a 2-compartment model).
On the other hand, the 2-compartment model has been repeatedly validated in the case of 131I-OIH, another tubular agent similar in some respects to 99mTc-MAG3, and has been validated against urine clearance for 99mTc-MAG3 as well (7). These reports suggest that the 2-compartment model should not be too hastily rejected.
For a radiochemically pure tracer, 3 compartments should be better than 2, because the clearance value is determined solely by the area under the time–activity curve and the extra compartment permits a closer fit to the experimental data. In the presence of radiochemical impurities, the situation is less clear. In the case of 131I-OIH, for example, free iodide, a common impurity, is excreted more slowly than OIH and lingers in circulation, increasing with time as a percentage of circulating activity. The “final slope” is that for the impurity, not that for 131I-OIH. Impurity levels as low as a few percent can cause significant errors in clearance measurements, even with sampling times as short as 1 h (25–27). Thus, for 131I-OIH, one hesitates to discard the empirically validated 2-compartment model or to extend the sampling time. Similar considerations apply to 99mTc-DTPA, because commercial preparations contain a slowly excreted radiochemical impurity that can render clearance estimates inaccurate (26,27). What about 99mTc-MAG3? Although radiochemical impurities are present at the level of a few percent in commercial preparations of 99mTc-MAG3 and the properties of these impurities have not been studied, there is at present no evidence that they cause appreciable errors in clearance measurements (28–30). Thus, it appears that use of the 3-compartment model can be justified for 99mTc-MAG3.
CONCLUSION
A 3-compartment model leads to lower and probably more accurate clearance estimates than the conventional 2-compartment model, because the additional compartment permits closer fit to the experimental data. Using the 3-compartment model as reference method, a single-sample technique is presented that eliminates most of the discrepancy between our previous formula (8) and that of Bubeck et al. (11).
Footnotes
Received Dec. 13, 2002; revision accepted Apr. 21, 2003.
For correspondence or reprints contact: Charles D. Russell, MD, PhD, Division of Nuclear Medicine, University of Alabama Hospital, 619 S. 19th St., Birmingham, AL 35233.
E-mail: crussell{at}uab.edu
REFERENCES
In this issue


Jump to section
Related Articles
Cited By...
- No citing articles found.