


Abstract
Primary progressive aphasia (PPA) is rare. Only limited series have been reported with SPECT or PET. Moreover, in the majority of studies, the left-to-right asymmetry ratio was used, leading to difficulties in right hemisphere analyzes. Methods: Twenty-nine patients with clinical criteria of PPA (Mesulam and Weintraub) were included and compared with 12 control subjects. Complete language examination was performed in all patients. SPECT was performed on a double-head gamma camera after intravenous injection of hexamethylpropyleneamine oxime (22 patients and 12 control subjects) or ethylcysteinate dimer (7 patients). Nineteen regions of interest (ROIs) were drawn on each hemisphere in all patients using the Talairach atlas. The perfusion index (PI = cortex-to-cerebellum ratio) was calculated for each ROI. Atrophy was quantified on MRI by consensus of 3 observers in 16 cortical ROIs. ANOVAs were used to compare the PI between (a) patients and control subjects, (b) patients with (n = 15) or without (n = 14) lexicosemantic abnormalities (LS+ vs. LS−) and patients with (n = 19) or without (n = 10) arthric disorders (A+ vs. A−), and (c) patients with or without atrophy. Results: In the 29 patients, the PI was significantly lower in the left temporopolar, left lateral temporal, left Wernicke, left parietal, and right lateral temporal cortex when compared with control subjects (P < 0.001). In LS+ patients versus control subjects, the PI significantly decreased in the left temporal cortex (lateral temporal; medial temporal; temporopolar; Wernicke), left Broca, left parietal, and right lateral temporal cortex (P < 0.001). In addition, LS+ versus LS− comparison showed a significant decrease in the left lateral, left medial temporal, and left Broca cortex (P < 0.001). In comparison with control subjects, the PI was not significantly different in A+ patients, whereas in A− patients the PI was significantly decreased in the left and right lateral temporal cortex, left Wernicke, and left parietal cortex. Moreover, the PI significantly decreased in the left lateral temporal region in A+ patients compared with A− patients. Finally, in patients without atrophy, the PI significantly decreased in the right and left lateral temporal cortex and the left parietal cortex (P < 0.01). Conclusion: Our study demonstrates that right-handed patients with PPA present a decreased perfusion in the bilateral temporal cortex. Moreover, in these regions, morphologic abnormalities are preceded by perfusion abnormalities. Finally, our results show that large left temporal dysfunction occurs in patients with LS disorders.
First described by Mesulam in 1982 (1), primary progressive aphasia (PPA) corresponds to a syndrome characterized by an isolated and progressive alteration of language not associated with dementia (2). This language dysfunction occurs in the absence of other abnormal cognitive functions (memory, reasoning, judgment, visuospatial capabilities), or behavioral abnormalities during a period of at least 2 y and without systemic disorders or cerebral lesion. First symptoms begin by anomia, and some patients have developed more severe fluent or nonfluent aphasia (3). Cerebral morphologic and functional imaging, in fact, plays an important role in the evaluation of PPA.
The role of morphologic cerebral imaging by tomodensitometry (TDM) or MRI is first to eliminate a tissue or vascular lesion, which could produce an acquired progressive aphasia (4). Moreover, they may reveal asymmetric focal atrophy in the dominant hemisphere (5). TDM is considered less sensitive than MRI to show focal atrophy (6). In the series of Westbury and Bub (7), including 112 patients with PPA, an important incidence of structural abnormalities was reported, no matter what type of aphasia was studied. In 104 MRI studies, 84% of unilateral or bilateral cortical abnormalities were observed. In 56%, a cortical left hemispheric atrophy was observed, in particular in the perisylvian region and in the temporal lobe. A left frontal atrophy was observed in a few cases (n = 9) and a parietal atrophy was observed in only 1 case. Among the 38 MRI studies with bilateral atrophy (43%), temporal (n = 6), frontal (n = 6), and perisylvian (n = 4) involvement was more frequent. In semantic dementia, atrophy predominates in the pole and in the inferolateral part of the left temporal lobe (3,8–11). In contrast, the hippocampus and parahippocampal gyrus appeared normal at the onset of the illness (12). A bilateral extension of atrophy has previously been suggested (8,11,13). In the nonfluent PPA, a unilateral (4,9,14–18) or bilateral (19–22) perisylvian or frontal atrophy has been demonstrated. Also, atrophy is sometimes more diffuse in the left frontotemporoparietal cortex (9,17,23,24). Isolated left temporal atrophy has rarely been mentioned (4,17).
Functional cerebral imaging with PET or SPECT generally shows larger abnormalities than morphologic ones. This phenomenon is explained by the deafferentation of the region connected to the atrophic areas or by neuronal loss not visible on morphologic imaging (4,6). Major parts of functional imaging studies have been case reports or small series ranging from 2 to 13 patients. These studies were performed with 18F-FDG PET or with 99mTc-hexamethylpropyleneamine oxime (HMPAO) SPECT. They often showed a decrease in metabolism or perfusion in the left hemisphere, including temporal, frontal, or parietal lobes and, more specifically, in the left Broca or Wernicke cortex. Tyrrell et al. (9,19) have observed a decrease in metabolism in the right hemisphere, but only in patients with long-evolution duration (6 and 8 y). Right frontal abnormalities have been observed in nonfluent aphasia (3,10,25). Right temporal hypoperfusion has been observed by Sinnatamby et al. (6) but only in 1 patient with PPA associated with a visual agnosia. Recently, San Pedro et al. (26) reported a right temporal hypoperfusion in 2 right-handed women with long- evolution duration (7 y). These studies show that few series exist regarding functional imaging in patients with PPA. They frequently correspond to case reports that did not provide information in a homogeneous group of patients.
The aims of our study in patients with PPA was (a) to evaluate the perfusion changes using SPECT imaging, (b) to correlate SPECT and clinical symptoms, and (c) to compare SPECT and morphologic imaging.
MATERIALS AND METHODS
Patients
Twenty-nine patients (13 F, 16 M; mean age ± SD, 65.1 ± 8.2 y) studied between 1992 and 1999 were included in the study. All patients except 1 were right handed. The duration of the PPA was 4.1 ± 1.9 y. The educational level was beyond high school for 7 patients, below high school but above elementary school for 7, and below elementary school for 15.
These patients had PPA defined according to Mesulam and Weintraub criteria (2). All patients presented a progressive alteration of language for >2 y without dementia (normal visual memory and visuoconstructive capacity).
Performance on nonverbal intelligence tests was assessed by the Raven’s Colored Progressive Matrices (PM47) and the visual memory subtest of the Wechler Memory Scale (WMS) (immediate reproduction of nonsignificant drawings). Accuracy of response for both tests had to be in the range of normality. Moreover, visuospatial relations had to be as follows: normal Rey Complex Figure test in copy and standard mark for age ≥ 7 y at the Weschler Adult Intelligence Scale (WAIS) test. This threshold was determined from previously published results.
Neurologic examination and cerebral imaging were performed to exclude cerebral lesions. General examination and vitamin B12, folic acid, and thyroid- stimulating hormone dosages were obtained to exclude general pathology. For all patients, the delay between neuropsychologic examination and cerebral imaging was <6 mo.
Control Subjects
Patients were compared with 12 control subjects (8 women, 4 men; mean age ± SD, 74.1 ± 3.9 y) followed in the French prospective Eugeria study (27) regarding neuropsychologic evaluation in the elderly. In these patients, the Mini Mental Score Examination (MMSE) (28), a Computerized Cognitive Examination (29) repeated all years over 3 y, remained normal (MMSE ≥ 29/30). Morphologic imaging (MRI or CT) was normal in 12 control subjects. The control subjects were significantly older than the patients (74.3 ± 4.2 y vs. 65.1 ± 8.2 y; F = 13.97; P = 0.0006).
Language Examination
Two major parts of the language were explored: lexicosemantic comprehension and arthric realization. Results of language examination and patient grouping are presented in Table 1.
Results of Neuropsychologic Tests and Grouping
Lexicosemantic Comprehension.
Verbal comprehension of isolated words (comprehension) was evaluated using 5 tests: the verbal discrimination test of the Boston Diagnostic Aphasia Examination (BDAE) (test 2, score on 72), a multiple choice designation test with 3 images (Designation [DES1], score on 48), a multiple choice designation test with 27 images (DES2, score on 27), a semantic category classification test on verbal and visual modality (Cat, score on 220), and an association test on verbal and visual modality derived from the Pyramids and Palm Trees paradigm (App, score on 20). All of these tasks were based on the Semantic Knowledge Battery.
The 29 patients were divided into 2 groups, according to existence (or not) of lexicosemantic disorders (LS+ and LS−, respectively). LS+ patients were those who obtained marks inferior or equal to the mean minus 2 SDs at the semantic category classification test or at the verbal word pairment test. Patients 9–23 were included in the LS+ subgroup, and patients 1–8 and 24–29 were in the LS− subgroup.
Arthric Disorders.
Arthric realization was evaluated using 3 tests: articulation agility, arthric realization (BDAE tests 08 and 06, respectively), and repetition of 110 words. For this task, results were expressed as the ratio (%) between phonetic errors and total errors. For each word, a mistake was considered as phonetic when it consisted of transforming the phoneme with simplification (change without stopping between 2 phonemes) or of total deterioration. Phoneme moves, accentuations, and elisions were not considered as phonetic errors.
Patients were divided into 2 other groups according to existing (or not) arthric disorders (A+ and A−, respectively). Patients 1–10, included in the A+ group, showed word repetition impairment, regardless of the level of phonetic mistakes. Patients 11–29, included in the A− group, made no phonetic error for the same task.
SPECT
SPECT was performed on all 29 patients and 12 control subjects in a double-head gamma camera (DST; Sopha Medical Vision International) equipped with ultra-high-resolution, parallel-hole collimators. SPECT was performed 15 min after intravenous injection of 1,000 MBq 99mTc-HMPAO (n = 22 patients and control subjects) or 1 h after intravenous injection of 1,000 MBq 99mTc-ethylcysteinate dimer (ECD) (n = 7 patients) under conditions of low light and sound. The subject’s head was safely positioned in an adjustable head folder. For each SPECT study, 64 angular views of 60 s each were obtained through a 360° circular orbit (64 angular views by head). The data were recorded in a 128 × 128 matrix. SPECT images were reconstructed from projection data using the filtered backprojection algorithm with a 0.5 cutoff-frequency Hann filter and a software zoom of 2 (matrix, 128 × 128 × 128; voxel size, 1.7 × 1.7 × 1.7 mm). No attenuation correction was performed. SPECT full width at half maximum at the center was 7.4 mm in air (gyration radius, 12.5 cm). The acquisition and reconstruction parameters that were used have proven to be the best adapted for standard brain SPECT studies in clinical practice in our department (30).
Reconstructed brain slices were reoriented according to the bicommissural line (anterior commissure–posterior commissure [AC–PC]) with validated software. First, the AC–PC line was defined on SPECT images from the linear regression of 4 internal landmarks (frontal pole, inferior limit of the anterior corpus callosum, subthalamic point, and occipital pole). Second, the SPECT position of the AC and PC points on the AC–PC line were automatically determined from measurements made on hard copies of MR images of all patients. Finally, a proportional Talairach’s grid was automatically drawn on each axial SPECT image. The mean displacement between the estimated accuracy of the AC and PC localization have been shown to be inferior to the pixel size and represent a maximum error of <5 mm in the cortex localization. Intra- and intercomparisons of the method have been reported (31).
Eighteen cortical region of interest (ROIs) and 1 thalamic ROI were defined on each hemisphere, using stereotactic coordinates of the Talairach and Tournoux atlas (32). Segmentation was performed with the software previously described. The regions and anatomic boundaries of the ROIs are presented in Figure 1.

Brain systematization. (A) Lateral side. (B) Medial side. Broca = Broca region; Calc = calcarine region; CinA = anterior cingulate region; EF = external frontal region; IF = internal frontal region; Insul = insular region; LobQ = lobulus quadrilatere; LT = lateral temporal region; MT = medial temporal region; Occ = occipital region; OF = orbitofrontal region; P = parietal lobe; PreC = precentral region; PreF = prefrontal region; SM = sensorimotor region; Tha = thalamus; TP = temporal pole; W = Wernicke region.
For each ROIs, cerebral blood flow (CBF) was evaluated using a perfusion index (PI) calculated as the cortex-to-cerebellum ratio.
MRI
Axial MRI slices were obtained using a 0.5- or 1.5-T MR scanner. Each subject was positioned so that MRI axial slices were parallel to the bicommissural line (AC–PC; 18 patients) or parallel to the orbitomeatal line (9 patients), which was verified on a midsagittal image. T1-weighted, 3-mm-thick axial slices were obtained throughout the whole brain. Two patients underwent TDM. The delay between SPECT and MRI was 3.5 ± 8.6 mo.
For the 29 patients, atrophy was quantified on 16 cortical ROIs of each cerebral hemisphere similar to those defined for SPECT (except for the calcarine region). ROIs were drawn on the axial slices by the same observer to improve reproducibility.
For each ROI, the atrophy was estimated on 1–3 axial slices by 3 observers, SPECT being blind. The atrophy was classified by the observers in 5 grades: absence of atrophy, 0; doubtful, 1; slightly, 2; significant, 3; severe, 4. Discrepancies were resolved by consensus. Finally, patients with grade 0 and grade 1 were grouped as nonatrophic (Atrop−), and patients with grades 2–4 were grouped as atrophic (Atrop+). MRI or TDM of the 12 control patients was normal and included in a third group (group C).
Data Analysis
The mean ± SD was used for descriptive statistics. For each ROI, the PI was compared between male versus female and between ECD versus HMPAO. For each ROI, the PI was correlated with age and duration of PPA evolution. Comparisons were performed using an unpaired t test, and correlations were performed using regression analysis. P ≤ 0.01 was considered significant. The Bonferroni post hoc test was performed for multiple tests when necessary.
All comparisons were performed for each ROI using ANOVA. First, the PI was compared between the 29 patients and the 12 control subjects. Second, the PI was compared between patients with (n = 15) or without (n = 14) lexicosemantic disorders and control subjects (n = 12) and between patients with (n = 10) or without (n = 19) arthric disorders and control subjects (n = 12). Third, the PI was compared between patients with (Atrop+) or without atrophy (Atrop−) and control subjects (n = 12). P ≤ 0.01 was considered significant. The Bonferroni post hoc test was performed for multiple tests when necessary.
RESULTS
For the 29 patients, results of neuropsychologic tests were 23 ± 4 for the MMSE, 113 ± 11 for the PM47 (Raven’s Progressive Matrix), 10 ± 3 for the WAIS (cube), 34 ± 2 for the Rey (copy), and 9 ± 3 for the WMS. Neuropsychologic tests were presented in Table 1.
The PI was not statistically different between men and women, whatever the ROI studied. The PI was not significantly different between patients studied with ECD or HMPAO, whatever the ROI studied. For this reason, patients studied with HMPAO and with ECD were pooled in the entire study. No correlation was found between the PI and the evolution duration whatever the ROI studied.
Comparison of PI in Patients and Control Subjects
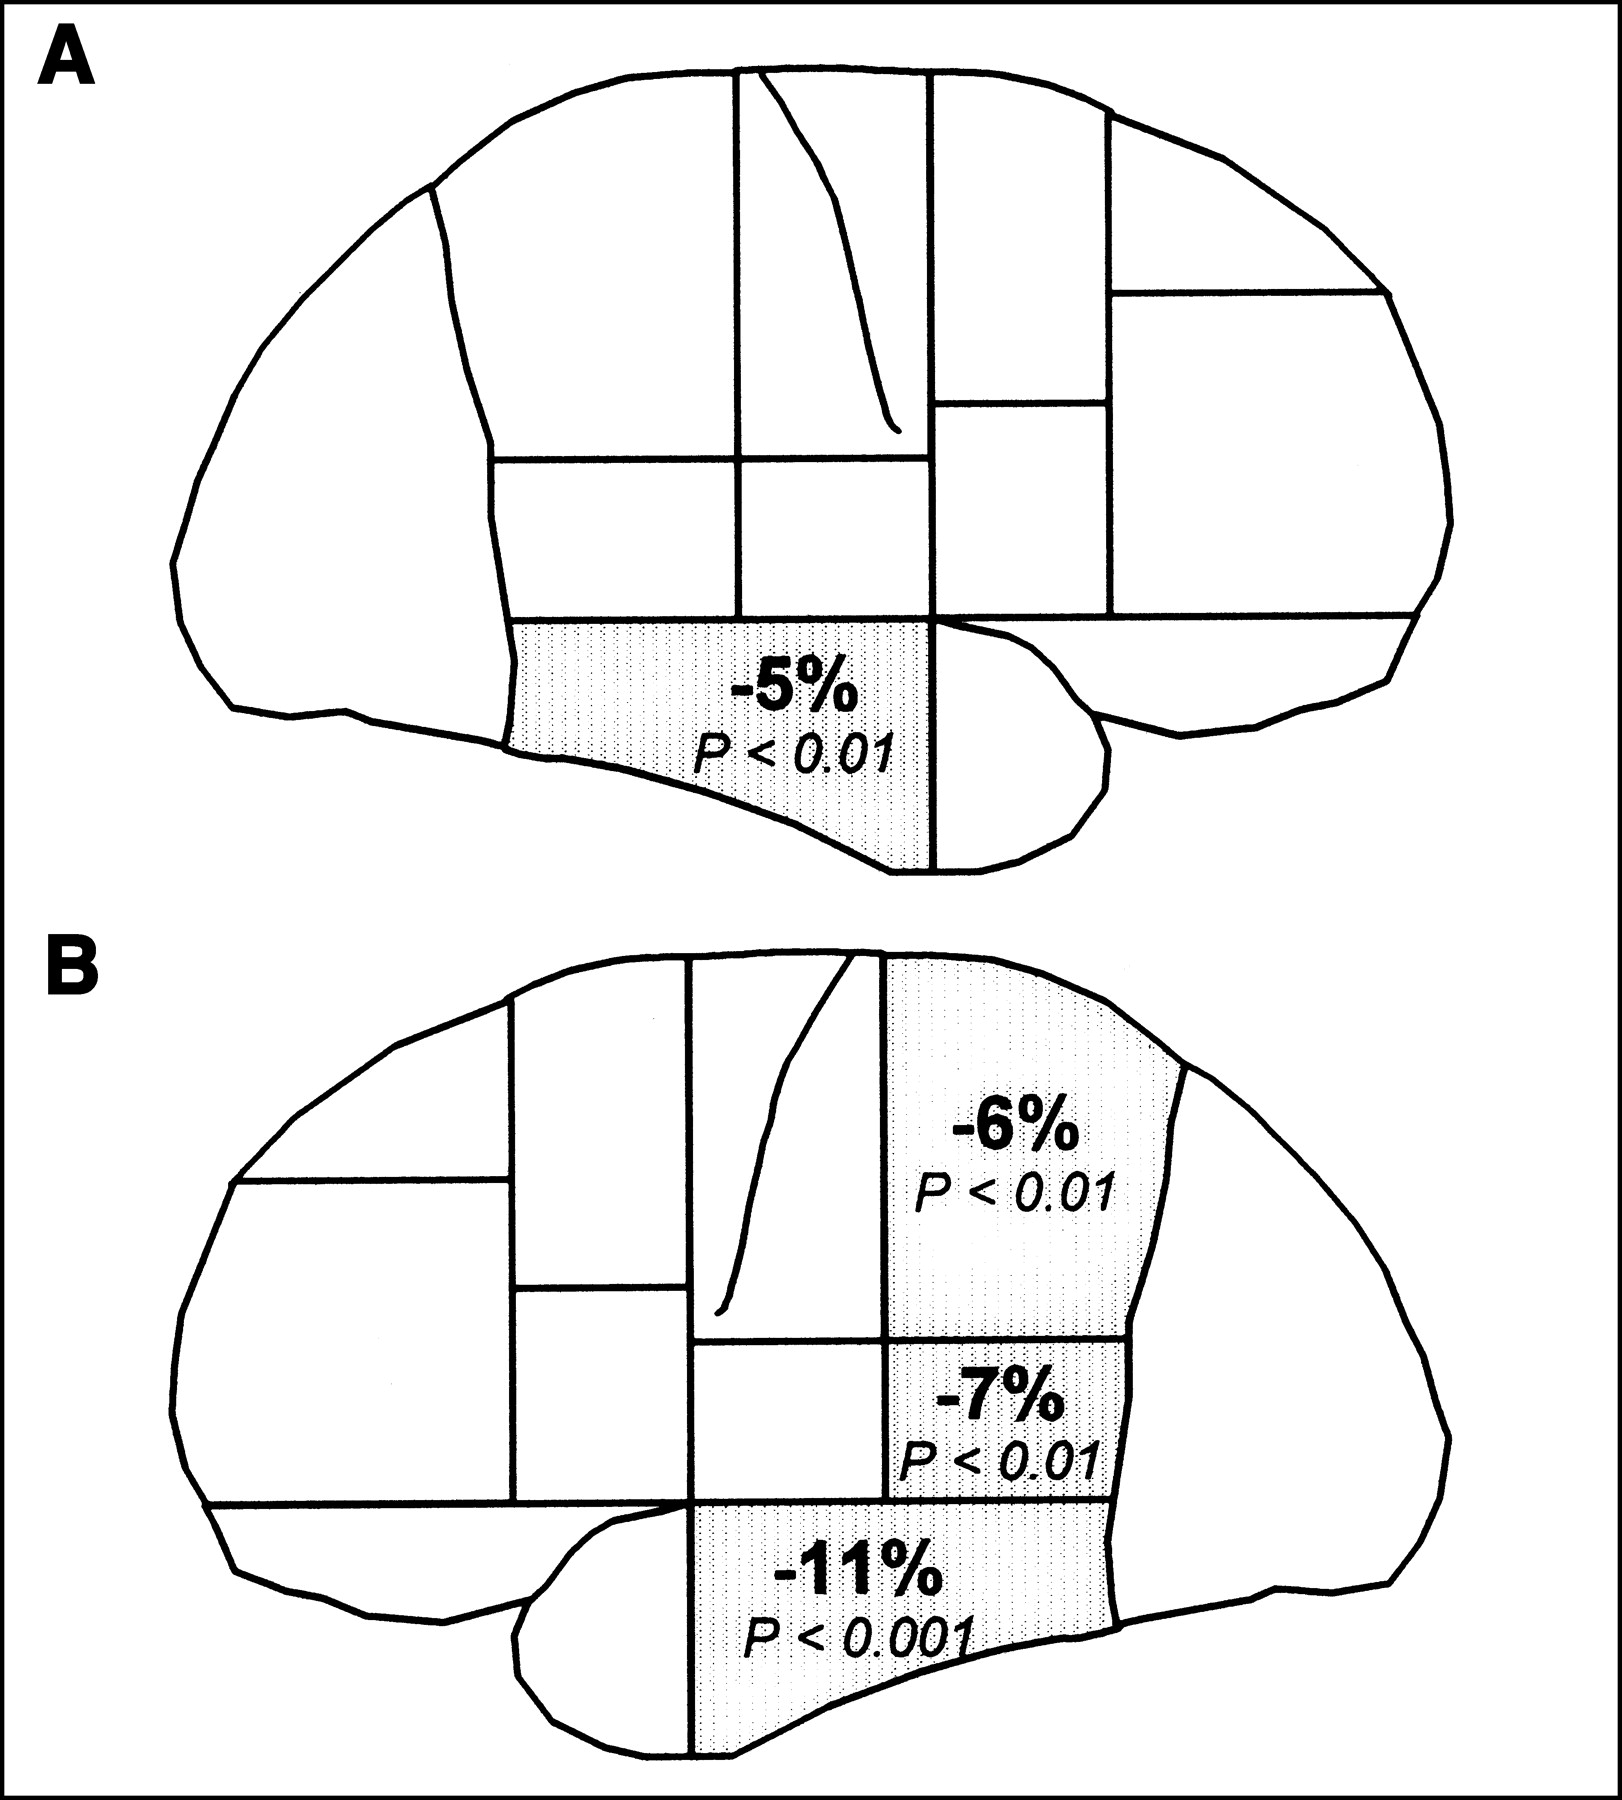
In comparison with control subjects, the PI was significantly decreased in the left lateral temporal region, Wernicke region, and parietal lobe and in the right lateral temporal region (Table 2). These regions and their percentage of decrease in comparison with control subjects are summarized in Figure 2.

Percentage of PI decrease in 29 patients vs. 12 control subjects. (A) Right hemisphere. (B) Left hemisphere.
Comparison of PI in Patients and Control Subjects
Correlation Between SPECT and Neurologic Tests
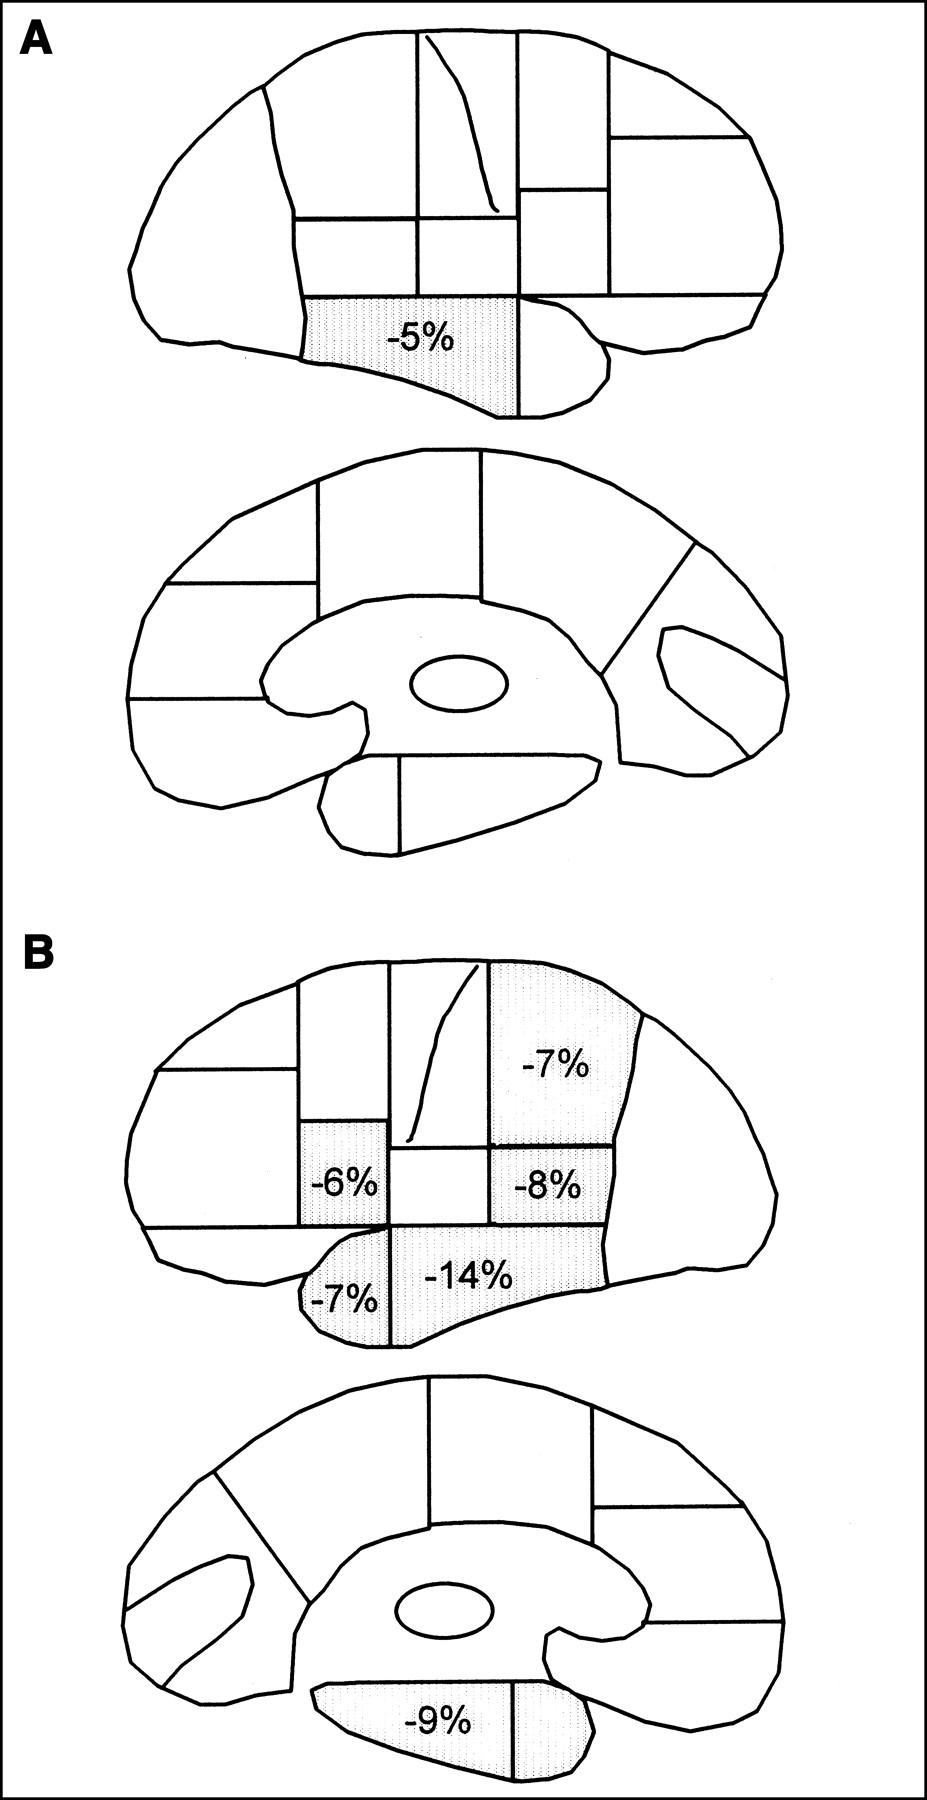
We first compared the PI in patients with (LS+) and without (LS−) lexicosemantic disorders. Results are presented in Table 3. In comparison with control subjects, the PI were significantly decreased in LS+ patients in the right and left lateral temporal region, left temporopolar, left medial temporal region, left Wernicke region, left Broca region, and left parietal lobe (Fig. 3). In comparison with control subjects, the PI was significantly decreased in LS− patients in the left and right lateral temporal cortex. A decrease in the PI was observed in the left lateral and medial temporal region and in the left Broca in patients with LS+ compared with those with LS−.

Comparison of PI in patients with lexicosemantic disorders and control subjects. (A) Right hemisphere, lateral and medial side. (B) Left hemisphere, lateral and medial side.
Comparison of PI in Patients With (LS+) or Without (LS−) Lexicosemantic Disorders vs. Control Subjects
Second, we compared the PI in patients with (A+) and without (A−) arthric disorders. Results are presented in Table 4. In comparison with control subjects, the PI were not significantly different in A+ patients, whatever the ROI studied. In A− patients, the PI significantly decreased in the left and right lateral temporal region, left Wernicke, and left parietal lobe. The PI significantly decreased in the left lateral temporal region in A− patients compared with A+ patients.
Comparison of PI in Patients With (A+) or Without (A−) Arthritic Disorders vs. Control Subjects
Comparison Between SPECT and MRI
Among the 16 right and 16 left cortical ROIs studied, only the left and right lateral temporal region, left temporopolar region, left Wernicke region, and left parietal lobe presented a significant difference between the groups Atrop+, Atrop−, and control subjects (Table 5). In those 5 regions, age onset and evolution duration were not significantly different between Atrop+ and Atrop− groups.
Comparison of PI in Patients With (Atrop+) or Without (Atrop−) Atrophy vs. Control Subjects
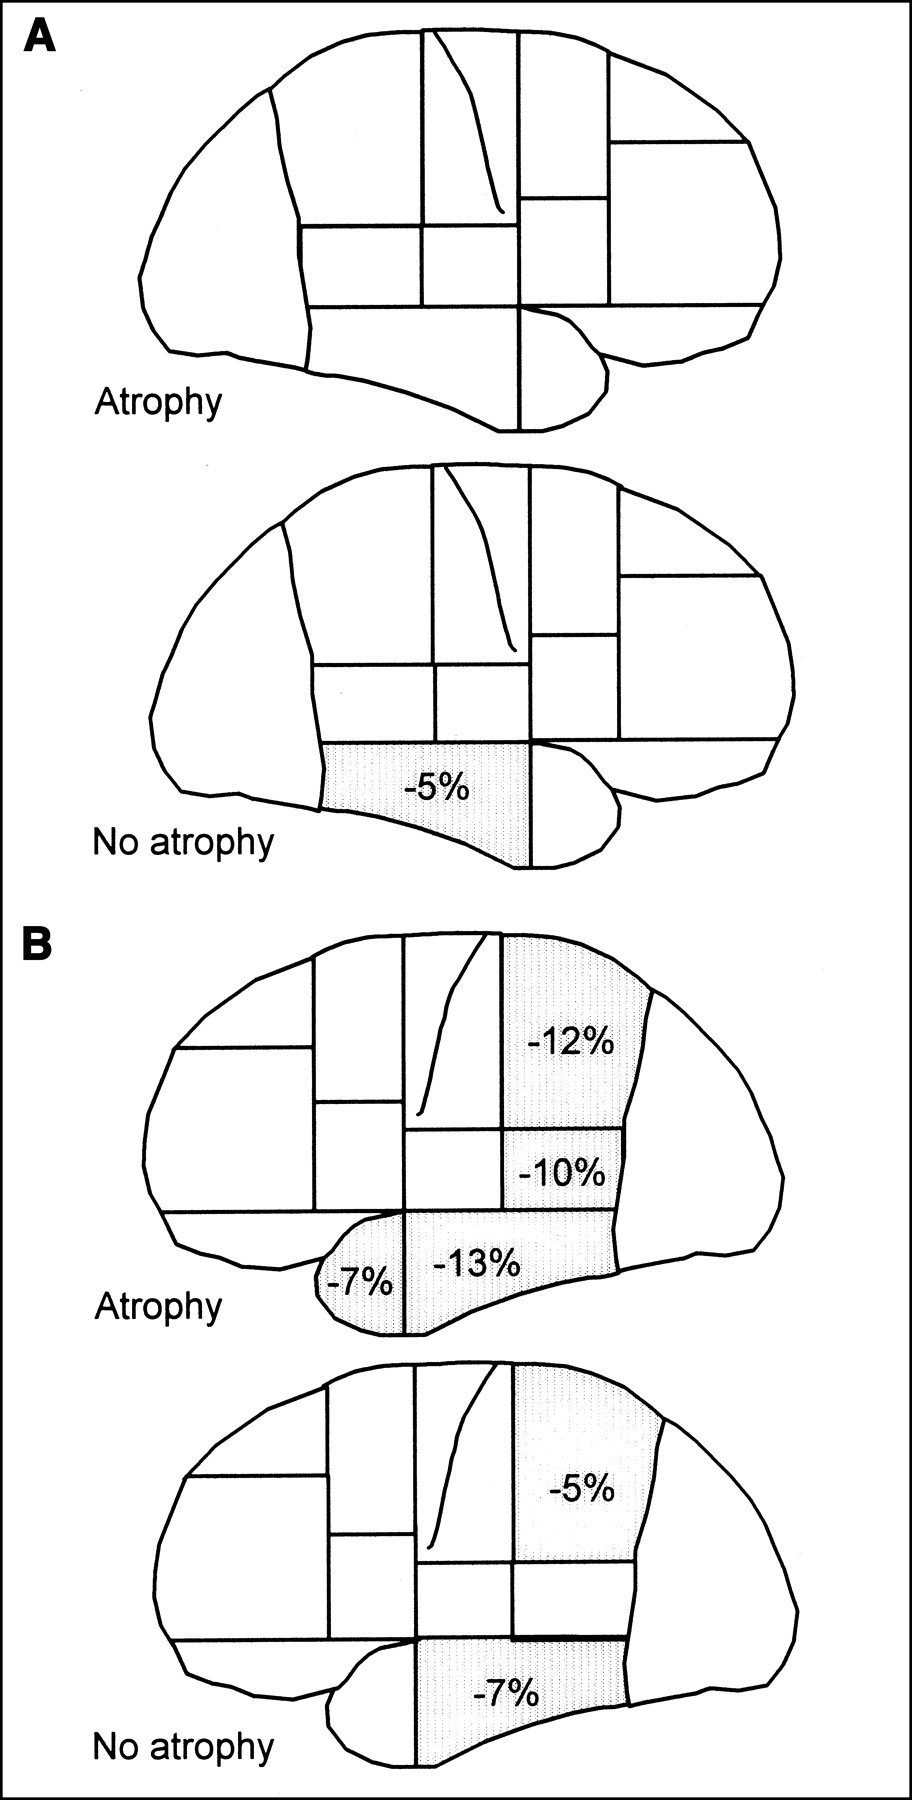
In comparison with control subjects, the PI was significantly decreased in the atrophic patients, in the left temporopolar region, lateral temporal region, Wernicke region, and parietal lobe. The PI was significantly decreased in the group of patients without atrophy, in the left and right lateral temporal cortex and the left parietal lobe. The PI was significantly decreased in the atrophic patients compared with patients without atrophy, in the left temporopolar region, left lateral temporal region, and left parietal lobe. Results are summarized in Figure 4.

Comparison of PI in patients with or without atrophy and control subjects. (A) Right hemisphere, atrophic and nonatrophic groups. (B) Left hemisphere, atrophic and nonatrophic groups.
DISCUSSION
We report, to our knowledge, the largest published series of patients with PPA studied by SPECT. The principal objective of this study was to compare regional perfusion in this group of patients in comparison with control subjects. The 2 other objectives were to correlate perfusion with clinical disorders and to test the influence of atrophy on the perfusion measurement. This study demonstrates that in patients with PPA, perfusion is clearly altered in the left temporoparietal cortex and also in the right temporal cortex, perfusion is largely altered in patients with lexicosemantic disorders, and perfusion abnormalities appear in patients with no significant atrophy on MRI.
Twenty-nine patients with PPA were compared with 12 control subjects. Only patients with Mesulam and Weintraub criteria were included in the study (2). Dementia was excluded with a specific neuropsychologic test (Table 1), and structural abnormalities, such as tumor, were excluded with an MRI or CT scan. The control group was selected from the Eugeria study of cognitive aging (27).
Two commercially available tracers of perfusion were used: HMPAO (22 patients and 12 control subjects) and ECD (7 patients). These 2 tracers are chemical microspheres, and their intracerebral uptake is correlated with regional CBF measured by a reference method—that is, a PET scan or the microsphere method. However, their intracellular mechanism of uptake is different. Patterson et al. (33) have shown a relative decrease in the PI on the posterior cortex with HMPAO compared with ECD. For this reason, patients were initially compared with regard to the tracer used. No significant difference was observed between the 2 tracers for all 38 ROIs—in particular, in the posterior region, basal ganglia, or cerebellum. For this reason, all patients were pooled in the study.
Cerebral systematization was determined regarding cerebral regions implicated in language. CBF was evaluated by a PI. The normalization by the cerebellum activity was used because no significant CBF abnormalities have been reported in the cerebellum in patients with PPA. Moreover, the PI was similarly calculated in the 12 control subjects, allowing the comparison of patients and control subjects without utilization of an asymmetry index.
Atrophy was evaluated by 3 observers blindly to SPECT, a method that has been shown to be reproducible (6,34,35). Among the 29 patients, atrophy was quantified from 0 to 4. Regarding the small number of patients in the groups, regions with scores of 0 and 1 were grouped (Atrop−) and regions with scores of 2–4 were also grouped (Atrop+). Because MRI was performed in different centers, digital MRI was not available and SPECT–MRI registration was not performed in the study.
The comparison of PI between patients and control subjects showed that PIs were significantly decreased in the left (−11%) and right (−5%) lateral temporal region, left Wernicke region (−7%), and parietal lobe (−6%) (Fig. 2). This result indicates that the left temporal and parietal cortex are affected in PPA, which is an agreement with previous studies (6,9,34,36) or case reports (8,10,25). By contrast, only a small number of published cases showing a right lateral temporal lesion are available. This may be explained by the methodologic analysis. First, with a visual analysis it is difficult to show a small decrease in perfusion (5% in our study). Second, the majority of studies used the right and left asymmetry ratio, which makes the analysis of perfusion or metabolism in the right hemisphere difficult. Thus, our analysis using both the cortex-to-cerebellum ratio and the comparison with control patients clearly demonstrates the bilateral temporal involvement in PPA.
Fluent-versus-nonfluent aphasia classification was not used. This classification depends on the mean length of sentences. Thompson et al. (37) have shown that patients with nonfluent aphasia may produce sentences of normal length. Therefore, we grouped our patients on the basis of arthric and lexicosemantic performance criteria.
The comparison between patients with and without lexicosemantic disorders showed that patients with lexicosemantic disorders (LS+) have a significant decrease in the PI in the left temporal region (lateral temporal, medial temporal, temporopolar, Wernicke), left parietal lobe, left Broca region, and the right lateral temporal region (Fig. 3). These results demonstrate that lexicosemantic disorders correspond to a large process, involving the bitemporal cortex, left parietal lobe, and posteroinferior frontal cortex.
Patients without lexicosemantic disorders (LS−) have a significant decrease in the PI in the right and left lateral temporal region. This group (LS−) included patients without arthric disorders, who may develop fluent aphasia. This finding suggests that LS− and A− patients who did not have lexicosemantic disorders already had a decrease in CBF in the bitemporal cortex.
Patients with lexicosemantic disorders (LS+) have a significant decrease in the PI in the left medial and lateral temporal cortex in comparison with patients without lexicosemantic disorders (LS−). These results show the implication of the left temporal cortex in patients with lexicosemantic disorders in the PPA.
The comparison of patients with (A+) or without (A−) arthric disorders showed that no significant difference between arthric patients (A+) and control subjects was observed. There was no tendency toward a decrease in the PI in the left external frontal cortex (P = 0.24) or in the left Broca region (P = 0.20). This result is in contrast with previous studies (16,19) and is probably explained by the large SDs of the PI in this small group of patients (n = 10). This finding may be explained by the fact that our patients probably had less severe disease than in other studies.
Patients without arthric disorders (A−) have a significant decrease in the PI in the left lateral temporal cortex in comparison with A+ patients and control subjects. Therefore, patients without arthric disorders (A−) are in the majority of patients with lexicosemantic disorders (Table 1), who are generally described as having large left temporal abnormalities (38).
In degenerative dementia, and particularly in lobar atrophy, the decrease in CBF is secondary to the decrease in metabolism, which is secondary to a neuronal loss or deafferentation. The PI measured in our study is a composite index showing all of these phenomena. For this reason, we investigated the relative importance of atrophy in the decrease in the PI.
In this study, the PI was compared between atrophic (Atrop+), nonatrophic (Atrop−), and control subjects (C). The PI was significantly different in the 3 groups in 5 regions: right lateral temporal, left temporopolar, lateral temporal, Wernicke, and parietal lobe (Table 5).
The determination of atrophy in the right lateral temporal region allowed classification of only 3 patients with atrophy. Therefore, because of the small number of patients in this group, a conclusion regarding comparison of patients with and without atrophy and between patients with atrophy and control subjects were not possible. However, comparison between patients without atrophy and control subjects showed a 5% decrease in the PI in patients without atrophy. These results demonstrate that without right cortical atrophy on MRI, SPECT may show a decrease in the PI in patients in comparison with control subjects. These results confirm the ability of SPECT in PPA to show functional abnormalities in the absence of morphologic abnormality.
In the left temporopolar region, comparison between nonatrophic patients and control subjects did not show a significant difference, suggesting that, without structural abnormalities, the PI is normal in this region. However, the PI in the left temporopolar region significantly decreased in atrophic patients in comparison with nonatrophic patients (6%) and control subjects (7%).
In the left lateral temporal region, the PI significantly decreased in atrophic patients in comparison with nonatrophic patients (8%) and in comparison with control subjects (13%). Moreover, there is a hypoperfusion in nonatrophic patients (7%) in comparison with control subjects. Results obtained in the left parietal lobe show a significantly decrease in the PI in atrophic patients in comparison with nonatrophic patients (7%) and in comparison with control subjects (12%). Moreover, there is a hypoperfusion in nonatrophic patients (5%) in comparison with control subjects (5%). Therefore, in the left lateral temporal region and in the parietal lobe, atrophy corresponded to a decrease in the PI. Moreover, the decrease in the PI preceded structural abnormalities.
In the left Wernicke cortex, comparison between nonatrophic and atrophic patients and between nonatrophic patients and control subjects did not show a significant difference of the PI. The decrease in the PI is about 5% for the 2 comparisons. Absence of a significant result is probably explained by the SD in the Atrop+ group (±0.08) and in the Atrop− group (±0.07). However, the PI significantly decreased in the Atrop+ group in comparison with control subjects, which shows that, in this region, the PI decrease seems to be related to atrophy.
CONCLUSION
Our study, using both SPECT and neuropsychologic data collected from 29 patients, clearly demonstrates that the bilateral temporal lateral lobes are involved in PPA. The statistical analysis also suggests that the severity of lexicosemantic disorders is strongly related to an extension of the abnormalities in the left medial temporal cortex. Finally, we observed that the decrease in perfusion measured by SPECT precedes the atrophy measured with MRI in the right lateral temporal cortex, left lateral temporal cortex, and left parietal lobe.
Acknowledgments
The authors thank Richard Medeiros, Rouen University Hospital Medical Editor, for his valuable advice in editing the manuscript.
Footnotes
Received Sep. 16, 2002; revision accepted Sep. 19, 2003.
For correspondence or reprints contact: Pierre Vera, MD, PhD, Nuclear Medicine Department, Henri Becquerel Center, 1 rue d’Amiens, 76000 Rouen, France.
E-mail: pierre.vera{at}rouen.fnclcc.fr


