

FIGURE 2.

FIGURE 2.
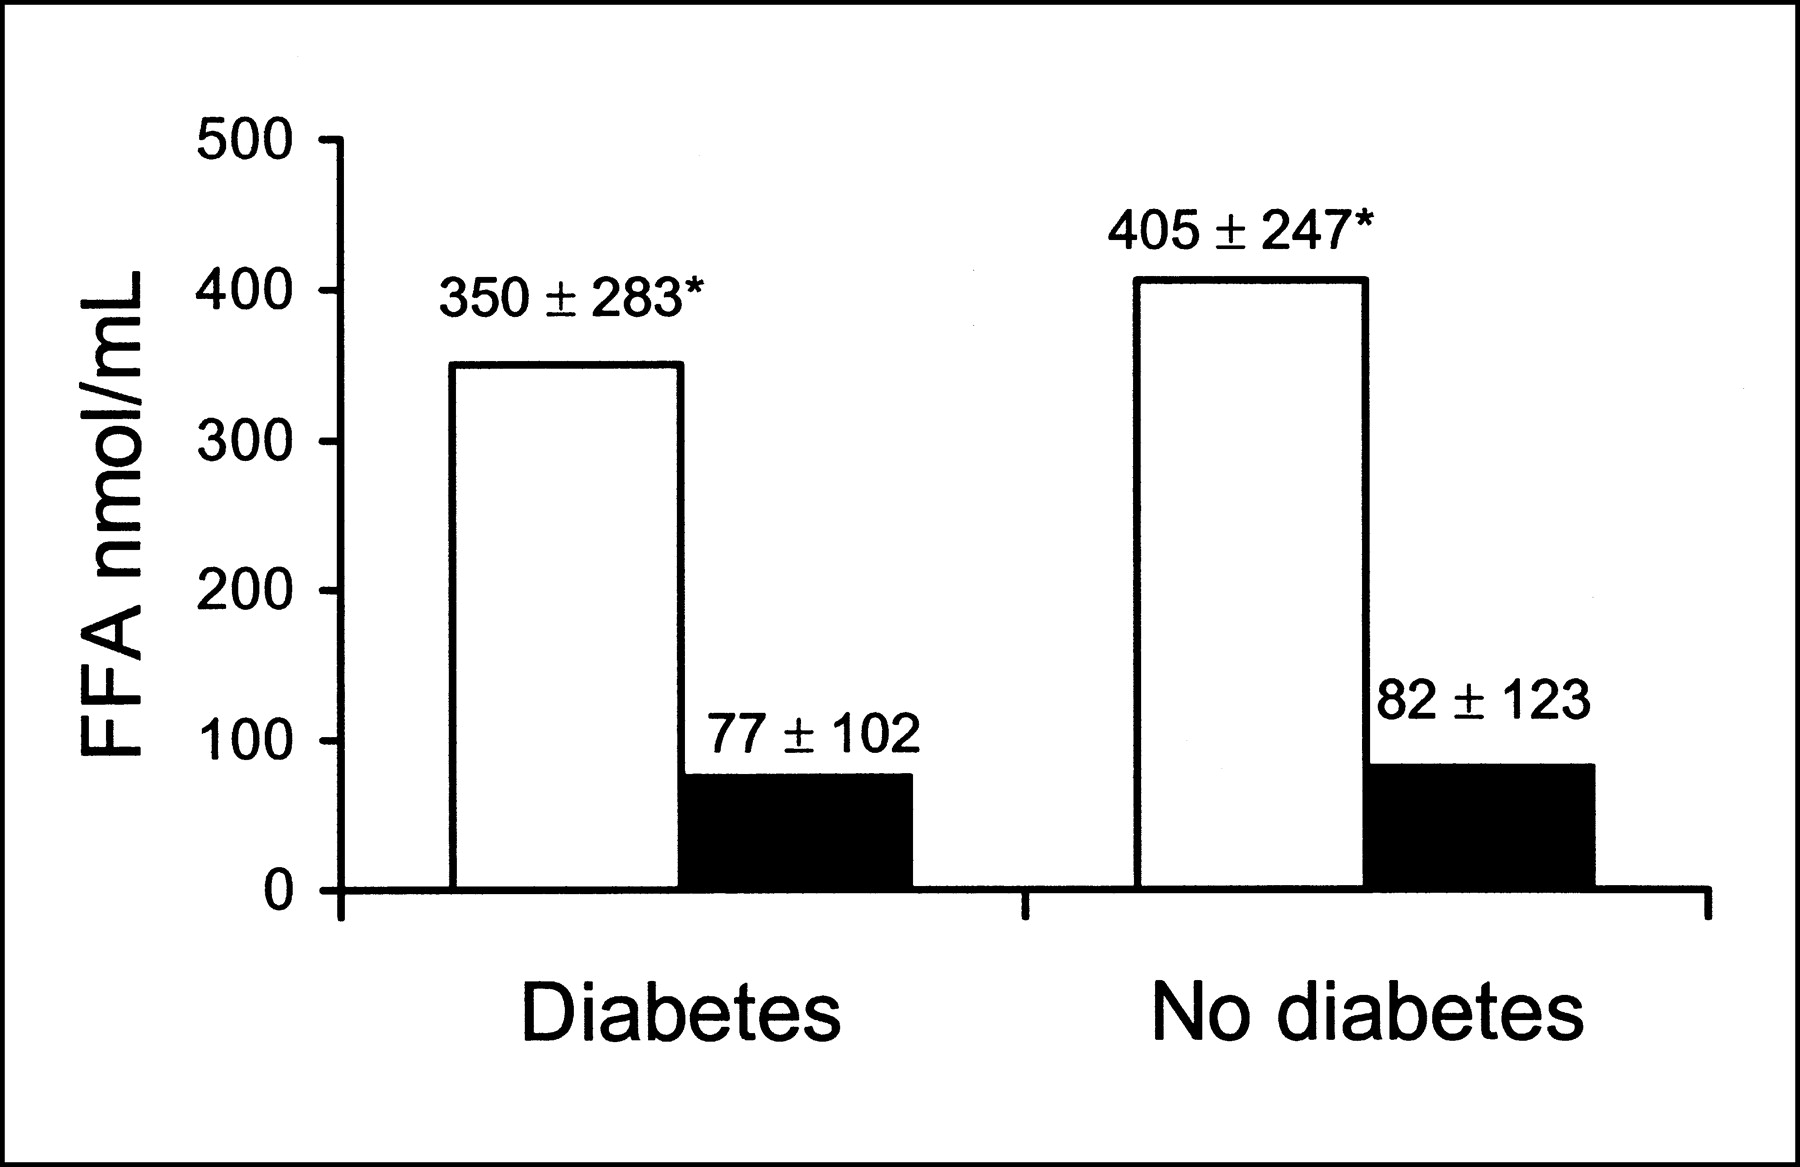
Plasma concentration of free fatty acids (FFA) in patients with diabetes mellitus and those without diabetes, at baseline (white bars) and after oral administration of acipimox (black bars). *P < 0.0001 vs. after acipimox.
In this issue


Related Articles
Cited By...
- Extent of Viability to Predict Response to Cardiac Resynchronization Therapy in Ischemic Heart Failure Patients
- Nitrate Administration Increases Blood Flow in Dysfunctional but Viable Myocardium, Leading to Improved Assessment of Myocardial Viability: A PET Study
- Effect of Intramyocardial Injection of Autologous Bone Marrow-Derived Mononuclear Cells on Perfusion, Function, and Viability in Patients with Drug-Refractory Chronic Ischemia
- Impact of Diabetes Mellitus on Prediction of Clinical Outcome After Coronary Revascularization by 18F-FDG SPECT in Patients with Ischemic Left Ventricular Dysfunction
- Diabetic cardiomyopathy: mechanisms, diagnosis and treatment
- Reduced Oxidative Metabolic Response in Dysfunctional Myocardium with Preserved Glucose Metabolism but with Impaired Contractile Reserve