


Abstract
The objective of this study was to validate a method for estimating regional liver asialoglycoprotein (ASGP) receptor amount from single blood samples using static SPECT with 99mTc-diethylenetriaminepentaacetic acid galactosyl human serum albumin (99mTc-GSA). Methods: Based on a 2-compartment nonlinear model, regional ASGP receptor amount could be calculated from total liver ASGP receptor amount (Ro) and regional GSA uptake at a specific time. Because Ro could be estimated from single blood samples using an empiric formula, regional GSA uptake obtained as a SPECT voxel count could be converted to regional ASGP receptor amount by solving a nonlinear model equation. To validate this method, data from 62 patients with chronic liver disease underwent dynamic SPECT (30 rotations per 30 min) and simultaneous multiblood sampling and were analyzed by this method. Ro was calculated as the sum of voxel values of parametric receptor images generated from plasma concentration of GSA at 20 min and of static SPECT images generated by merging dynamic SPECT data (12–20 min). Ro was also estimated by fitting time-activity curves (4–30 min) of plasma and whole liver to the nonlinear model using the nonlinear regression method. Ro obtained from the receptor image was compared with that from curve fitting in relation to the results of hepatic function tests (indocyanine green test, hepaplastin test, and branched-chain amino acids/tyrosine plasma concentration ratio) and Child’s classification. Results: Ros from the 2 methods showed a significant linear correlation (r2 = 0.938; P < 0.0001; slope = 0.90; y-intercept = 1.5). Both Ros had significant correlations with the results of hepatic function tests (P < 0.001) and differed significantly among the 3 groups of Child’s classification (P < 0.0001). Conclusion: The present method could provide a quantitative ASGP receptor image without dynamic data acquisition. This approach could be useful for quantitative evaluation of regional liver function and estimation of residual liver function in hepatectomy.
The asialoglycoprotein (ASGP) receptor is known to reside on the surface of hepatocytes. Although its physiologic role has not been elucidated, past studies on serum ASGP and the hepatic ASGP receptor suggested that this receptor might be responsible for the metabolism of serum glycoprotein (1). The receptor density in the liver was closely related to serum ASGP level and hepatocellular function (2). On the basis of these findings, a method for evaluating hepatic function from the serum ASGP level has been investigated (3). In nuclear medicine, the development of 99mTc-labeled neoglycoalbumin (99mTc-NGA) for in vivo use enabled the direct imaging of the liver ASGP receptor. In conjunction with visual evaluation of the receptor image and using time-activity curves of liver and cardiac blood pool, kinetic model analyses have been performed to estimate the hepatic receptor density. Vera et al. (4,5) developed a nonlinear 3-compartment model for in vivo estimation of the receptor amount, and this method was validated by direct comparison with results of in vitro receptor assay using biopsied liver specimens. In addition to these studies, other model analyses have been reported to be useful for quantitative evaluation of liver function (6).
These nonlinear model analyses, however, could not be applied to regional analysis, which could provide a quantitative index of regional liver function. Regional liver uptake and linear kinetic parameters, such as initial hepatic clearance by Patlak plot, were reported to be useful methods for analyzing regional ASGP receptor amount (7,8). Liver uptake, however, could not have a linear relationship to the receptor amount. On the other hand, initial hepatic clearance had a linear relationship to the receptor amount (9), but calculation of regional clearance by Patlak plot requires dynamic SPECT data acquisition with fast rotation, which, in turn, requires a rotating multidetector gamma camera system that may not be available in every institution. In this context, we have developed a method for generating a functional map of regional liver ASGP receptor amount from a single blood sample and a single static SPECT scan, based on a simplified 2-compartment nonlinear model that incorporates nonlinear binding of ASGP receptor and a 99mTc-labeled ligand. In the first step of this method, total liver ASGP receptor amount (Ro) was estimated from plasma distribution volume of the ligand at a specific time, based on an empiric formula. In the second step, regional ASGP receptor amount was calculated using estimated Ro by solving a nonlinear equation that described the receptor-ligand binding on a voxel-by-voxel basis. This method was validated and its clinical significance as a liver function test was investigated on dynamic SPECT data from 62 patient studies, comparing this method with fit to a standard model from conventional liver function tests.
MATERIALS AND METHODS
Radiopharmaceutical
The radiolabeled NGA used in this study was 99mTc-diethylenetriaminepentaacetic acid galactosyl human serum albumin (99mTc-GSA; Nihon Mediphysics, Nishinomiya, Japan), a synthetic NGA (molecular weight = 76,000) with about 33 galactose residues and DTPA conjugated for chelating 99mTc (10,11). 99mTc-GSA was provided in a labeled form with >98% specific activity.
Patients
A total of 62 patients (26 female, 36 male), aged 18–77 y (mean ± SD: 59 ± 17) were included in the study: 21 with chronic hepatitis (3 of whom had hepatocellular carcinoma), 34 with liver cirrhosis (24 of whom had hepatocellular carcinoma), 2 with cholangiocellular carcinoma, and 5 with metastatic liver tumors (metastasized from breast in 1, gallbladder in 2, and colon in 2 patients). Patients were classified into 3 groups according to Child’s criteria of the degree of liver dysfunction: A, mild; B, moderate; and C, severe (12). Thirty-four patients were classified in group A, 14 in group B, and 14 in group C.
Study Protocol
All patients were studied with 99mTc-GSA dynamic SPECT. Dynamic SPECT studies were performed using a triple-head rotating gamma camera system equipped with low-energy general-purpose collimators and a dedicated data processing unit (GCA9300A and GMS550; Toshiba Medical, Tokyo, Japan). The in-plane spatial resolution of this system was 14 mm full width at half maximum. After fasting overnight, the patient was placed in a supine position so that the liver and lower part of the heart could be within the field of view of the detectors. 99mTc-GSA (185 MBq/3 mg) was injected intravenously as a bolus. After confirmation that the entire liver was covered by the detectors’ view, dynamic SPECT data acquisition was started 1 min after the injection and continued for 30 rotations in a 120° back-and-forth continuous rotation mode with an acquisition time of 1 min per rotation. In each rotation, 90 projection data (30 projections per detector) were recorded in a 64 × 64 matrix (pixel size = 6.4 × 6.4 mm). SPECT image reconstruction was performed with a filtered backprojection method using a ramp filter after preprocessing with a Butterworth filter (cutoff frequency = 0.41 cycle per centimeter; order of 8) to obtain 30 sets of 6.4-mm-thick transaxial SPECT images. Attenuation and scatter corrections were not performed. To generate a set of images equivalent to static SPECT, projection data of dynamic SPECT (12–20 min) were merged.
The border of the liver was determined by a threshold percentage (42%) to the maximum voxel count in the liver on the reconstructed transaxial images obtained from the 30th rotation in which the liver was delineated most clearly. The time-activity curve of whole liver was then generated on the basis of this volume of interest. The threshold of 42% was determined as appropriate to detect the border of liver correctly in a phantom study.
During SPECT data acquisition, peripheral venous blood sampling (3 mL each) was performed at 2, 4, 6, 8, 10, 15, 20, 30, and 40 min after the injection. After centrifugation of the sampled blood, 0.5 mL plasma was aliquoted into 2 plastic test tubes from each sample. Together with the diluted solution of the injected standard, radioactivity of the plasma was counted on a well-type scintillation γ-counter (ARC500; Aloka, Tokyo, Japan) to calculate plasma concentration of 99mTc-GSA as percentage of injected dose per milliliter plasma. The actual injected dose was determined by counting the radioactivity of the pre- and postinjection syringes on a digital dose calibrator (IGC3; Aloka). A calibration coefficient for converting radioactivity measured on the dose calibrator to that on the well-type scintillation counter was determined by counting a standard solution on both measuring instruments.
Estimation of Total ASGP Receptor Amount Based on a Nonlinear Model Fitting
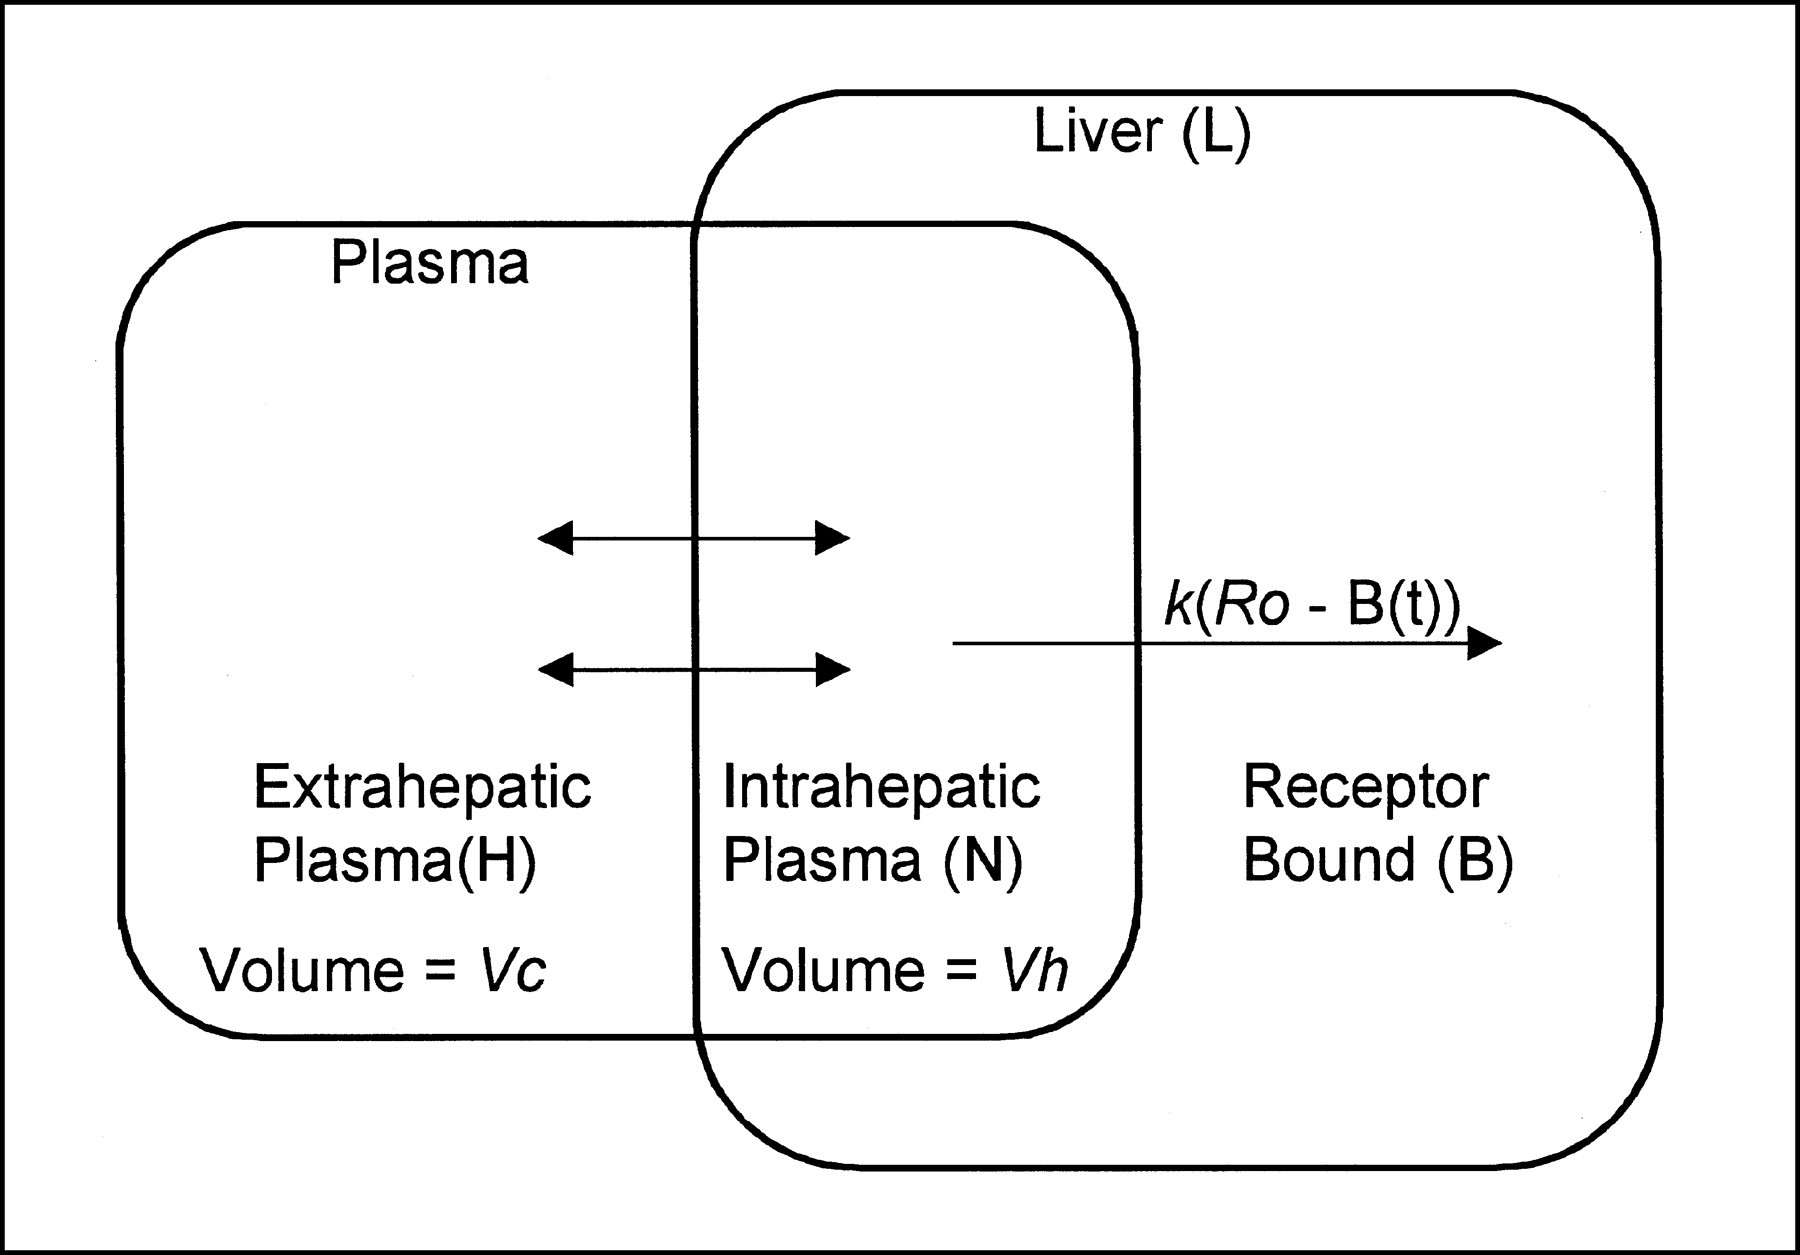
The model used here for describing 99mTc-GSA kinetics was a simple nonlinear model that consisted of extrahepatic plasma, intrahepatic plasma, and specific bound compartments. The model did not contain a plasma flow parameter to connect intra- and extrahepatic plasma compartments. We assumed quasiequilibrium between extra- and intrahepatic plasma compartments. Under this assumption, the amount of GSA in the intrahepatic plasma could be expressed simply by multiplying the plasma concentration of GSA by the distribution volume of the intrahepatic plasma compartment. As for the receptor-GSA binding, second-order association was assumed. Dissociation from the receptor binding or metabolism of GSA from the liver was not considered in this study (4). The schematic representation of the model is shown in Figure 1, and the implicit functions for describing the model system are expressed as:
 Eq. 1
Eq. 1
 Eq. 2
Eq. 2
 Eq. 3
Eq. 3
 Eq. 4
Eq. 4
 Eq. 5
Eq. 5
 Eq. 6 where B(t) = GSA amount in the specific bound compartment; N(t) = GSA amount in the intrahepatic plasma compartment, L(t) = GSA amount in the whole liver; H(t) = GSA amount in the extrahepatic plasma compartment at time t; k = the second-order association rate constant for the receptor-GSA binding; Ro = total ASGP receptor amount; Vc = extrahepatic plasma volume; Vh = intrahepatic plasma volume; C = the coefficient for converting the liver dose to the SPECT count; and Do = injected dose. The model parameters Ro, Vc, Vh, and C were set to be adjustable, and k was fixed to a theoretic value (2.475 mL/nmol/min) determined from the number of galactose residues attached to a GSA molecule (4). Liver time-activity curve (Li(t)) and plasma time-concentration curve (Cp(t)) were fitted to Equation 5 and Equation 6 from 4 to 30 min after injection, using the weighted nonlinear least squares regression method (damping Gauss-Newton method) to estimate the adjustable parameters. Initial estimates of the adjustable parameters were determined according to a graphic method (13). Liver time-activity data and plasma time-concentration data were weighted assuming a Poisson distribution. To solve the nonlinear differential equation (Eq. 1), after setting initial conditions of the compartments (H(0) = Do × Vc/(Vc + Vh); N(t) = Do × Vh/ (Vc + Vh); B(0) = 0), a numeric integration algorithm (Runge-Kutta-Fehlberg method) was applied. All calculation was performed on a workstation (Dell Precision 410 with Windows NT; Dell Computer Corp., Round Rock, TX) using a double-precision floating point number system.

Schematic representation of 2-compartment nonlinear model for describing GSA kinetics. L = amount of GSA in liver; B = amount of specific bound GSA; N = amount of GSA in intrahepatic plasma; H = amount of GSA in extrahepatic plasma; Ro = total liver receptor amount; k = second-order association rate constant; Vc = extrahepatic plasma volume; Vh = intrahepatic plasma volume.
Estimation of Total ASGP Receptor Amount from Single Blood Sample
Plasma concentration of GSA at each sampling time was converted to apparent distribution volume in a unit of liter by dividing injected dose (100%) by the plasma concentration (percentage injected dose per liter). Each distribution volume and Ro obtained by the nonlinear model analysis were then normalized by the patient’s body surface area (BSA), calculated by Haycock’s formula using patient weight (W) and height (H) (BSA = 0.024265 H0.3964 W0.5378) (14), and linearly scaled to the value of standard BSA (1.73 m2). This normalization was performed because both blood concentration and ASGP receptor amount could be related to patient body size. To determine an empiric formula that converts the single-point plasma distribution volume of GSA to Ro, Ro was plotted over plasma distribution volume for 6 sampling times of 8, 10, 15, 20, 30, and 40 min. The plots were fitted to various functions, including exponential, power series, and logarithmic function, to determine an appropriate empiric formula that could express the relationship between single-sample plasma distribution volume and Ro.
Functional Mapping of Regional ASGP Receptor Amount
Functional mapping of regional ASGP receptor amount was performed, on the basis of the kinetic model described previously, using the static SPECT image generated by merging dynamic SPECT projection images from 12 to 20 min. Some constraints on the model were imposed to make calculation simple. Total ASGP Ro was estimated from a single blood sample at 20 min on the basis of the optimized empiric formula (see results section). The constant k was fixed to the theoretic value. Total plasma distribution volume (Vc + Vh) was determined from the linear regression equation between patient BSA and the total plasma distribution volume determined by the model fitting (see results section), and a ratio of Vh to total plasma distribution volume was fixed to the mean of the model estimates. Because all model parameters (k, Ro, Vc, Vh) were determined, calculation of specific bound GSA amount in the liver (At) at middle SPECT scan times (tm) and Cp(t) could be performed following Equations 1–4. Using At, specific bound GSA amount in each voxel (Av) at tm was estimated assuming Av was proportionate to the voxel counts. Using the calculated Cp(t) as an input function, an implicit function describing regional GSA receptor binding and an equation held at tm were expressed as:
 Eq. 7
Eq. 7
 Eq. 8 where Br(t) = specific bound GSA amount at time t and Rr = ASGP receptor amount in a voxel. The value of Rr that satisfied Equations 7 and 8 was determined by Newton’s method on a voxel-by-voxel basis, and a parametric image of Rr was generated. An initial value of Rr was set to the mean voxel receptor amount calculated from Ro and the number of voxels in the liver. All calculations were performed using a double-precision floating-point number system on the workstation.
To validate the functional mapping from a single blood sample and SPECT, the Ro obtained as a sum of the voxel values of a parameter image was compared with that obtained from nonlinear model fitting. To investigate the clinical significance of the ASGP receptor amount as an index of liver function, Ro obtained by the functional mapping and nonlinear model fitting was compared with the results of conventional liver function tests. These tests included the hepaplastin test, branched-chain amino acids/tyrosine plasma concentration ratio, and blood retention of indocyanine green at 15 min.
Statistical Analysis
Correlation analysis was performed by calculating Pearson’s product-moment correlation coefficient (r) and corresponding P value. To test the between-group difference of the mean values, a t test with either equal or unequal variances was performed in a pairwise fashion. P < 0.05 was considered statistically significant in all tests.
RESULTS
Estimation of Total ASGP Receptor Amount Based on a Nonlinear Model Fitting
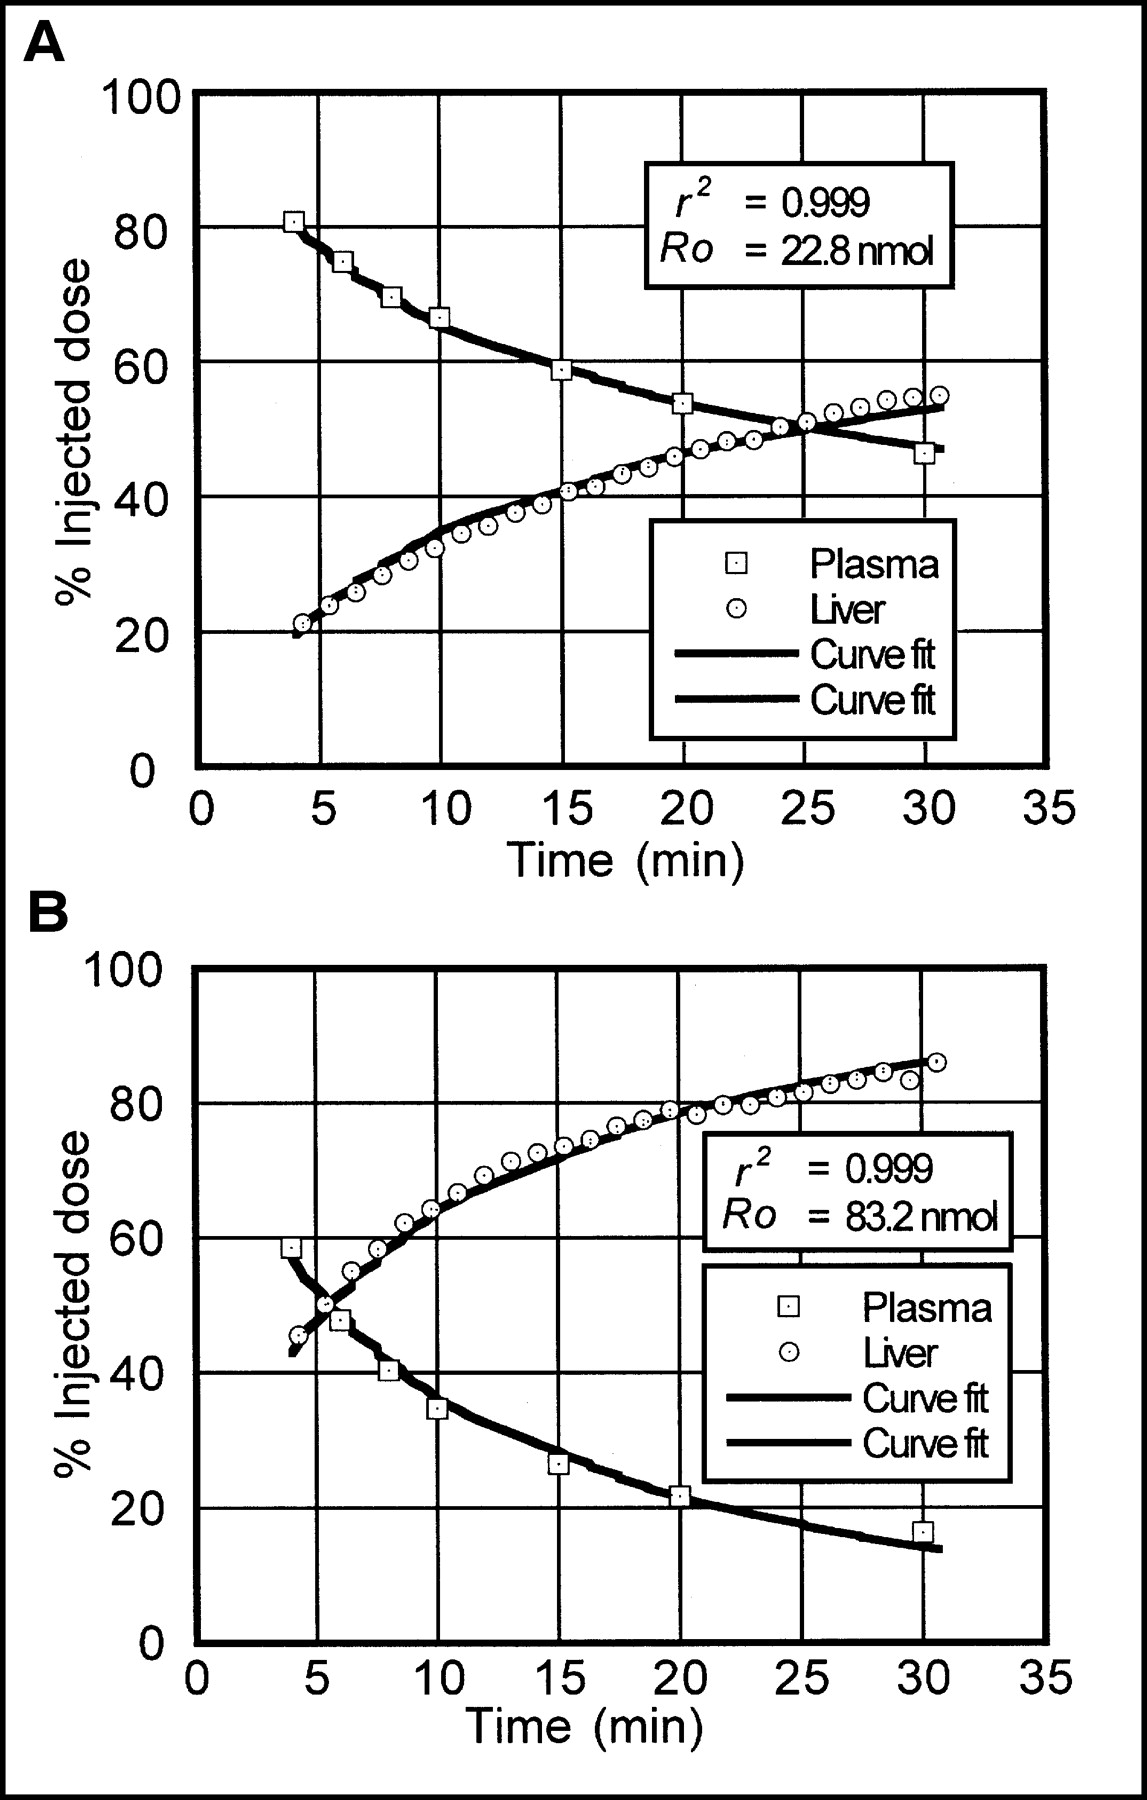
Liver time-activity and plasma time-concentration curves could be fitted well to the model in all cases. In all nonlinear least squares regressions, iterative calculation ended with normal convergence and all adjustable parameters could be determined with small error of the estimate (<20% in fractional error of the estimate). The correlation coefficient (r2) between observed and calculated data ranged from 0.9948 to 0.9999 (mean ± SD = 0.9993 ± 0.0007). Examples of nonlinear model fitting from 2 patients with severe and mild liver dysfunction are shown in Figure 2.

Examples of nonlinear model fitting from 2 patients with severe (A) and mild (B) liver dysfunction. 99mTc-GSA amount in liver and plasma are expressed as percentages of injected dose.
Estimation of Total ASGP Receptor Amount from Single Blood Sample
To determine the best formula to express the relationship between Vd of GSA and Ro scaled to standard BSA, several functions were tested by regression analysis. In these functions, a logarithmic function was found to be the best in goodness of fit and is expressed as:
 Eq. 9 In Equation 9, P1–3 are the constants. When this function was used for a regression formula, r2 between Vd and Ro were >0.940 at sampling times 15–40 min after the injection of GSA. If Vd at sampling times < 15 min was used for regression, the plots were scattered and could not be fitted well by any function. The result of regression analysis with the logarithmic formula (Eq. 9) at 20 min after injection is plotted in Figure 3 as an example, and the determined constants for 8–40 min after injection are summarized in Table 1.
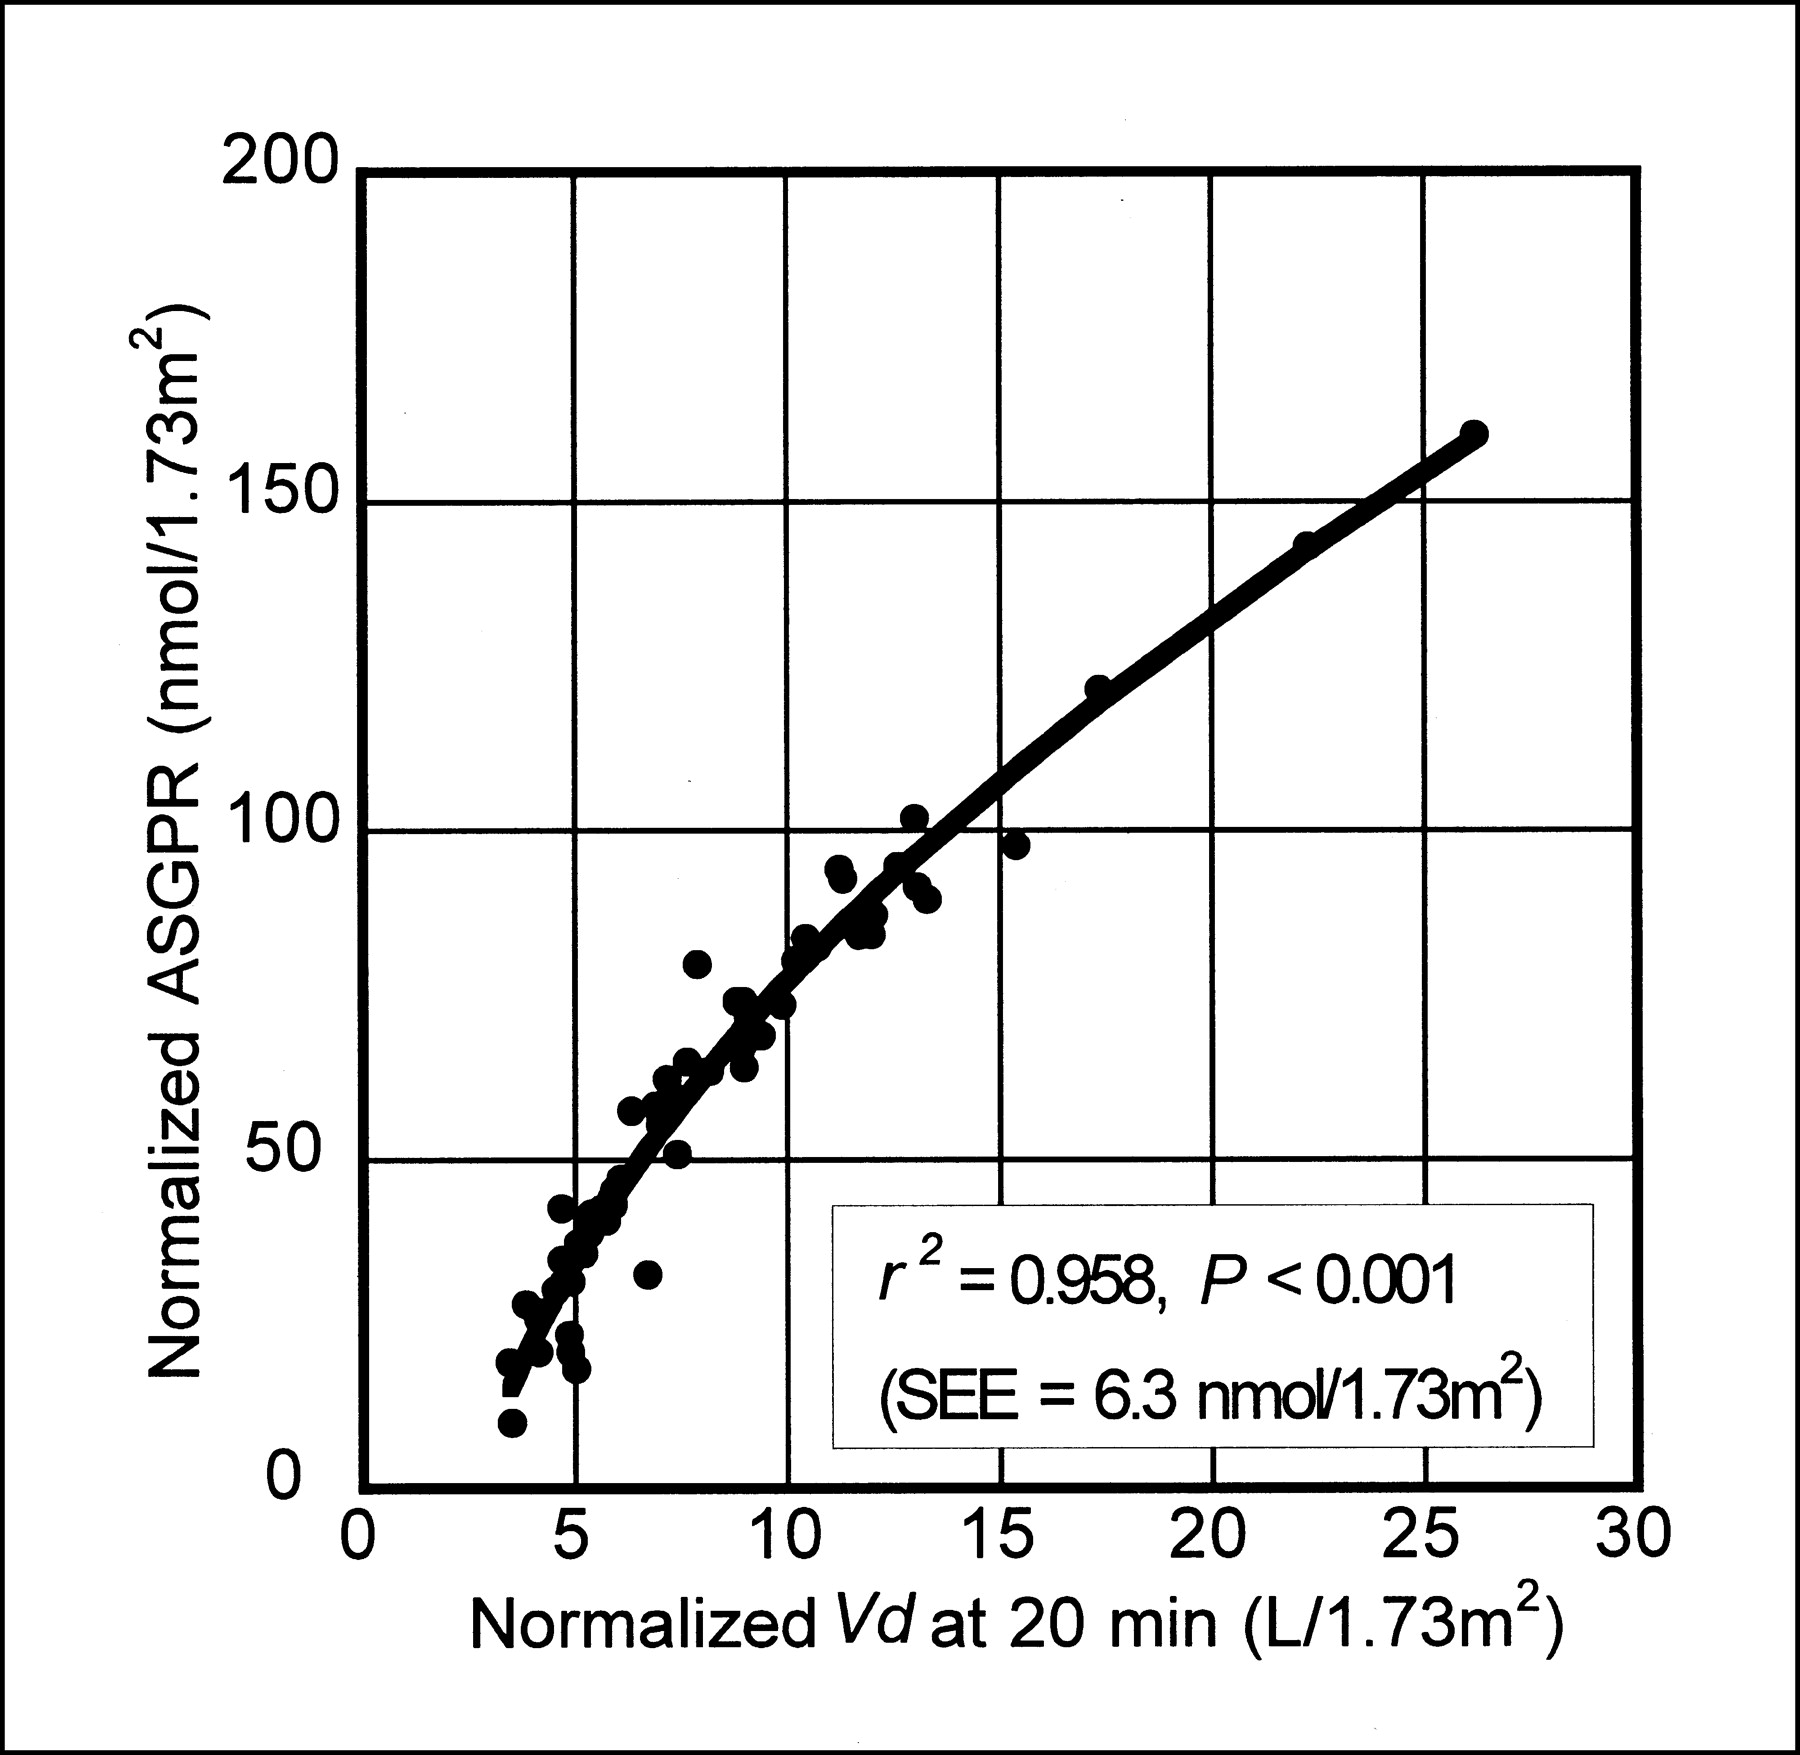
Relationship between plasma distribution volume (Vd) and total liver receptor amount (Ro) at 20 min after injection. Solid curve represents regression curve based on Equation 9. Both Vd and Ro were scaled to standard body surface area (1.73 m2). ASGPR = asialoglycoprotein receptor.
Constants Determined for Single-Sample Method at Varying Sampling Times
Functional Mapping of Regional ASGP Receptor Amount
To reduce the number of unknown parameters, several constraints on the model parameters were imposed. In these constraints, total plasma distribution volume (Vc + Vh) was fixed to the predicted value based on the linear regression equation (Eq. 10) obtained from the correlation between estimated total plasma distribution volume (Vc + Vh, expressed in milliliters) by the nonlinear model analysis and patient BSA (BSA, expressed in square meters).
 Eq. 10 There was a weak but significant correlation between nonlinear model analysis and patient BSA (r = 0.514; P < 0.001).
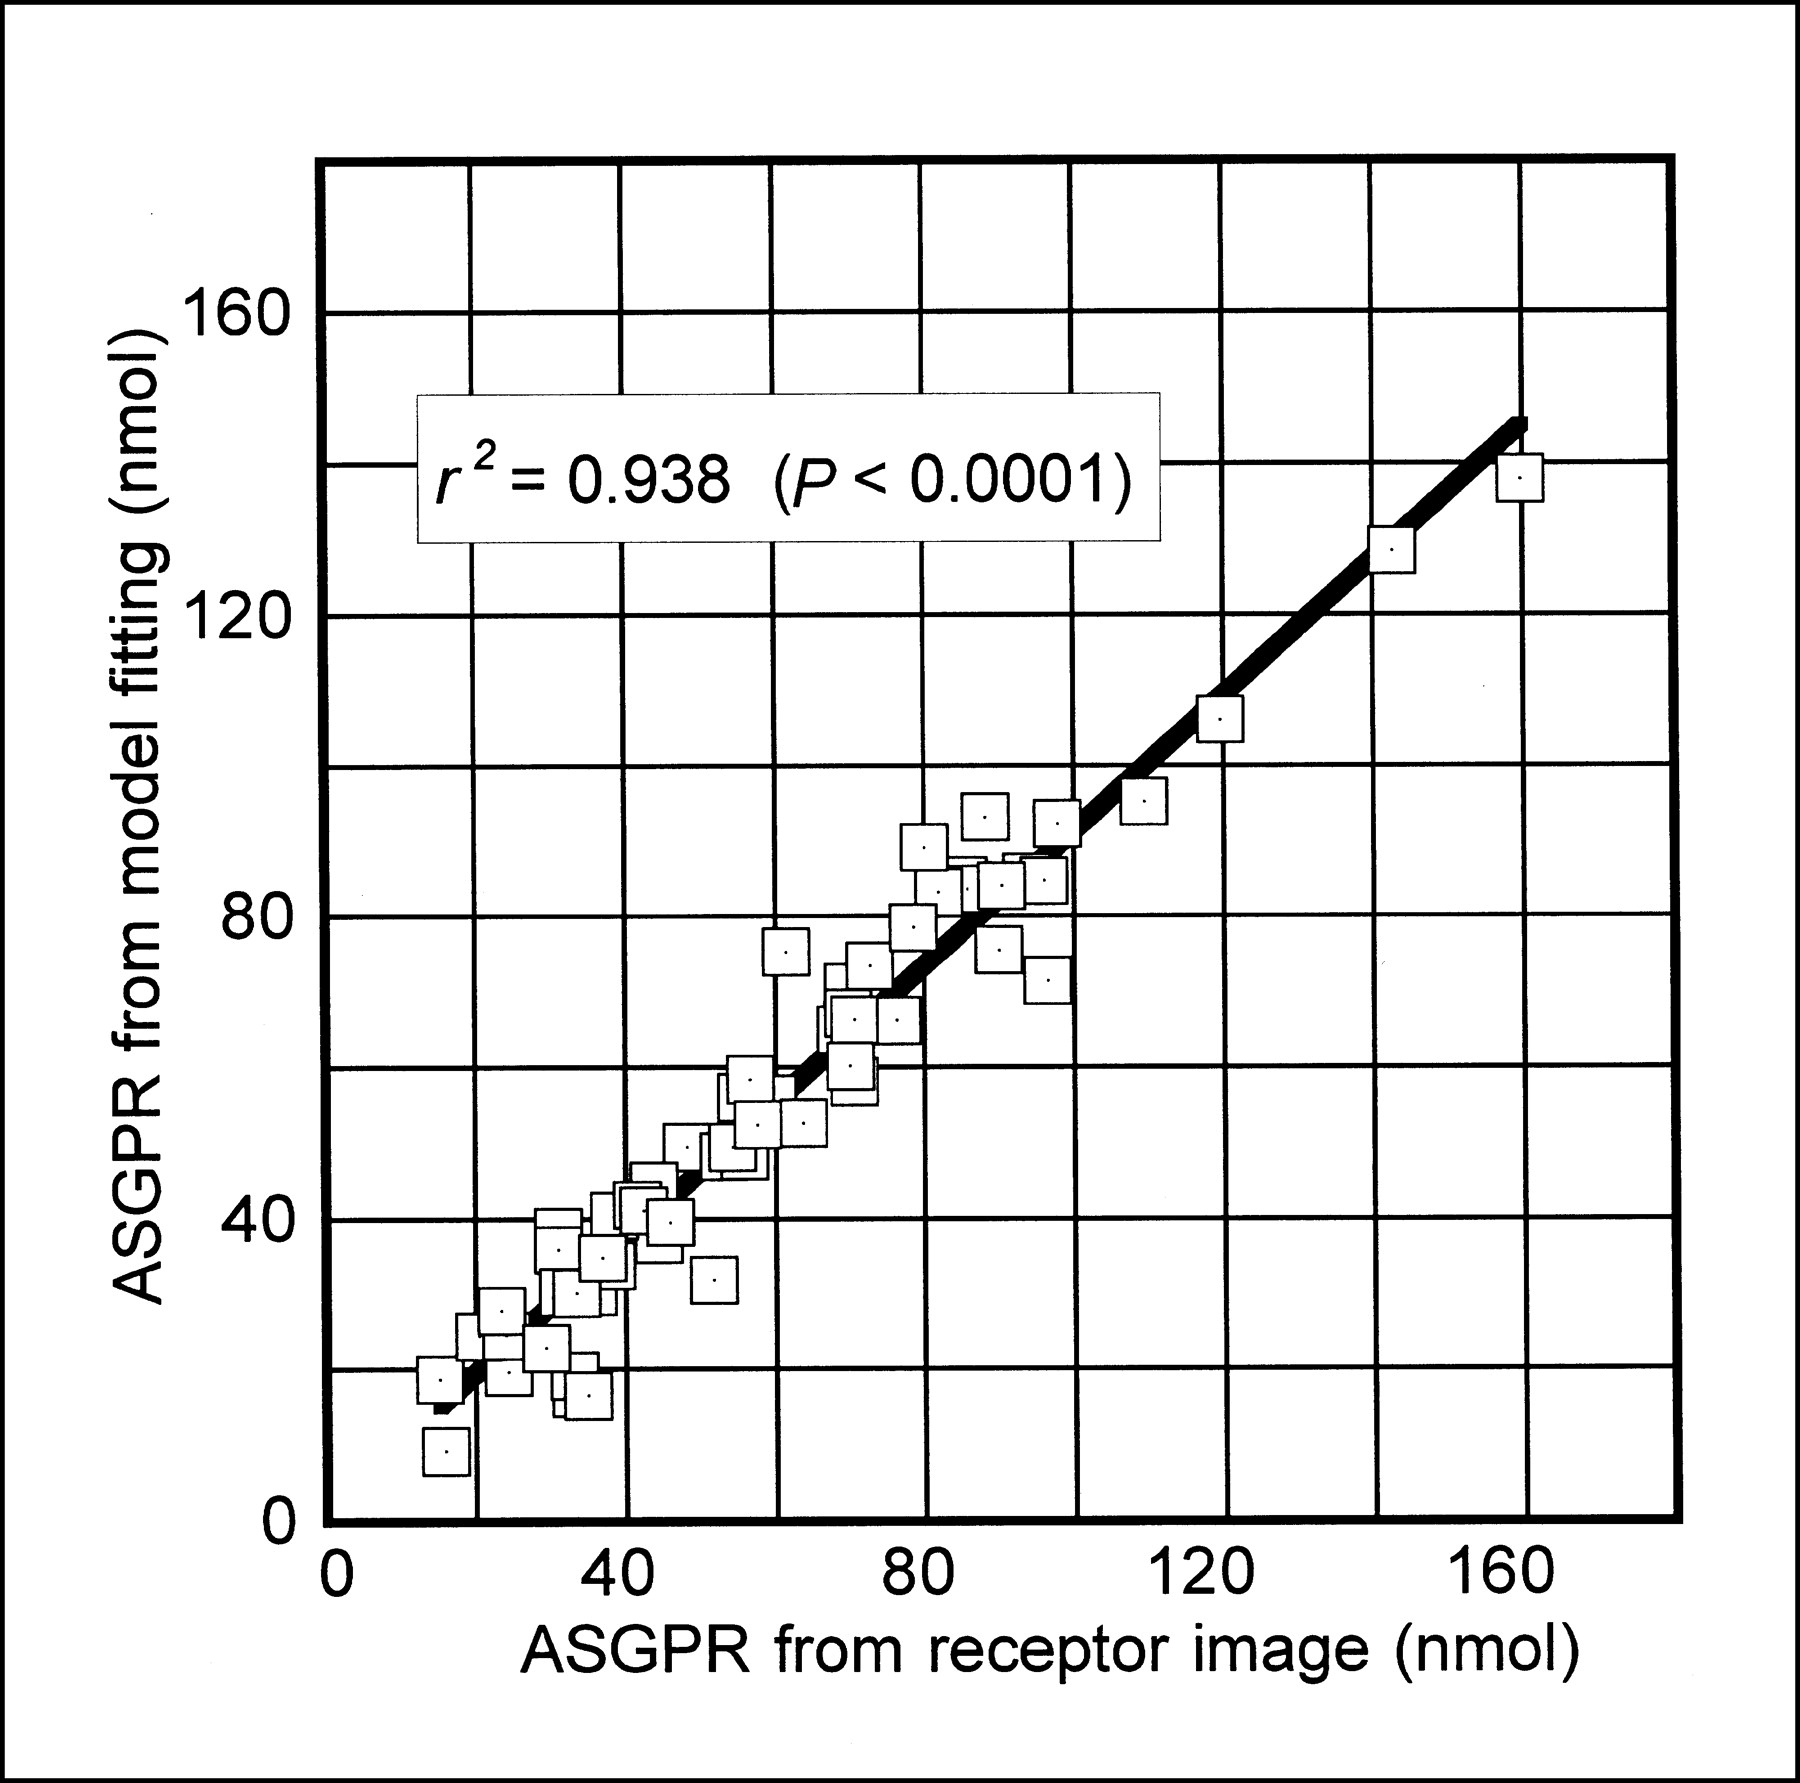
The ratio of Vh to total plasma distribution volume was fixed to the mean of the model estimates (mean ± SD = 18.7% ± 11.1%). The value of k was fixed to the theoretic value (2.475 mL/nmol/min) as described in the methods section. Ro was determined from single-sample plasma distribution volume at 20 min after the injection following Equation 9. Using these parameter values, Av and Cp(t) were determined and Rr was calculated on the basis of Equations 7 and 8. In all cases, mapping of Rr was completed in a few minutes and a parameter image was obtained. An example is shown in Figure 4. To validate this method, the total sum of Rr, which should equal the Ro, was compared with Ro obtained by fitting liver time-activity and time-plasma concentration curves to the model. Figure 5 shows the relationship between the sum of Rr and Ro. The sum of Rr ranged from 15.1 to 159.8 nmol (mean ± SD = 55.7 ± 27.7), and Ro ranged from 9.2 to 138.0 nmol (mean ± SD = 60.3 ± 29.8). There was a significant correlation (r2 = 0.938, P < 0.001). The slope and y-intercept of the regression line were 0.9 and 1.5 (nmol), respectively.
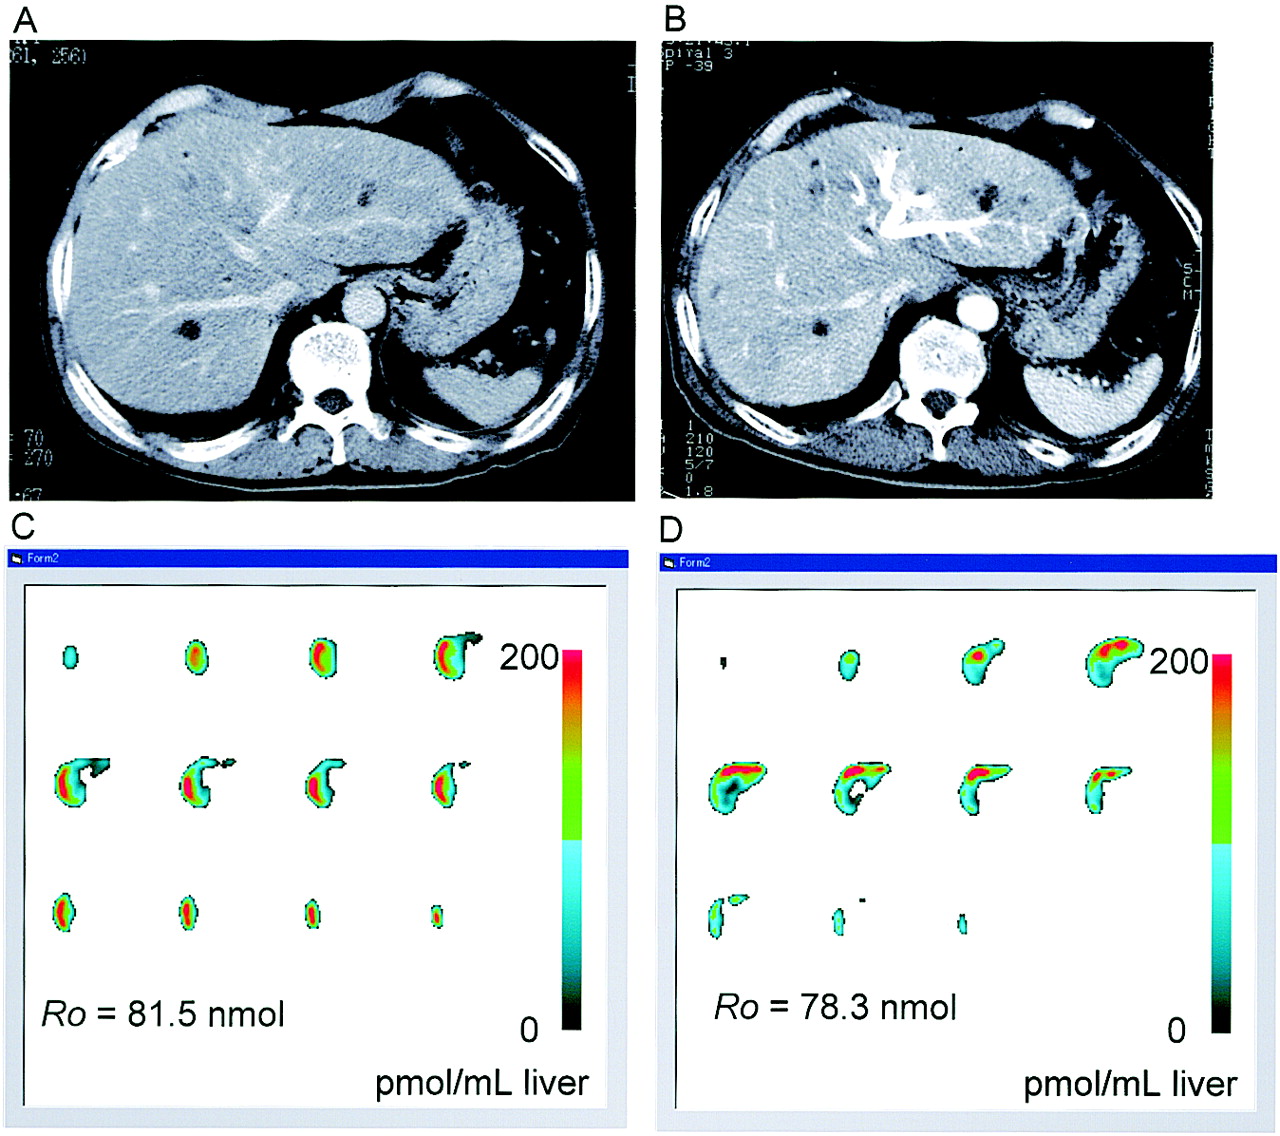
Images from 70-y-old man with cholangioma, who received right portal vein embolization (PE) to induce left lobe hypertrophy before right lobectomy and was studied with 99mTc-GSA before and after PE. Asialoglycoprotein receptor (ASGPR) image 2 mo after PE (D) showed increased ASGPR amount in left lobe, compared with baseline image (C). Voxel value in receptor images is in pmol/mL liver. Corresponding CT images (A and B) before and after PE are references.

Total liver asialoglycoprotein receptor (ASGPR) amounts calculated as sum of liver voxel values of generated ASGP receptor images showed good correlation with those from nonlinear model analysis on plasma and liver dynamic SPECT data.
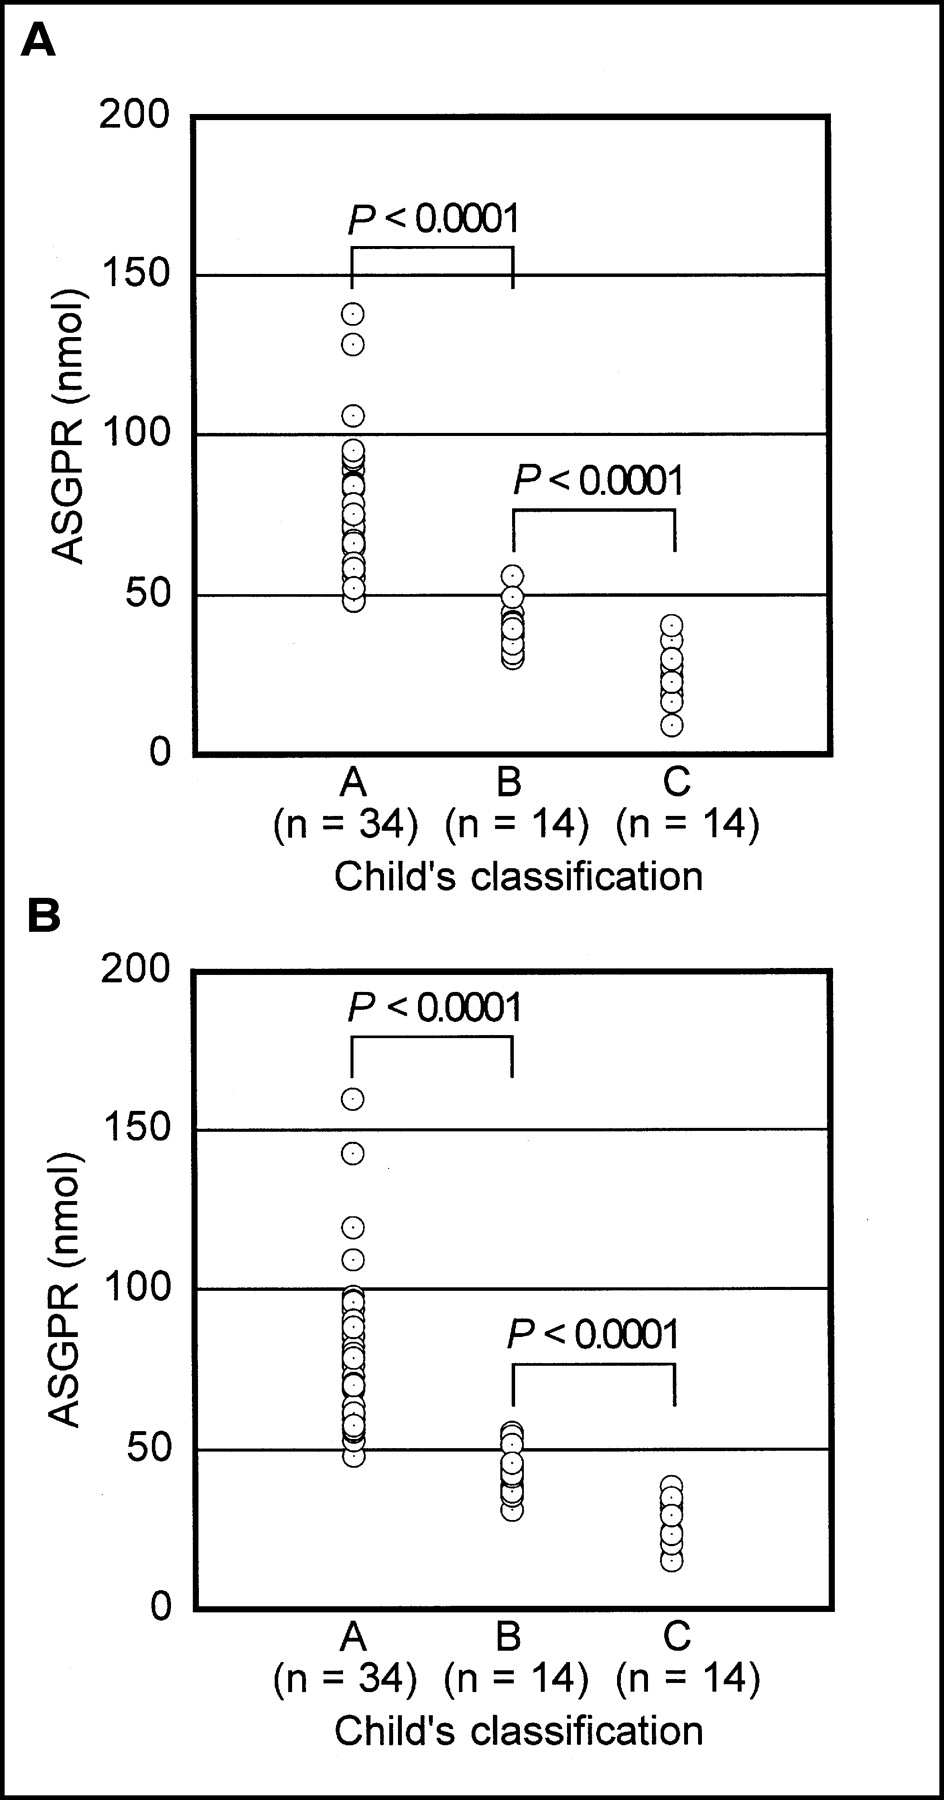
The results of correlation analysis between the ASGP receptor amount and conventional liver function tests are summarized in Table 2, along with the correlation among the liver function tests. The sum of Rr and Ro showed statistically significant correlations (P < 0.001) with the liver function tests. In comparison with the Child’s classification, the sum of Rr and Ro differed significantly among the 3 groups (P < 0.0001). ASGP receptor amounts obtained as Ro by nonlinear model fitting were 75.4 ± 21.0 (n = 34), 39.8 ± 6.9 (n = 14); and 24.0 ± 8.3 (n = 14) nmol in the groups A, B, and C, respectively. Those obtained as the sum of Rr, however, were 80.8 ± 24.5 (n = 34), 43.1 ± 7.1 (n = 14), and 27.8 ± 7.2 (n = 14) nmol in groups A, B, and C, respectively (Fig. 6).

Total liver asialoglycoprotein receptor (ASGPR) amount obtained by nonlinear model fitting (A) and sum of voxel values of receptor image (B) differed significantly among 3 groups of Child’s classification.
Correlation Coefficients Between ASGP Receptor Amount and Liver Function Tests
DISCUSSION
The model used in this study was a simplified version of the 3-compartment model proposed by Vera et al. (4). The main difference was in treatment of plasma flow parameter and constraint on k. In our model, plasma flow was omitted, assuming quasiequilibrium between intra- and extrahepatic plasma compartments, and k was fixed to the theoretic value calculated from the number of galactose residues attached to a GSA molecule (4). At first, we tried the original Vera model without these simplifications, but it was sometimes difficult to estimate plasma flow parameter with only a small error and to determine k and Ro separately. Among the model parameters, k and Ro were highly correlated. Because the injected dose was limited to 3 mg (40 nmol) and the normal value of Ro was reported to be around 100 nmol (5), the injected dose could not saturate the total receptor in some patients with good hepatic reserve. This fact could be one reason for the difficulty in separate estimation of k and Ro. When k was fixed to the theoretic value, nonlinear model fitting became easy to converge and could provide Ro with small error. Using 99mTc-GSA, Ha-Kawa and Tanaka (15) also fixed Michaelis’s constant, which is equivalent to k in a nonlinear model based on Michaelis-Menten’s theory for describing nonlinear uptake by the liver, to avoid correlation between Michaelis’s constant and Rmax. This constraint was validated. As for hepatic plasma flow parameter, even if the plasma flow parameter was omitted and quasiequilibrium between intra- and extrahepatic plasma compartments was assumed instead, the estimated value of receptor amount was not changed in our preliminary study. From these results, we believed elimination of the plasma flow parameter and the constraint on k could be justified.
The single-blood-sampling method for estimating Ro originated in the method for estimating renal clearance in nuclear nephrology (16,17). Because 99mTc-GSA is cleared from blood only by the liver via receptor-ligand binding, we hypothesized that blood retention at a specific time after injection could be determined by the Ro, analogous to the renal agent. The necessary assumption underlying this method is that the tracer exists mainly in the blood and liver. Because 99mTc-GSA has a molecular size similar to that of albumin, a typical intravascular tracer, the assumption that the distribution of the tracer is restricted to blood and liver could be acceptable in the majority of clinical cases. In addition, this assumption has already been made by other investigators in constructing the kinetic models of radiolabeled NGA (18,19) and seemed to have no serious adverse effect on the model consistency. However, in patients with massive ascites or protein-losing disease, there is no guarantee that this assumption is correct. We should be cautious about applying this method to such patients.
To make it possible to generate a functional map of regional ASGP receptor amount from a single static SPECT, several constraints on the model were imposed. These constraints might have introduced some bias into the final estimate. However, the total sum of the voxel receptor amount obtained from the parameter image showed good correlation with the Ro obtained from nonlinear model fitting of dynamic data. This result indicated that the main parameter that determines 99mTc-GSA liver accumulation could be the receptor amount and that fluctuation in other parameters might bring about little effect on liver accumulation of 99mTc-GSA. In theory, any time interval for acquiring static SPECT data would be acceptable as far as the assumptions made on the kinetic model are correct. However, it would be better to avoid initial uptake and late phases (probably <10 min and >30 min after injection) in which the liver time-activity curve has a relatively steep rise and excretion of the tracer into the biliary system sometimes becomes apparent, especially in the case of good liver function. Under these circumstances, the interval of 12–20 min was used in this study for merging dynamic SPECT data to generate a static SPECT equivalent.
Because there is no noninvasive reference test available for evaluating regional liver function, it is difficult to directly validate the clinical significance of the functional mapping method. However, the significant correlations between Ro obtained by this method and the results of conventional liver function tests could support the clinical significance of this method as a quantitative method for analyzing regional liver function. The assessment of regional liver function by mapping ASGP receptors in the liver would be useful not only for simulating and monitoring postoperative hepatic functional state in candidates for hepatectomy and in hepatectomized patients but for diagnosing benign focal liver diseases, such as focal nodular hyperplasia, characterized by hepatocellular hyperplasia. It would also be useful in transplantation for preoperative assessment of living donor liver and postoperative monitoring of transplanted liver.
In comparison with other methods for evaluating regional function using 99mTc-GSA, such as regional liver uptake and initial hepatic clearance (7,8), this method has several advantages. Dynamic SPECT with fast rotation is not needed, and direct generation of the ASGP receptor map from a single static SPECT with lower statistical noise is possible. Moreover, this method could be more relevant for the assessment of regional ASGP receptor amount because nonlinear binding of 99mTc-GSA and the receptor was considered, a factor not incorporated into other methods.
To measure the correct regional tracer dose by SPECT, attenuation and scatter correction are indispensable. Unfortunately, these corrections were not implemented in our study because of the limitation of the gamma camera and data processing system. In these circumstances, our data could contain some inaccuracy in regional ASGP receptor amount, especially in the deep part of the liver. The recent advent of a practical approach to attenuation and scatter correction has improved the accuracy of SPECT measurement of regional tracer amount (20,21). If the system has appropriate hardware and software, these techniques could be incorporated into the functional mapping method to improve accuracy in assessing regional liver function.
CONCLUSION
Based on a simple nonlinear model for 99mTc-GSA liver kinetics, our proposed method could provide a quantitative ASGP receptor image from a single blood sample and static SPECT without dynamic data acquisition. The Ro obtained as a sum of the voxel values of a parameter image showed good correlation with that obtained from nonlinear model fitting of blood and liver dynamic data. Total ASGP receptor amount obtained from the receptor image and nonlinear model fitting showed significant correlations with the results of conventional liver function tests. This approach could be useful for quantitative evaluation of regional liver function and estimation of residual liver function in candidates for hepatectomy.
Acknowledgments
The authors thank Dr. Kimihide Nakamura for his many helpful suggestions and advice in editing the manuscript.
Footnotes
Received Mar. 28, 2002; revision accepted Sep. 25, 2002.
For correspondence or reprints contact: Noriyuki Shuke, MD, Department of Radiology, Asahikawa Medical College, 2-1 Midorigaoka-Higashi, Asahikawa, Hokkaido 078-8510, Japan.
E-mail: shuke{at}asahikawa-med.ac.jp


