


Abstract
11C-Flumazenil (11C-FMZ) is useful to estimate central benzodiazepine receptors by PET. The binding potential (BP) can be calculated with dynamic PET and continual blood sampling. Because conventional metabolite analysis of plasma samples is complicated and time consuming, a simple method is required to obtain an input function. In this article, a whole blood solvent extraction method was evaluated using data of 13 subjects. Methods: The plasma solvent extraction method was estimated in comparison with the thin-layer chromatography (TLC) method. Then, the whole blood solvent extraction method was evaluated in comparison with the plasma solvent extraction method. Results: Metabolite data analyzed by the plasma extraction method were well correlated with those by the TLC method (r = 0.99). The BP was calculated using both the whole blood extraction data and the plasma extraction data. No difference was observed in all brain regions. Conclusion: This simple whole blood solvent extraction method can be applied to clinical BP estimation using 11C-FMZ.
Central benzodiazepine receptors in the human brain can be estimated using 11C-flumazenil (11C-FMZ) with PET (1–3). The binding potential (BP) can be estimated with dynamic PET data acquisition and an appropriate input function after injection of 11C-FMZ. It is well known that part of a lipophilic drug that is injected intravenously remains in blood cells and cannot contribute to drug permeation through the plasma membrane of the target organ. This is why the fraction in the blood cells must be removed to obtain an accurate input function of the injected drug. Moreover, it has been reported that 11C-FMZ is metabolized to a free acid and an alcohol form (4,5), although some groups have not detected an alcohol form in plasma (6,7). Therefore, it is very important to make an accurate measurement of the unchanged 11C-FMZ fraction in the plasma to obtain an appropriate input function after injection of 11C-FMZ.
Some investigators have reported obtaining an input function of 11C-FMZ. High-performance liquid chromatography (HPLC) or thin-layer chromatography (TLC) analytic methods are usually applied to measure the unchanged 11C-FMZ fraction in the plasma (5,8–10). Koeppe et al. (11) have reported a Sep-Pak (Waters, Milford, MA) extraction method using plasma, but 11C-FMZ was not completely separated from metabolites with this column. Alternatively, Barre et al. (6) have reported an extraction method to obtain an unchanged 11C-FMZ fraction using whole blood. They showed a good correlation between the extraction method and the TLC method using whole blood. This extraction method is simpler than the HPLC or the TLC method for clinical use. However, the authors have not validated the extraction method using plasma, which is essentially used to obtain an input function. Again, metabolite analysis of plasma samples is usually performed by HPLC or TLC, and these methods are very complicated and time consuming.
On this basis, a simple method is required to obtain an input function. The objectives of this study were (a) to validate the plasma extraction method in comparison with the TLC method using plasma and (b) to apply this extraction method to whole blood samples and validate the method by comparison between the BP calculated using whole blood data and that using plasma data as an input function.
MATERIALS AND METHODS
A PET camera (Advance; General Electric Medical Systems, Milwaukee, WI) was used for dynamic data acquisition. The characteristics of this camera have been described (12). The spatial resolution of the reconstructed clinical PET images is ∼8-mm full width at half maximum at the center of the field of view, and the axial resolution is ∼4 mm.
All chemicals were purchased from Aldrich Chemical Co. (Milwaukee, WI). FMZ and demethyl-FMZ were supplied by Hoffmann-La Roche (Basel, Switzerland).
We studied 12 healthy male volunteers and 1 healthy female volunteer with an average age of 40.0 y (range, 21–65 y). The investigative nature and potential risks of the study were explained to all subjects. Each subject provided written informed consent approved by the Kyoto University Ethics Committee.
An NaI scintillation γ-counter (Aloka, Tokyo, Japan) was used to count the radioactivity with count efficiency correction using a 22Na source.
Synthesis of 11C-FMZ
11C-FMZ was synthesized by the 11C-methylation reaction of demethyl-FMZ, Ro15-5528 according to the method reported by Suzuki et al. (13) with a slight modification. In brief, 11C-methyl iodide was trapped in 0.4 mL dimethylformamide solution containing 0.5 mg demethyl-FMZ and 0.4 mg NaH at −15°C. The solution was heated at 120°C for 1 min and applied to an HPLC column. The preparative column was Megapak SIL C18-10, 7.5 × 250 mm (JASCO, Tokyo, Japan), and the mobile phase was a mixture of acetonitrile and 10 mmol/L sodium dihydrogen phosphate solution (23:77, v/v) with a flow rate of 7 mL/min (11C-FMZ fraction, 11.5–12.0 min). The radiochemical purity of 11C-FMZ was analyzed by HPLC on a reverse-phase column (YMC-Pack ODS-AM, AM-312, 6 × 150 mm, S-5, 120A; YMC Co., Ltd., Kyoto, Japan) with a mobile phase of acetonitrile and 10 mmol/L sodium dihydrogen phosphate solution (40:60, v/v) with a flow rate of 2 mL/min. The 11C-FMZ fraction was detected at 3.4 min and demethyl-FMZ was detected at 2.8 min. The radiochemical purity was >98.5%. The specific activity of the product was 57.4 ± 12.6 GBq/μmol, and the radiochemical yield was 2.3 ± 1.0 GBq (n = 13).
PET Scan Protocols
Each subject was positioned in the gantry of the PET camera with the aid of laser markers. A 10-min transmission scan using 3 rotating 68Ge-68Ga pin sources was made for the attenuation correction. After obtaining the transmission scan, the subjects were injected with 11C-FMZ (300–500 MBq) using an automatic injector via a radial vein for 30 s, and a 25-frame dynamic PET scan was obtained for 50 min (2 min × 25 frames). Blood samples (1.0 mL) were drawn via a contralateral radial artery catheter at 10, 20, 30, 40, 50, 60, 70, 80, 90, 100, 110, 120, 135, 150, and 165 s and 3, 5, 7, 10, 15, 20, 30, 40, and 50 min after injection. The blood samples obtained were weighed and centrifuged at 3,000 rpm, 4°C for 3 min. About 200 μL of plasma samples were obtained and weighed. The radioactivity in the plasma and the residue was counted using an NaI scintillation counter. The radioactivity in the whole blood was obtained by adding both counts after decay correction. All PET data were corrected for dead time, decay, and photon attenuation. After image reconstruction by the filtered backprojection method, the cortex, basal ganglia, thalamus, cerebellum, brain stem, and cortical white matter were selected as regions of interest. Time-activity curves in these regions were obtained.
Extraction of Unchanged 11C-FMZ in Whole Blood and Plasma
Extraction of unchanged 11C-FMZ in blood samples was performed according to the method reported by Barrre et al. (6) with a slight modification. In brief, a mixture of 100 mL each of chloroform and 0.9% NaCl solution adjusted to pH 11 with 0.1 mol/L NaOH was prepared on the day before study (stock mixture). The chloroform layer was saturated with the pH 11 NaCl solution. Before the PET study, chloroform (2.0 mL) and pH 11 NaCl solution (2.0 mL) were measured from the stock solution, added in a screw-capped glass tube, and weighed. Arterial blood samples (2.0 mL) were obtained at 1, 3, 5, 7, 10, 15, 20, 30, 40, and 50 min after injection of 11C-FMZ. Each sample was further divided into 2 samples. Whole blood (0.5 mL) was added to the screw-capped glass tube and weighed. After mixing well with a vortex mixer and centrifugation at 3,000 rpm, 4°C for 3 min, the supernatant was removed. The lower layer was sampled and weighed in another glass tube. The radioactivity in the tube was counted. The percentage of unchanged 11C-FMZ in the whole blood was calculated. For the first 3-min samples, the percentage of chloroform-extracted fraction was lineally extrapolated using the data at 1 and 3 min after injection. The time-activity curve of unchanged 11C-FMZ was obtained by multiplying the time-activity curve of the whole count of the whole blood by the percentage of unchanged 11C-FMZ fraction in the whole blood. A 0.5-mL plasma sample was obtained from 1.5 mL of the arterial blood sample. The radioactivity in the plasma was extracted with chloroform in the same manner described above. The time-activity curve of unchanged 11C-FMZ in the plasma was obtained by multiplying the time-activity curve of the whole count of the plasma by the percentage of unchanged 11C-FMZ fraction in the plasma.
Metabolite Analysis by TLC
Metabolites in the plasma after injection of 11C-FMZ were analyzed by TLC to compare with metabolites assayed by the plasma extraction method described above. TLC metabolite analysis was performed on 5 of the 13 subjects. After intravenous injection of 11C-FMZ into the subjects, the arterial blood (1.0 mL) was sampled at 1, 3, 5, 7, 10, 15, 20, 30, 40, and 50 min. After centrifugation of the blood at 3,000 rpm, 4°C for 3 min, 200 μL of the plasma were sampled. The plasma was mixed with acetonitrile (200 μL) and centrifuged at 8,000 rpm for 5 min. The supernatant was applied on a silica gel TLC plate (LK6DF; Whatman, Ann Arbor, MI) and developed with a mixture of chloroform, ethanol, and acetic acid (90:10:0.5). The Rf of 11C-FMZ in this system is 0.6–0.7. After drying and marking the solvent front and the origin with radioactivity, the TLC plates were put in contact with a phosphor imaging plate overnight. The exposed images were read with a BAS2000 phosphor imager (Fuji Photo Film Co., Tokyo, Japan) and analyzed with MacBAS, version 2.5 (Fuji Photo Film Co., Tokyo, Japan). Regions of interest were placed on the image of the TLC plates and the percentage of unchanged 11C-FMZ fraction was estimated by dividing the peak area of the 11C-FMZ by the total area of all chromatographic peaks. Pearson linear regression analysis was performed to evaluate the correlation between the percentage of unchanged 11C-FMZ fraction obtained with the TLC method and with the extraction method.
Calculation of BP
The BP of 11C-FMZ in the brain regions was calculated by a graphical plot analysis with the white matter as a reference region according to Logan et al. (14) using both chloroform extracted time-activity curves obtained from whole blood and plasma as an input function.
RESULTS
Validation of Plasma Extraction Method by TLC Method
Figure 1 shows the correlation between the percentage of unchanged 11C-FMZ fraction in the plasma obtained by the TLC method and the extraction method. The metabolite data analyzed by the plasma extraction method correlated well with those by the TLC method (r = 0.99).
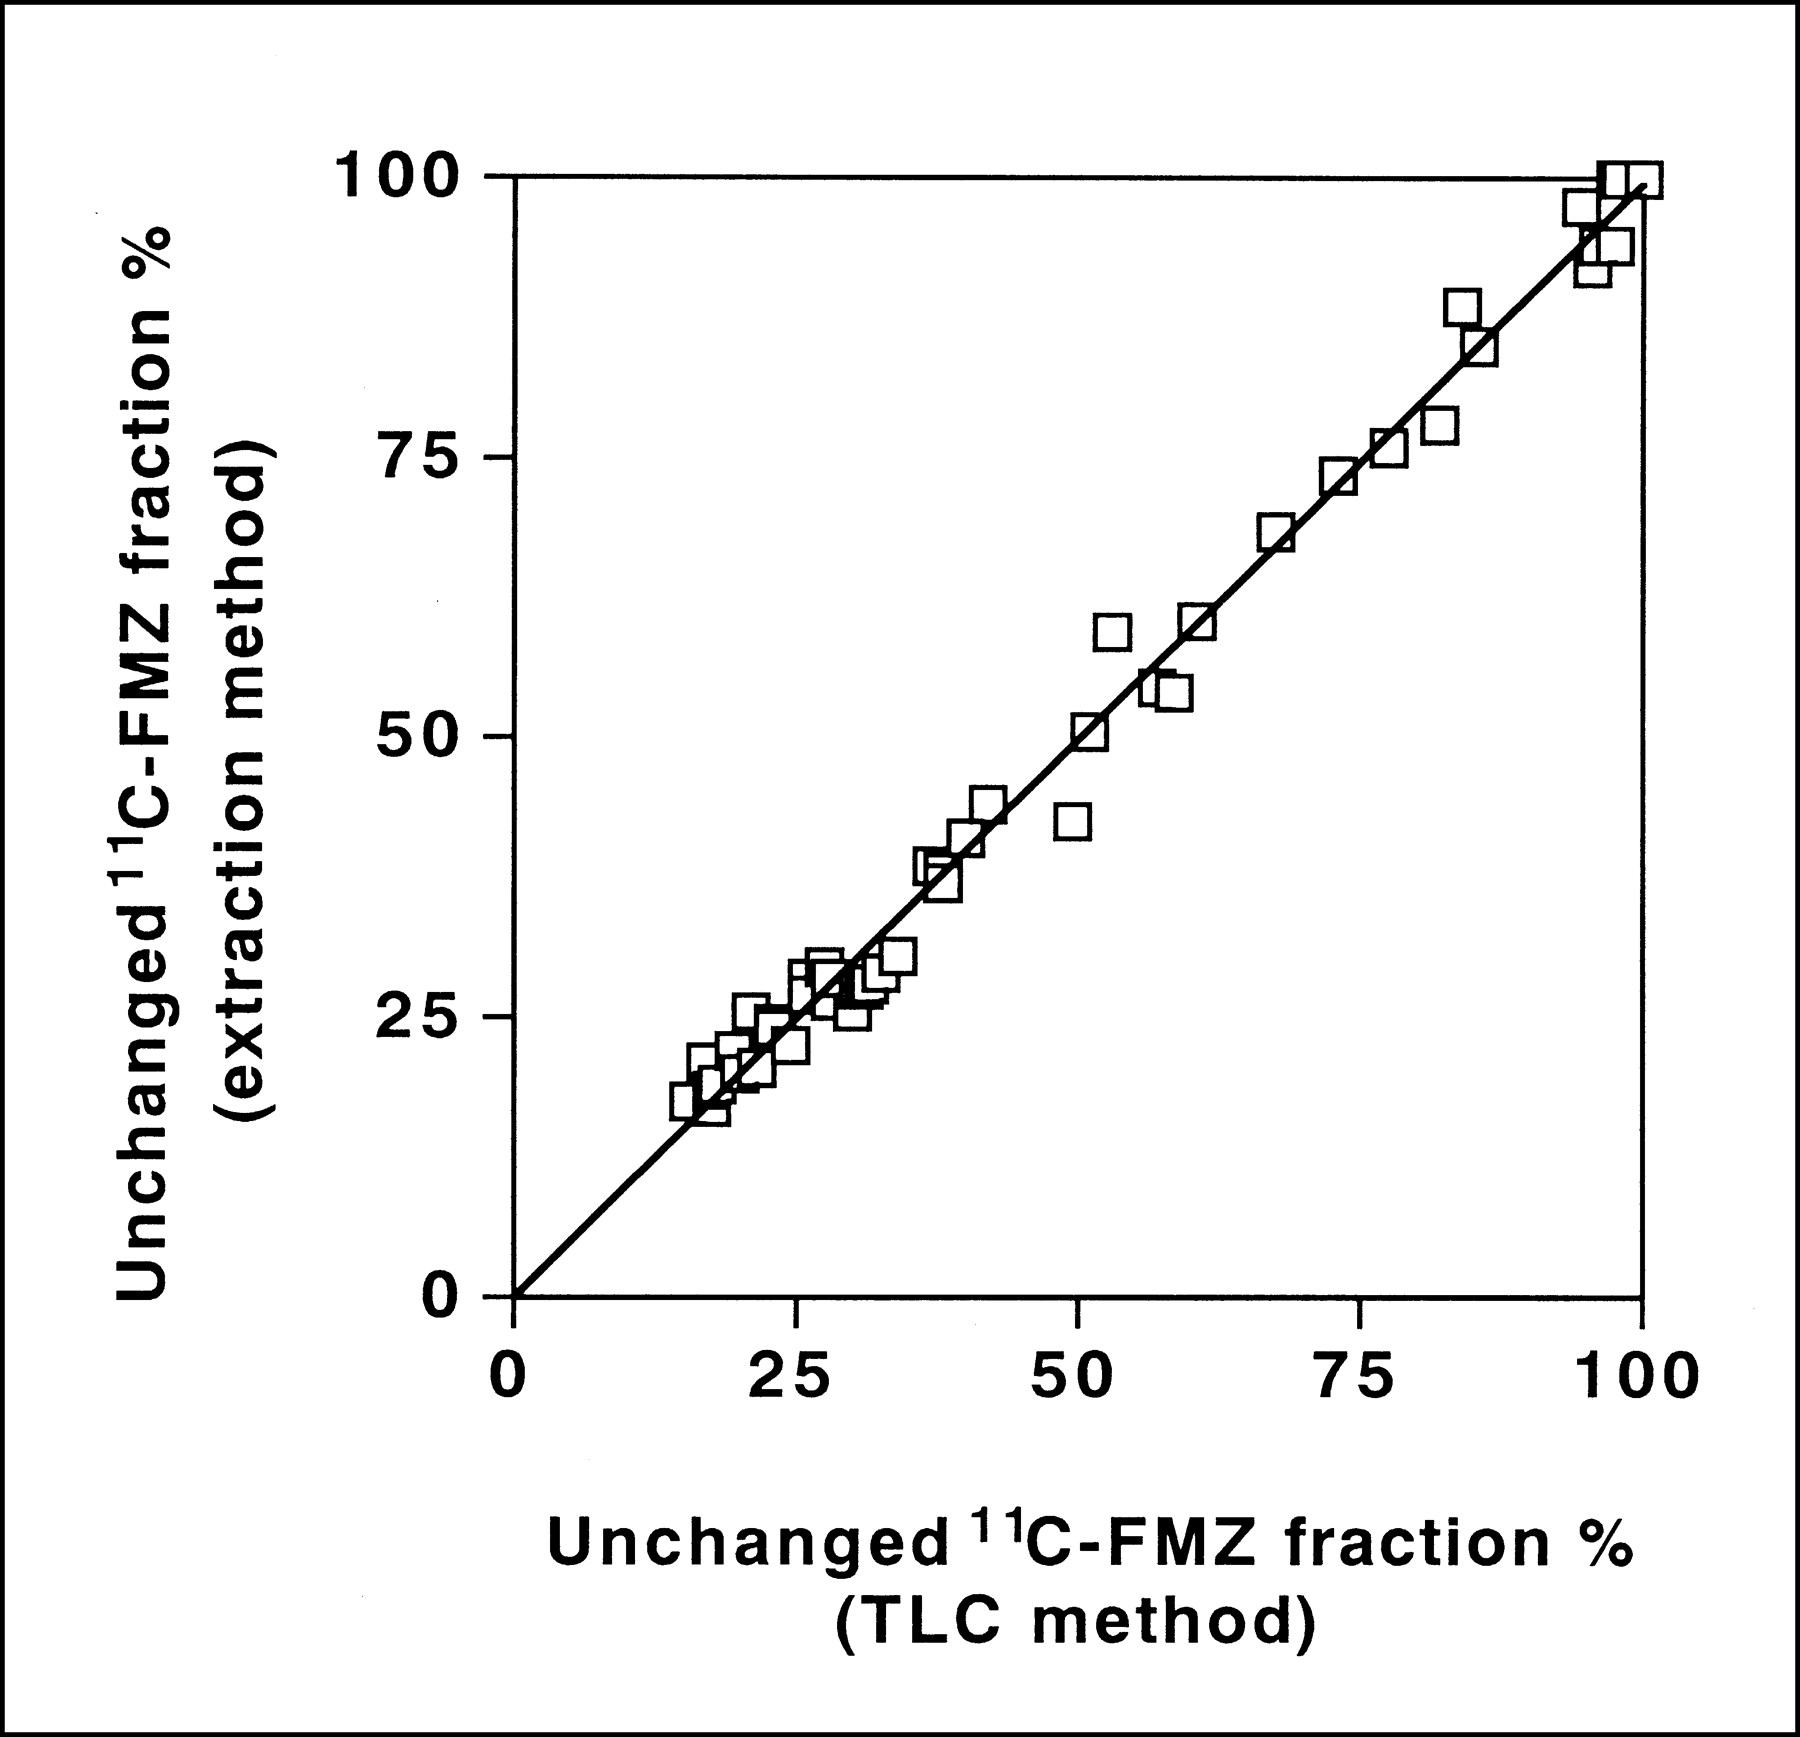
Correlation of percentage of unchanged 11C-FMZ fraction between TLC method and extraction method using plasma samples. Linear regression curve shows y = 0.99x + 0.18. Correlation efficient estimated by Pearson correlation analysis is 0.995.
Comparison Between Whole Blood and Plasma Time-Activity Curves
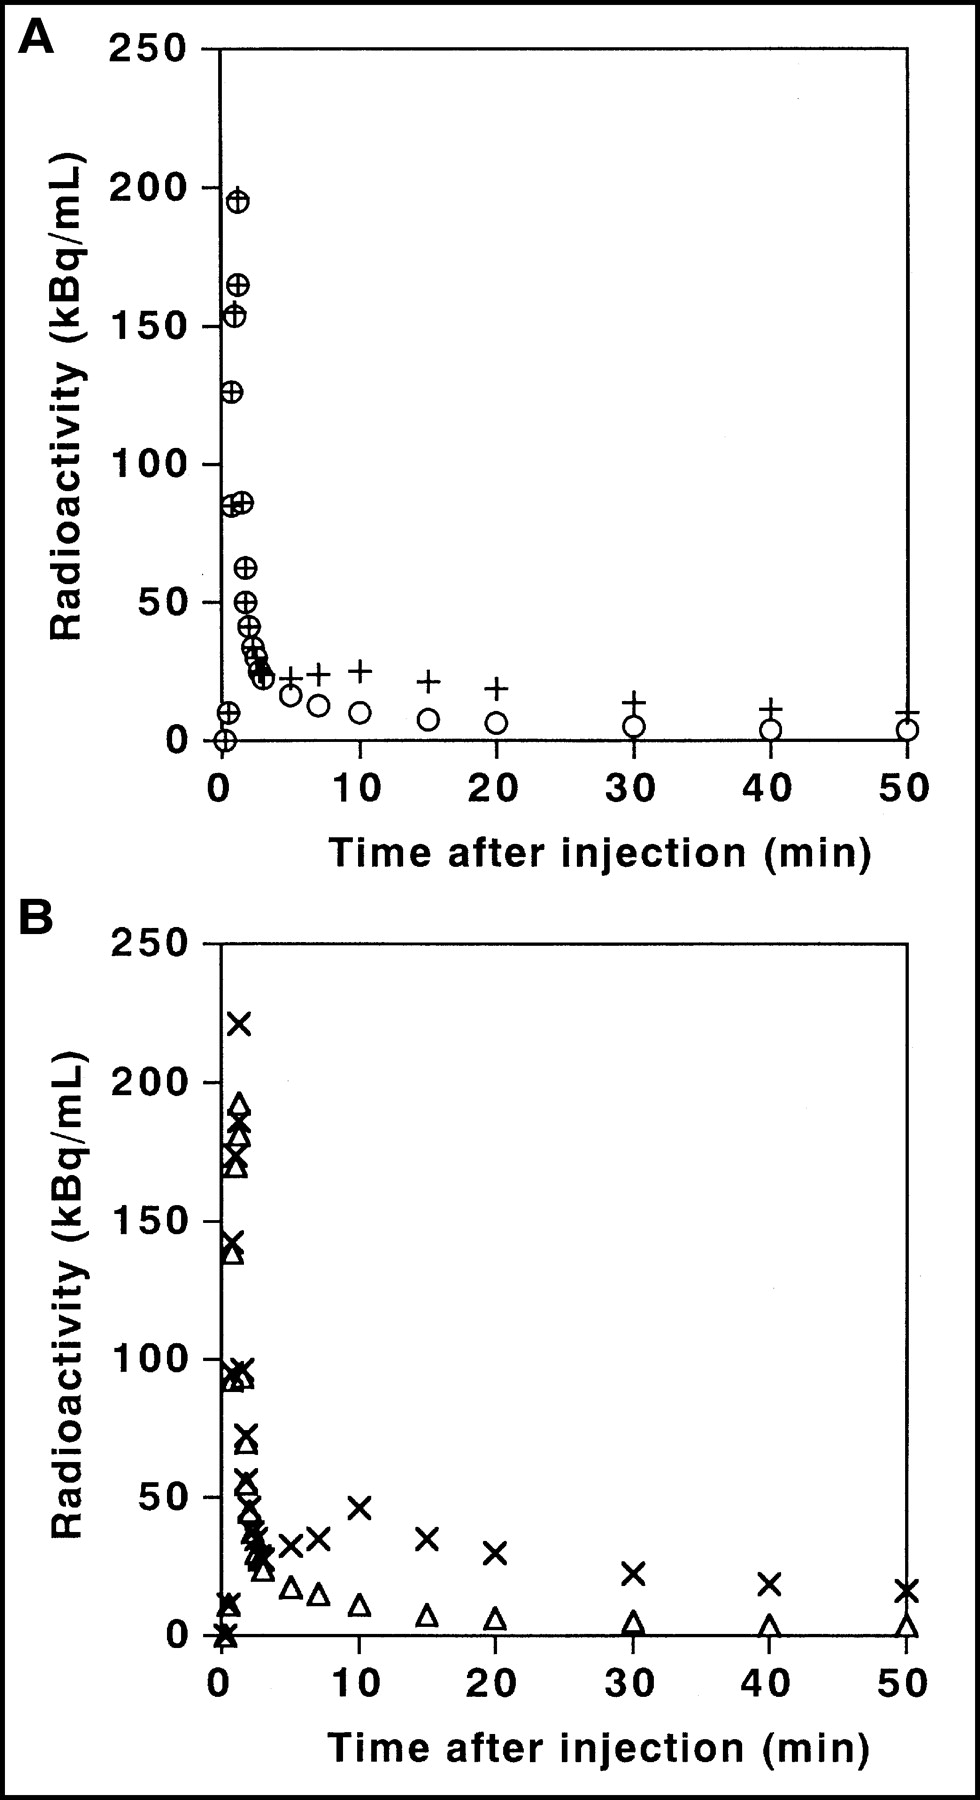
Figure 2 shows typical time-activity curves of whole blood (Fig. 2A) and plasma (Fig. 2B). No difference was observed between both time-activity curves in the early phase after injection of 11C-FMZ. The first metabolite peak could be seen from 7 to 20 min after injection of 11C-FMZ in both time-activity curves. The plasma time-activity curve showed a higher value than the whole blood time-activity curve after the time when the first metabolite peak could be observed. The area under the curve of the plasma curve after metabolite correction was slightly higher (6.7% ± 3.3%; n = 13) than that of the whole blood curve after metabolite correction.

Typical time-activity curves after injection of 11C-FMZ. (A) Time-activity curve obtained using whole blood samples and extraction method. +, Radioactivity in whole blood samples (kBq/mL); ○, unmetabolized 11C-FMZ in whole blood samples (kBq/mL). (B) Time-activity curve obtained using plasma samples and extraction method. ×, Radioactivity in plasma samples (kBq/mL); ▵, unmetabolized 11C-FMZ in plasma samples (kBq/mL).
Figure 3 shows the percentage of unchanged 11C-FMZ fraction of whole blood and plasma. The percentage of unchanged 11C-FMZ fraction varied individually. The variation in the percentage of unchanged 11C-FMZ fraction in whole blood (19.6%–59.7% at 50 min after injection) was larger than that in the plasma (14.5%–34.9% at 50 min after injection).

Time course of percentage of unchanged 11C-FMZ fraction of all subjects. ○, Time course of percentage of unchanged 11C-FMZ fraction obtained from whole blood extraction method; ▵, time course of percentage of unchanged 11C-FMZ fraction obtained from plasma extraction method. Data are presented as mean ± SD.
Comparison of BP
The BP was calculated using both the whole blood metabolite-corrected time-activity curve and the plasma metabolite-corrected time-activity curve (Table 1). There was no significant difference between both values. The right side of Table 1 shows the BP differences between both methods. Each value was calculated as follows: (BP [whole blood extraction method] − BP [plasma extraction method])/BP [plasma extraction method] × 100 (%). A maximum difference of 2.5% was observed in healthy volunteer 1. The average of the differences was <1% in all regions.
Comparison of BP Values Using Whole Blood and Plasma and Differences Between BP Calculated Using Whole Blood and BP Calculated Using Plasma
DISCUSSION
The results of metabolite analysis by the extraction method using plasma samples were consistent with those by the TLC method (Fig. 1). These results support the accuracy of the extraction method. The major metabolite has been reported to be a carboxylic acid derivative but it was not extracted by the chloroform layer at pH 11 because of the ion charged form at the pH (6). Another metabolite, alcohol form metabolite, was not found by the TLC method in this study. The mother compound, 11C-FMZ, was well extracted by the chloroform layer under the same conditions (>98%; data not shown). This shows that no correction of extraction efficiency is needed to obtain an input function of 11C-FMZ after injection. Barre et al. (6) have previously validated the extraction method using whole blood samples to compare with the TLC method using whole blood. Plasma sample data are essentially used as an input function. This is why rapid equilibrium of the free fraction of the injected drug is not reached between the plasma and whole blood in the case of specific binding in blood cells or tight protein binding. As shown in this study, there was little difference between the unchanged 11C-FMZ concentration in the plasma and that in the whole blood. It would seem that unchanged 11C-FMZ exists in the blood cell fraction with nonspecific binding to blood cell membrane proteins and there is a rapid equilibrium between the free fraction of 11C-FMZ in the plasma and blood cell binding fractions. Moreover, it can be seen that almost all metabolites exist in the plasma.
It was expected that the percentage of unchanged 11C-FMZ fraction would decrease exponentially or biexponentially after the injection of 11C-FMZ. A part of the injected 11C-FMZ returned to the systemic circulation through the hepatic circulation and 11C-FMZ was injected intravenously for 30 s. This is why no difference in the percentage of unchanged 11C-FMZ fraction was observed in the first 3 min after the injection of 11C-FMZ (Fig. 3). A rapid bolus injection is necessary to obtain an exponential decrease curve. The percentage of unchanged 11C-FMZ fraction varied individually as reported by Ishiwata et al. (15). They reported that the mean percentage of unchanged 11C-FMZ could not be used as a standardized metabolic value because of large individual variations. However, the percentage of individual unchanged 11C-FMZ fraction can be computed with a few point assays because the percentage of unchanged 11C-FMZ fraction is assumed to be 100% before 3 min after injection of 11C-FMZ, and the curve of the percentage of unchanged 11C-FMZ fraction is simulated exponentially or biexponentially following 3 min after injection of 11C-FMZ. Then, metabolite analysis can be reduced, although the total radioactivity in whole blood is to be assayed and it is now under consideration.
Our data showed that there was no difference between BP calculated using the time-activity curve of unchanged 11C-FMZ obtained with whole blood radioactivity and with plasma radioactivity. The average of the differences was <1% in all regions (Table 1). This value was considered permissible, although small individual variations were observed. However, such an extraction method using whole blood without plasma separation was considered to be characteristic of 11C-FMZ. This method cannot always be applied to another radiopharmaceutical. Each case should be individually ascertained. Such a simple analytic method provides a great advantage for quantitative estimation in clinical studies.
CONCLUSION
The BP was calculated using both the whole blood extraction data and the plasma extraction data after injection of 11C-FMZ. No difference was observed in all brain regions. Our results showed that whole blood could be used for an input function instead of plasma to evaluate the BP using 11C-FMZ. This simple whole blood solvent extraction method can be applied to the clinical use of 11C-FMZ PET study.
Acknowledgments
This work was supported in part by a grant from the Research for the Future Program of the Japan Society for the Promotion of Science (JSPS-RFTF97K00201) and by a grant for the Smoking Research Foundation.
Footnotes
Received Jul. 1, 2002; revision accepted Sep. 27, 2002.
For correspondence or reprints contact: Yasuhiro Magata, PhD, Photon Medical Research Center, Hamamatsu University School of Medicine, 1-20-1 Handayama, Hamamatsu, Japan.
E-mail: magata{at}hama-med.ac.jp


