


Abstract
PET with l-1-11C-tyrosine (TYR) can measure and quantify increased protein synthesis in tumor tissue in vivo. For quantification of the protein synthesis rate (PSR), arterial cannulation with repeated blood sampling to obtain the plasma input function and a dynamic TYR PET study to calculate a time–activity curve are necessary. In most PET studies the standardized uptake value (SUV) method is used to quantify tumor activity. The SUV can be calculated without repeated arterial blood sampling and prolonged scanning time, as required for determination of the PSR. The relationship between PSR and SUV is largely unknown and different factors can cause wide variability in the SUV. Therefore, the comparison of the absolute quantification method (PSR) with the SUV method is obligatory to determine the possible use of noninvasive PET in head and neck oncology. Methods: Twenty-four patients with proven squamous cell carcinomas of the larynx (T1–T4) were studied using dynamic TYR PET. The PSRs of tumor and nontumor (background) regions were determined. Four different methods were used to calculate the SUV: uncorrected SUV (SUVBW); and SUVs corrected for body surface area (SUVBSA), for lean body mass (SUVLBM), and for the Quetelet index (SUVQI). Correlations between PSR values and SUVs were calculated. Results: The PSR of all tumors was significantly higher (P < 0.001) than the PSR of nontumor tissue. The correlations of SUVBW, SUVBSA, SUVLBM, and SUVQI with the quantitative values of the PSR were high (r = 0.84–0.90). The best correlation was observed with the SUV based on the LBM (SUVLBM). Conclusion: High correlation between the quantitative values (PSR) and the SUVs offers the possibility to use noninvasive TYR PET for detection and reliable quantification of primary head and neck tumors.
- l-1-11C-tyrosine
- PET
- head and neck carcinoma
- quantification
- protein synthesis rate
- standardized uptake value
With the advent of 18F-FDG as radiopharmaceutical, PET has evolved from an interesting research tool to a clinically important instrument, especially for diagnosing cancer. However, this important development has focused predominantly on visual analysis of the images obtained and, consequently, another important feature of PET, the potential to quantify metabolic and pathophysiologic parameters in vivo, has remained relatively unexplored. Quantification has not increased diagnostic power of 18F-FDG as much as expected at the onset, which may have lead to overlooking the feasibility of quantitative PET. Because of the properties of positron decay, it is possible to correct photon attenuation by means of a transmission scan. In the field of oncology, this unique property of PET may be important for therapy evaluation.
PET data can be translated into quantitative terms either by applying kinetic models or by calculating the standardized uptake value (SUV), also called the differential absorption ratio. Kinetic analyses of PET require analysis of the radiopharmaceutical’s disappearance from the blood and uptake in the target tissue—for example, the tumor. Consequently, elaborate protocols with dynamic scanning must be applied and arterial cannulation is often needed to obtain blood samples for the tissue input function. Such protocols are patient unfriendly and, therefore, often replaced by the calculation of an SUV. This calculation only requires a short attenuation-corrected static scan without blood sampling and is, therefore, less stressful for the patient. However, several shortcomings of the SUV have been reported (1,2). Traditionally the SUV has been calculated on the basis of body weight (SUVBW), but several authors have introduced the use of SUVs that are based on lean body mass (SUVLBM) (3) or body surface area (SUVBSA) (4). No particular advantage of the one over the other has been established, although 18F-FDG PET studies appear to indicate that SUVLBM is preferred to SUVBW.
The use of amino acids as radiotracers was advocated by several authors because of the relatively low specificity of 18F-FDG. In contrast to glucose, amino acids are less avidly metabolized in inflammatory tissue, which may be advantageous when applying PET for therapy evaluation (5,6). When using PET with l-1-11C-tyrosine (TYR), quantification of protein synthesis of tumor tissue is possible by calculation of the protein synthesis rate (PSR) (7). The relationship between the calculated PSR, obtained via kinetic modeling, and the SUV values as mentioned above (SUVBW, SUVBSA, and SUVLBM) is still largely unknown. To estimate the correlation between the PSR and the SUV, and to determine the feasibility of noninvasive TYR PET in head and neck oncology, we studied a relatively homogeneous group of patients to avoid confounding problems of different tumor types. We also explored whether the use of a new SUV formula (SUVQI) based on the Quetelet index (QI) showed a better correlation with the PSR than SUVBW, SUVBSA, or SUVLBM.
MATERIALS AND METHODS
Patients
Patients with histologically proven laryngeal squamous cell carcinoma who were candidates for radiotherapy, surgery, or both were eligible. Tumors were clinically staged according to the International Union Against Cancer primary tumor (T), regional nodes (N), and metastasis (M) classification system (8), including physical examination of the head and neck, endoscopic examination under general anesthesia, biopsies of all suspicious areas of the upper aerodigestive tract, and CT imaging. The study was approved by the Medical Ethics Committee of the Groningen University Hospital. Written informed consent was obtained from all subjects. Patients fasted for at least 8 h before the study commenced, but they were allowed to drink water and to use their normal medication.
PET Data Acquisition
Dynamic TYR PET studies were performed on all patients and PET images were acquired using an ECAT 951/31 PET camera (Siemens/CTI, Knoxville, TN). This device has a 56-cm-diameter patient aperture and acquires 31 planes simultaneously. The axial field of view is 10.8 cm and the resolution is 6-mm full width of half maximum. The head of the patient was fixed with the Frankfurter horizontal plane (line between the external meatus acusticus and the lower orbital rim) making an angle of 110° with the horizontal bed position. TYR was produced via a modified microwave-induced Bücherer–Strecker synthesis (9). Synthesis time was 40 min, including high-performance liquid chromatography (HPLC) purification and testing for sterility. The radiochemical purity was >99%. A venous cannula was placed in the anticubital vein of the forearm for injection of TYR. In the radial artery of the contralateral arm, an arterial cannula was placed under local anesthesia. Before injection of TYR, a 20-min transmission scan was obtained to correct for photon attenuation. The nonradiolabeled tyrosine concentration was assessed in plasma taken shortly before TYR was administered intravenously over a 1-min period. A median dose of 346 MBq (range, 163–400 MBq) of TYR was injected. Dynamic scanning with 16 time frames was performed from the time of injection to 50 min after injection at the level of the tumor. The protocol included 10 frames of 30 s, 3 frames of 5 min, and 3 frames of 10 min. Arterial blood samples were taken simultaneously at set time points to assess the TYR plasma time–activity curve, 11CO2 concentration, and other 11C-labeled metabolites by radio-HPLC (7).
PSR.
PET images were displayed applying standard ECAT software. To obtain the tumor PSR, a region of interest (ROI) was placed in the plane with most intense uptake at the site of the tumor as observed at visual analysis, using a 70% threshold of maximum intensity. The tissue time–activity curve obtained from this ROI, together with the plasma-input data (MBq/mL TYR corrected for 11CO2 and 11C-labeled plasma proteins), was used to calculate the average PSR in nanomoles per milliliter tumor tissue per minute (nmol/mL/min) using a modified Patlak analysis (7). By masking nontumor regions with physiologically high uptake of TYR (e.g., salivary glands), spillover from these regions to the average tumor time–activity curve was prevented.
SUVs.
All SUVs were calculated from the summed data obtained from the last 3 frames (20–50 min after injection). Average SUVs were calculated by dividing tissue activity (MBq/mL) by the injected dose (MBq) that was based on the BW (SUVBW), BSA (SUVBSA), LBM (SUVLBM), or QI (SUVQI). The emperic equations are described below:
 BSA was substituted for patient weight in the formula for SUV, yielding BSA–corrected SUV (SUVBSA):
 BSA was calculated by the formula of Mosteller (10):
 LBM–corrected SUV (SUVLBM) was substituted for patient weight in kilograms in the formula for SUV, yielding:
 The formula of Zasadny and Wahl (3) was used to calculate the LBM:
 QI) or body mass index (BMI) was calculated for each patient with the following formula (11):
 The equation of the QI–corrected SUV (SUVQI) follows:

Statistical Analysis
Correlation coefficients between SUVs and the PSR were calculated using the 2-tailed Pearson test. The Wilcoxon test was used to compare the PSR in tumor tissue to nontumor (background) tissue. P < 0.05 was considered to be statistically significant.
RESULTS
Patients
Twenty-four patients with clinically and histologically proven squamous cell carcinoma of the larynx (1 woman, 23 men; age range, 49–85 y; median age, 61 y) participated in this study. Tumor classification of the included subjects was 12.5% T1, 66.7% T2, 8.3% T3, and 12.5% T4. Three patients had lymph node metastases (2 N2 and 1 N1). Patient and tumor characteristics are given in Table 1. Plasma tyrosine levels of all patients (range, 32–80 nmol/L) were within normal ranges.
Patient Characteristics, TNM Stage, and TYR PET Data
Quantitative Analysis
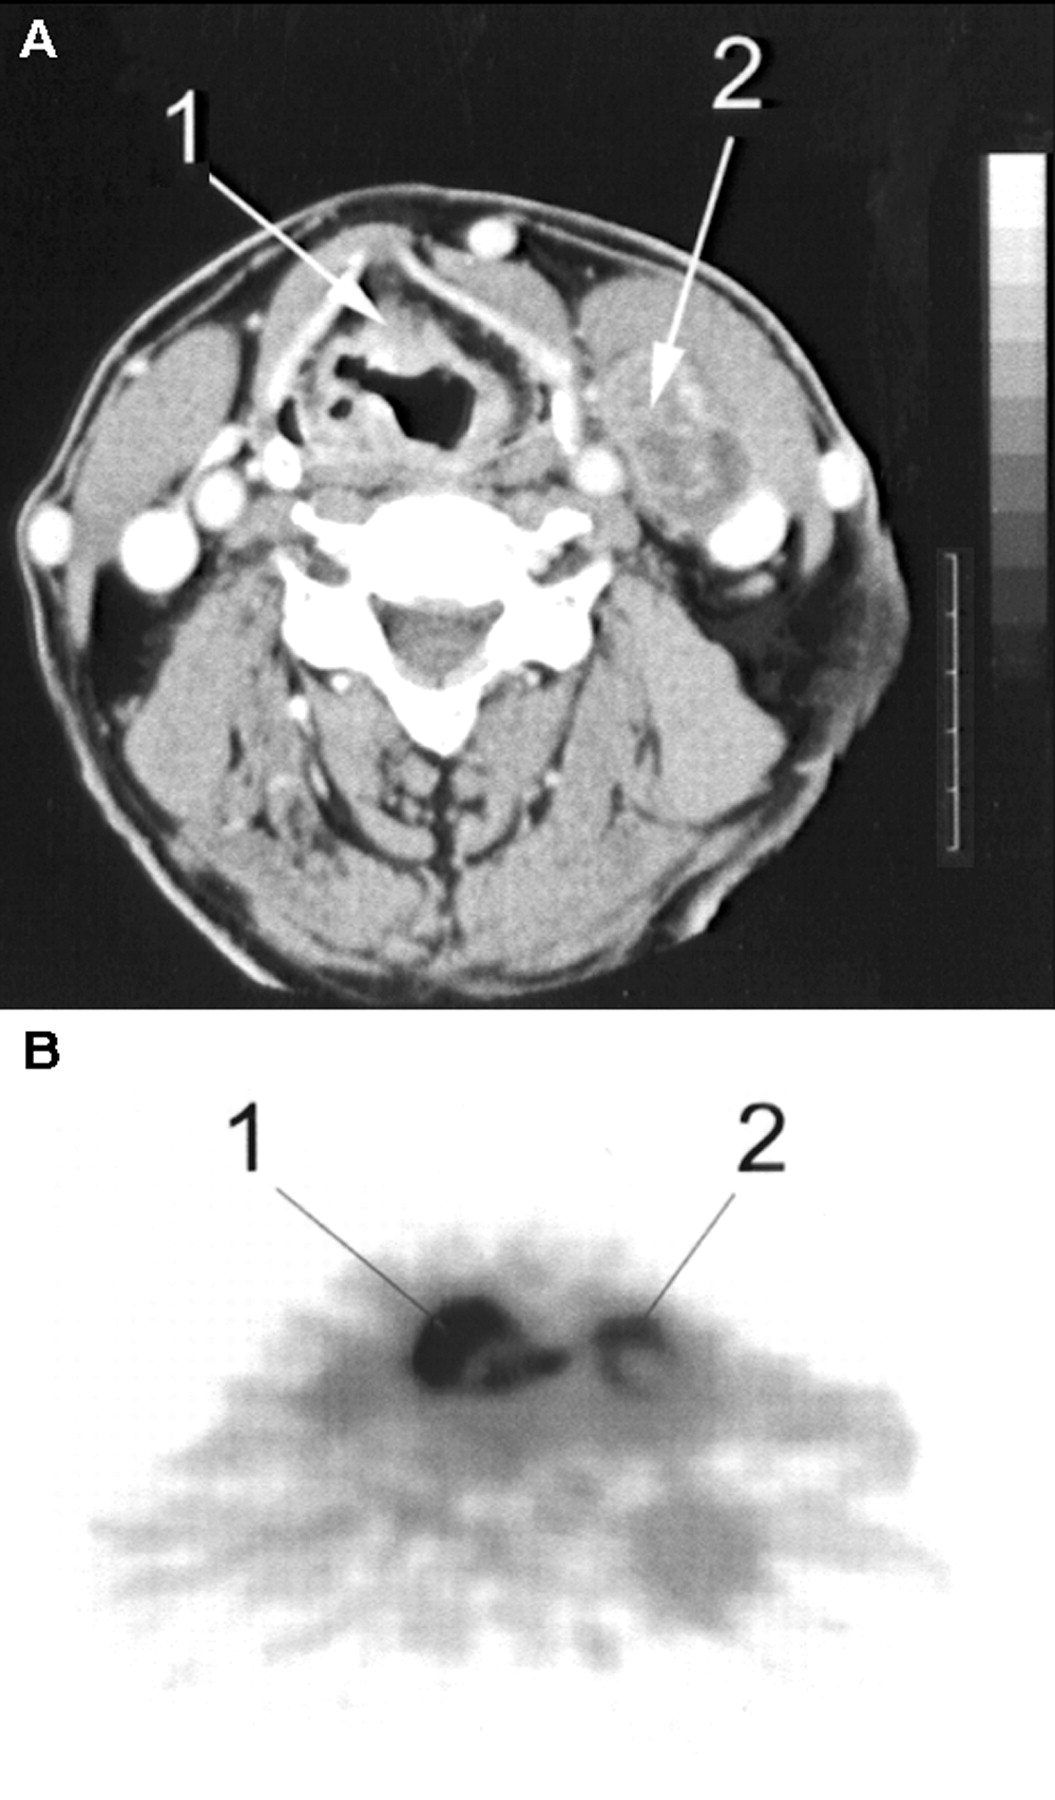
The behavior of TYR (time–activity curves and metabolism) in squamous cell carcinomas of the larynx was consistent with previously published results (7). In particular, SUV values changed very little over the 20- to 50-min period after injection. All malignant tumors, including the 3 metastases, were clearly visualized with TYR PET (Fig. 1). Quantitative values of the PSR and the SUVs are listed in Table 1. The median PSR was 1.64 nmol/mL/min (range, 0.72–4.16 nmol/mL/min) for the malignant tumors and differed significantly (P < 0.001) from the PSR of nontumor (background) tissue (median, 0.48 nmol/mL/min; range, 0.22–0.77 nmol/mL/min). The median SUVBW, SUVBSA, SUVLBM, and SUVQI of tumor tissue were 4.04 (range, 1.42–7.34), 1.02 (range, 0.44–1.95), 2.87 (range, 1.31–5.52), and 1.39 (range, 0.52–2.67), respectively.

Transaxial CT (A) and TYR PET (B) scans of T2 N2 M0 supraglottic laryngeal carcinoma (patient 13). Tumor (1) and metastatic lymph node (2) are clearly visualized. Note relatively low uptake of TYR in central necrosis of lymph node.
Significant correlations (P < 0.001; 2-tailed Pearson test) were observed between the PSR and SUV corrected for BW (r = 0.87), BSA (r = 0.87), LBM (r = 0.90), and QI (r = 0.84). Figure 2 shows the linear curve fits for the relationship between the PSR and the SUVs.
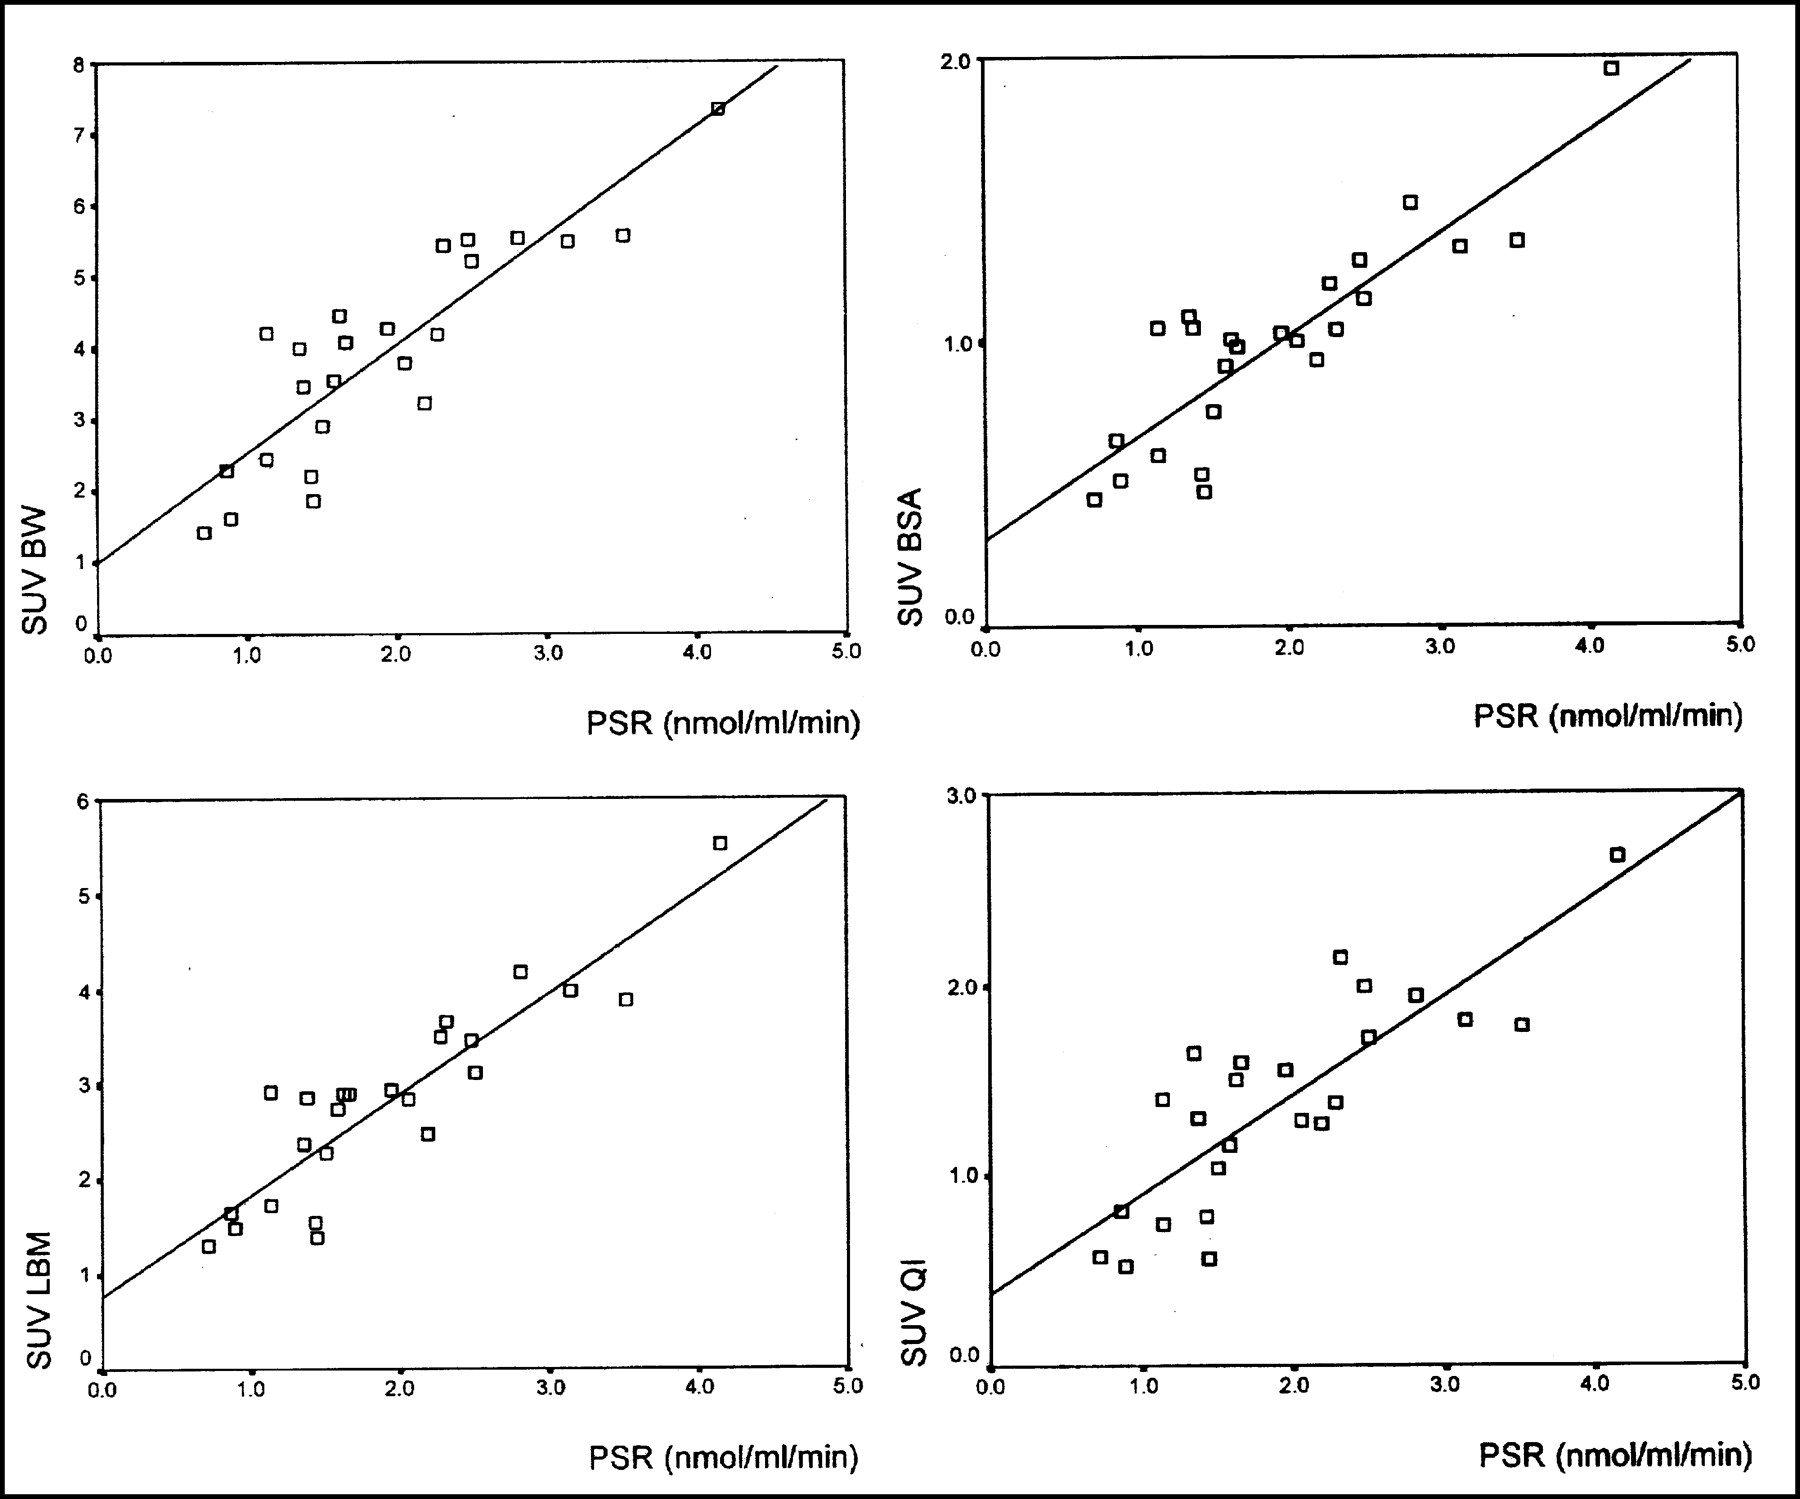
Linear curve fits for relationship between PSR and SUVBW, SUVBSA, SUVLBM, and SUVQI. Significant correlations (P > 0.001; 2-tailed Pearson test) were observed between PSR and SUV corrected for BW (r = 0.87), BSA (r = 0.87), LBM (r = 0.90), and QI (r = 0.84).
DISCUSSION
Quantification of in vivo metabolic and pathophysiologic processes is an important feature of oncologic PET and is commonly used to differentiate between malignant and benign lesions and to assess the efficacy of therapy. Most clinical PET studies are performed with 18F-FDG, the application of which is based on the increased glucose uptake in tumor cells due to increased glycolysis (12). 18F-FDG PET has proven to be a sensitive method for detection of a variety of malignancies (13), including head and neck tumors (14,15). However, uptake of 18F-FDG is not tumor specific, and accumulation of 18F-FDG in inflammatory tissue before or after therapy may cause problems in differentiation with viable tumor tissue (16).
To provide an alternative to this, radiopharmaceuticals for imaging other metabolic processes have been developed. During the proliferation of malignant cells, increased amino acid metabolism is demonstrated because of a changed permeability of the tumor membrane, increased amino acid transport, and high protein synthesis (PSR) (17). Mainly l-methyl-11C-methionine (MET) and TYR have been studied clinically for reasons of the ease of synthesis, biodistribution, and formation of radiolabeled metabolites in vivo. More recently, artificial amino acids such as l-3-18F-fluoro-α-methyl-tyrosine and O-2-18F-fluoroethyl-l-tyrosine for PET and l-3-123I-iodo-α-methyltyrosine for SPECT have been studied (17,18). The most frequently used amino acid tracer in clinical PET is MET and the clinical applications of MET have been thoroughly investigated in a variety of tumors (19). Lindholm et al. (20) studied head and neck cancer with MET PET and found good uptake of MET, resulting in high sensitivities. Quantification studies using MET have been performed, but the complicated metabolism of methionine has made it impossible to construct a precise metabolic model. MET is involved in several metabolic pathways, such as transmethylation and polyamine synthesis, and is converted to S-adenosylmethionine, which may lead to the accumulation of nonprotein metabolites in tumor tissue (17,21). Although correlations between the influx constant (Ki), as determined by the Patlak model (22), and the SUV were significant (r = 0.84–0.90), the PSR cannot be measured with MET and PET.
Carboxyl-labeled amino acids, such as TYR, appear to be more appropriate compounds to determine protein synthesis activity in tumor tissue (23). In our study, laryngeal squamous cell carcinoma could be adequately visualized by TYR, thereby confirming results in other types of malignancy imaged with the same tracer (24). The PSR of all tumors was significantly higher than the background PSR. Absolute quantification is the most precise method to analyze tumor metabolism; however, the disadvantages are that a prolonged dynamic PET study to calculate a time–activity curve and arterial cannulation with repeated blood sampling to obtain the plasma input function are required. In a search for less constraining methods, Kole et al. (24) found good correlations (r = 0.83–0.94) when comparing the SUV and PSR methods in breast cancer patients using TYR PET. However, in a study on various tumor types they found only weak correlations (r = 0.76) between the PSR and the SUV (23). Consequently, correlations appear to differ between various types of tumors; thus, correlations between the PSR and the SUV may have to be established in every different tumor type. The simplicity of the SUV approach, the absence of cannulation with repeated blood sampling, and the shorter data acquisition time make it an attractive method for routine clinical use. However, Hamberg et al. (1) and Keyes (2) have described important factors that can cause wide variability in the SUV using 18F-FDG PET that cannot be controlled and have not been considered in most reported studies. These factors may also influence the SUV in TYR PET studies.
The first source of variability is body composition and habitus because conventional SUV normalizes for body weight. In our experience we found a much lower uptake of TYR in fat tissue compared with that of other tissues; therefore, differences in body composition are a source of variability between patients (25). Corrections for this effect have been proposed (3,4) and were performed in this study by calculating SUVs based on BSA, LBM, and QI. In this study the results showed good correlations between the SUVs and the quantitative values (PSR). No significant differences were found between the correlations of the 3 calculated SUVs (SUVBW, SUVBSA, and SUVLBM) and the PSR; however, a slightly higher correlation coefficient of SUVLBM makes this method preferable, which is in accordance with the findings of Kole et al. (25). Correction of the SUV by the QI was introduced because the QI is widely used for assessment of obesity or cachexia (26) and can be calculated relatively simply in comparison with the LBM formula. Although the correlation between the PSR and the SUVQI was good (r = 0.84), the SUV based on the QI did not prove to be a more reliable measure of tumor metabolic activity than the SUVLBM.
Keyes (2) also stated that, because of recovery coefficients and partial-volume effects, the SUV method would not be suitable for tumors smaller than twice the resolution of the imaging system, which means smaller than approximately 2 cm in diameter. Although the T1 lesions in our study were <2 cm in diameter, correlations between the SUVs and the PSR values did not change by inclusion of T1 lesions. Placement and calculation of an ROI would appear to be another factor influencing the SUV. Kessler et al. (27) emphasized that placing a large ROI around an object and averaging the counts within the region change the measured value because counts from the edge of the object are reduced because of spillover from surrounding tissues. They stated that the ROI method should only be used to calculate the maximum pixel value within an ROI. However, the absolute maximum pixel value (single pixel) may be unreliable because of statistical variation of the value of a single pixel. To assess a balance between the signal-to-noise ratio and an unbiased estimation of the present activity, we determined average pixel values in the ROI with the most intense TYR uptake in the tumor using a 70% threshold.
Another major effect on the SUV was mentioned by Lindholm et al. (28). When using 18F-FDG PET, the plasma glucose level at the time of the study influences the quantitative values. Although most patients are studied in the fasting state, uncorrected intrasubject and intersubject variations in plasma glucose levels can have highly significant effects on measured SUVs. The influence of plasma amino acid levels on the quantitative values would appear to be less important, as described by Kole et al. (25) for TYR and Lindholm et al. (29) for MET.
According to Fischman and Alpert (30), a major problem using the SUV in 18F-FDG PET is that the uptake of 18F-FDG in tissues generally does not reach a plateau within 90 min after injection. Scans obtained at usual imaging times of 45–60 min after injection are subject to great variability. Standardization of the time between tracer administration and data acquisition could reduce the variability. However, with TYR this problem is avoided because TYR uptake reaches a relative plateau after 20 min and the SUV measurement can be performed earlier.
Recently, Huang (31) discussed the variability of the SUV and mentioned the assumptions and approximations on which the validity of the SUV is dependent. Stability of the lumped constant (LC), an indicator of the difference in uptake efficiency of the cell between the tracer and its nonradiolabeled counterpart, is such an important assumption in the model of Sokoloff et al. (32). Because 18F-FDG uptake goes through 2 limiting steps and the uptake efficiency between 18F-FDG and glucose is different, the stability of the LC may be questionable. When using 11C-labeled amino acids as the tumor tracer, no variability in LC will occur because the used tracers and their nonradiolabeled counterparts are chemically identical and their uptake will not be different.
Although the number of subjects included in this study is limited, the absence of major drawbacks of the SUV calculations with TYR and the strong correlations between the SUVs and the PSR values observed offer the possibility of using noninvasive TYR PET for detection of primary laryngeal carcinoma. With the SUV method, the plasma input function and, therefore, arterial cannulation are not required, scanning time can be reduced, and less elaborate calculations are required. For clinical use of TYR PET a short acquisition time is preferable and this may become possible by the application of SUV determination. Although the optimal time point for SUV measurement depends on the technical aspects of the PET camera and the reconstruction software, in our experience, a 10-min static scan starting 20 min after TYR injection is sufficient. Whether the noninvasive method is as equally objective as the absolute quantification method to monitor the effect of treatment and to compare intrasubject and intersubject values is currently under investigation.
CONCLUSION
High correlations (r = 0.84–0.90) were found between the PSR values and the SUVs for laryngeal squamous cell carcinoma using dynamic TYR PET. The best correlation coefficient was observed for the relationship between the PSR and the SUVLBM. Clinical application of noninvasive TYR PET is feasible in primary head and neck tumors, and determination of the SUV is a reliable method for quantification of the metabolic activity of a tumor.
Footnotes
Received May 28, 2002; revision accepted Sep. 25, 2002.
For correspondence or reprints contact: Jurjan R. de Boer, MD, Departments of Otorhinolaryngology and Head and Neck Surgery, Groningen University Hospital, Hanzeplein 1, 9700 RB Groningen, The Netherlands.
E-mail: j.r.de.boer{at}kno.azg.nl


