


Abstract
It is unknown whether the use of ordered-subsets expectation maximization (OSEM) and depth-dependent resolution recovery (RR) will increase the accuracy of 201Tl electrocardiogram-gated SPECT (GSPECT) for the measurement of global left ventricular (LV) function. Methods: Fifty-six patients having both rest 201Tl GSPECT and planar equilibrium radionuclide angiography (planarRNA) on the same day were studied. Twenty-nine patients also had LV conventional contrast angiography (Rx). LV ejection fraction (LVEF), end-diastolic volume (EDV), and end-systolic volume (ESV) were calculated with the quantitative gated SPECT software (QGS) using 4 different processing methods: filtered backprojection (FBP), OSEM, RR + FBP, and RR + OSEM. LVEF calculated with planarRNA and LV EDV and ESV calculated with Rx were considered gold standards. LVEF and volumes provided with the GSPECT methods were compared with the gold standard methods. Results: LVEF calculated with GSPECT methods (FBP, OSEM, RR + FBP, and RR + OSEM) were similar (not statistically significant) and correlated well with planarRNA. On Bland-Altman analysis, the mean ± SD of absolute difference in LVEF with GSPECT FBP, OSEM, RR + FBP, and RR + OSEM methods versus planarRNA were similar, with relatively large limits of agreement. LV volumes calculated with the 4 GSPECT methods were significantly lower but correlated well with Rx LV volumes. LV volumes calculated with FBP and OSEM were lower than those calculated with RR + FBP and RR + OSEM (P < 0.01). On Bland-Altman analysis, the mean ± SD of absolute difference in LV volumes with FBP, OSEM, RR + FBP, and RR + OSEM versus Rx was, respectively, 56 ± 45 mL (P < 0.01 vs. the other 3 methods), 57 ± 45 mL (P < 0.01 vs. the other 3 methods), 43 ± 48 mL, and 46 ± 47 mL, with correspondingly large limits of agreement. The variance of random error did not differ between FBP, OSEM, RR + FBP, and RR + OSEM for either LVEF or volumes. Conclusion: OSEM and FBP presented similar accuracy for LVEF and volume measured with the QGS software. Their combination with depth-dependent RR provided similar LVEF but more accurate LV volumes.
- left ventricular function
- depth-dependent resolution recovery
- iterative reconstruction
- 201Tl
- gated SPECT
Coupling of left ventricular (LV) myocardial perfusion to function in a single-injection, single-acquisition study with electrocardiogram-gated SPECT (GSPECT) is an important achievement of nuclear cardiology and has been validated with both 99mTc-labeled and 201Tl myocardial perfusion tracers. In contrast to high-anatomic-resolution imaging modalities such as echocardiography, ultrafast CT, and MRI, which determine systolic function from direct accurate distance measurement, GSPECT provides information on systolic function from low-spatial-resolution studies. Despite this limitation, several studies have reported a good correlation between LV function measured with 201Tl myocardial perfusion GSPECT and other imaging modalities, with good interobserver and intraobserver reproducibility (1–6).
Naturally, as previously reported for SPECT myocardial perfusion studies, LV functional parameters derived from GSPECT similarly face different degrading factors more or less inherent to the SPECT technique, including deterioration of depth-dependent collimator resolution, the partial-volume effect, scatter, and attenuation. These derived LV functional parameters may also well be influenced by the accuracy of the applied reconstruction methods, that is, filtered backprojection (FBP) versus ordered-subsets expectation maximization (OSEM).
The recent availability of more accurate iterative reconstruction methods, including OSEM, for clinical use raises the question of whether such methods, compared with the traditionally used FBP, will translate into more accurate measurement of LV function with myocardial perfusion GSPECT. Of note, the superiority of iterative reconstruction, compared with FBP, for the diagnosis of coronary artery disease with myocardial perfusion studies is still a matter of debate. Gilland et al. reported a similar diagnostic accuracy for iterative reconstruction (with and without nonuniform attenuation correction) and uncorrected FBP in the diagnosis of coronary artery disease, whereas Ficaro et al. and LaCroix et al. reported a better diagnostic accuracy with iterative reconstruction (but with the confounding effect of a simultaneously combined nonuniform attenuation correction), compared with uncorrected FBP (7–9).
Moreover, depth-dependent resolution recovery (RR) with SPECT has been developed, and its positive impact on resolution has been reported (10,11). However, its impact on measurement of LV function with myocardial perfusion GSPECT has not been described.
We evaluated whether using OSEM, as opposed to FBP or the combination of either with depth-dependent RR, improves the accuracy of measuring global LV function, including LV ejection fraction (LVEF) and LV volumes, with 201Tl myocardial perfusion GSPECT.
MATERIALS AND METHODS
Patient Population
The population included 56 patients undergoing both rest 201Tl SPECT imaging and planar equilibrium radionuclide angiography (planarRNA) on the same day. Twenty-nine patients also underwent LV conventional contrast angiography (Rx) within 1 wk (mean ± SD, 1 ± 3 d) of SPECT, without any intervening cardiac event or modification of therapy between the 2 studies. Mean age was 60 ± 16 y, and 43 of 56 patients (77%) were male. Forty-one patients (73%) were known to have previously experienced a myocardial infarction (anterior in 16 patients). Patients were excluded if they had frequent arrhythmias, an acute cardiac event, or hemodynamic instability.
GSPECT Acquisition
GSPECT acquisitions began 15 min after injection of 201Tl (111–148 MBq, with dose variation based on patient weight) into resting patients. All studies were acquired on a 90° dual-head camera (Vision POWERstation, release 5.0.0; General Electric Medical Systems, Buc, France) equipped with low-energy, high-resolution parallel-hole collimators. Images were acquired using a step-and-shoot body contour mode over a 180° arc, starting at the 45° right anterior oblique projection and ending at the 45° left posterior oblique projection, for a total of 32 projections at 90 s per projection. One energy window was used—a 30% window centered on the 70-keV peak. Images were gated at 8 frames per cardiac cycle using an R-wave trigger with an acceptance window of 20%. All projection images were acquired into 64 × 64 image matrices with a 1.3 acquisition zoom (pixel size, 6.77 × 6.77 mm), were corrected for nonuniformity and center of rotation, and were quality-controlled for patient movement.
PlanarRNA Acquisition
Immediately after the 4-h redistribution myocardial perfusion SPECT study, red blood cells were labeled in vivo with 1,110 MBq (30 mCi) of 99mTc, and planarRNA was performed. All acquisitions were on a dual-head gamma camera (DST-XL; General Electric Medical Systems) using a low-energy, high-resolution parallel-hole collimator.
Conventional planarRNA studies were realized in the best septal left anterior oblique projection with a caudal tilt for 400 kcts per frame, 16 frames per cardiac cycle, a 64 × 64 matrix, a ±10% R-R acceptance window, image magnification of 2.67 (pixel size, 3.38 mm), and an energy window of 20% centered over the 140-keV photopeak.
GSPECT Reconstruction
GSPECT studies were processed on the Vision POWERstation. Reconstruction of GSPECT was done both with and without depth-dependent RR, using Restore software (General Electric Medical Systems). It corrects for depth-dependant blurring and suppresses noise in GSPECT acquisitions. The known distance (depth) between each row in a backprojection and the surface of the detector allows the application of a depth-dependent restoration filter. Restore software computes this filter. Each filter consists of 2 components: an RR component modeled as the inverse of the modulation transfer function at low to intermediate spatial frequencies, and a noise suppression component modeled as a Butterworth roll-off at intermediate to high spatial frequencies. The combined filter is therefore analogous in shape to a Wiener filter. Thus, the depth-dependent resolution of the collimator is compensated for by an inverted-filter method that takes into consideration source-to-detector distance, collimator resolution, and intrinsic detector resolution (11–13). The source-to-detector distance is the sum of the distance between the collimator surface and the number of rows to the edge of the imaging field of view. The operator-software interface is represented in Figure 1. The software integrates different parameters: hole diameter and length of the collimator, system intrinsic resolution, distance to field of view, roll-off boost point, roll-off frequency slider, and Butterworth order. The roll-off boost slider determines the maximum gain at which the Restore filter changes from inverse to low-pass filtering. The roll-off frequency slider determines the shape of the high-frequency portion of the Restore filter. The Butterworth order slider determines the shape of the low-pass portion of the Restore filter.
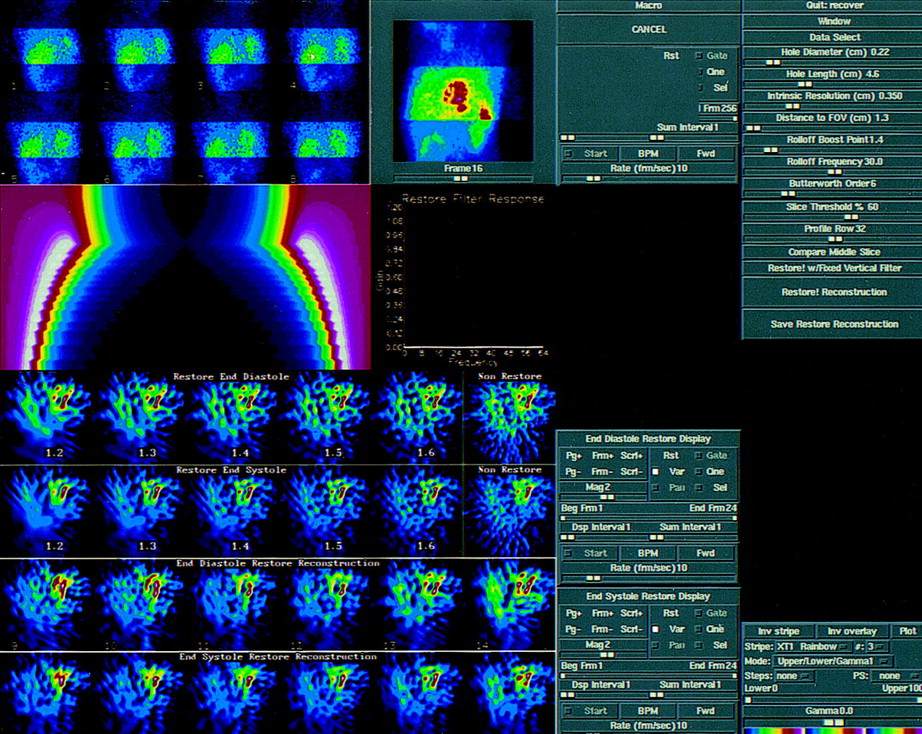
Illustration of operator-RESTORE software interface. Various parameters are integrated in this depth-dependent RR processing software: hole diameter and length of collimator, intrinsic resolution, distance to field of view, roll-off boost point, roll-off frequency slider, and Butterworth order.
Two different reconstruction methods were used: FBP and OSEM. The summed rest score for the 15-min GSPECT summed studies was calculated visually on the FBP reconstructed studies by segmenting the LV into 20 segments and using a 5-point scoring system for 201Tl uptake (0 = normal, 1 = mild reduction, 2 = moderate reduction, 3 = severe reduction, and 4 = absent).
FBP reconstruction was performed using a Butterworth filter (order, 5; cutoff frequency, 0.25 cycle per pixel). FBP in conjunction with a ramp filter was used to reconstruct the transaxial tomograms and then reoriented into short-axis images perpendicular to the long axis of the LV. OSEM reconstruction was done with the OSEM software of the Vision POWERstation (14). The number of subsets and number of iterations were 8 and 2, respectively. The datasets were filtered after reconstruction using a Butterworth filter (order, 5; cutoff frequency, 0.25 cycle per pixel). Briefly, OSEM is a procedure that successively improves the estimated solution (i.e., transaxial data). OSEM begins with an initial guess of the solution and then calculates the projection data that would be expected from that solution. The ratio of the measured values to those calculated is then reconstructed to make a set of correction factors. The correction factors modify the earlier solution to produce an improved solution. OSEM uses a subset of projections in each iteration (instead of all projections simultaneously), progressively using a different subset in each subiteration. The subsets are ordered so as to provide maximum new information for each subiteration by maximally separating the projections in each subset. The rate of convergence is almost identical to that using all projections simultaneously for a similar number of iterations, so that the overall speed of reconstruction is significantly greater with OSEM than with maximum-likelihood expectation maximization. When the number of subsets is greater than 1, as in our study, the solution will be close to but not an exact maximum-likelihood expectation maximization reconstruction; it will be an OSEM reconstruction.
GSPECT LVEF and LV Volumes
LVEF was calculated from both FBP- and OSEM-reconstructed GSPECT studies either with or without distance-dependent RR, using a previously validated and commercially available automated program (quantitative gated SPECT [QGS]; Cedars-Sinai Medical Center, Los Angeles, CA). Briefly, this software uses gated reconstructed short-axis images and works in 3-dimensional space. It defines the LV volume automatically over the different intervals of the acquired cardiac cycle. Count profiles normal to and extending 20 mm in both directions from the midmyocardial surface are extracted for each interval. An asymmetric gaussian is fitted to each count profile, and the inner and outer SDs (SDin) of the gaussian are noted. The endocardial LV border is defined as points lying at 65% of SDin of count profiles from the midmyocardial surface along its normal. To correct for the partial-volume effect, the effect of background activity, and other sources of error, the endocardial and epicardial surfaces obtained for all intervals but end-diastole are further refined by imposing the anatomic constraint of the constant myocardial volume throughout the cardiac cycle. LV end-diastolic volume (EDV) and end-systolic volume (ESV) are generated and are used to calculate global LVEF (1).
PlanarRNA LVEF
PlanarRNA studies were processed on a dedicated computer (NXT; General Electric Medical Systems). These data were first reframed into 8 frames per cardiac cycle, and then LVEF was calculated with a previously validated algorithm included in the standard software package. End-diastolic and end-systolic regions of interest were computed automatically but could be partially or totally redrawn manually with the help of phase, amplitude, and Laplacian functional images (15).
Rx LV Volumes
LV EDV and ESV were calculated by a single observer with Rx using the single-plane area-length Sandler-Dodge method in the 30° right anterior oblique projection, as previously validated (16). After normalization for magnification, the following ventriculogram correction factor was applied: V = 0.693 × V′ + 8.65, where V is the corrected volume and V′ is the measured LV volume as calculated with the single-plane Sandler-Dodge method. End-diastolic and end-systolic projections were obtained by selecting the largest and smallest contours, respectively. Ventriculograms were traced manually, taking care to avoid postectopic beats.
Statistical Analysis
Statistical analysis was performed with StatView software (version 5.0; SAS Institute Inc., Cary, NC). Categoric data were reported as percentages, and continuous data were reported as mean ± SD. The LV EDV and ESV measurements provided by each GSPECT method were combined for LV volume analysis. The LVEF and volumes calculated with the 4 different GSPECT methods, the planarRNA method (LVEF; n = 56), and Rx (LV volumes; n = 58) were compared using the Friedman test. The paired absolute difference between 2 methods was compared with the zero value using the 1-sample t test.
Linear regression and paired absolute differences between GSPECT values and the reference methods (planarRNA for LVEF and Rx for LV volumes) were analyzed, and Bland-Altman analysis was also performed. The corresponding limits of agreement were the mean + 2 SDs of the difference and the mean − 2 SDs of the difference.
The accuracy of each method (random error [RE]) was compared after adjustment for systematic error by applying a correcting factor based on its linear regression, with planarRNA LVEF reference values and Rx LV EDV and LV ESV reference values used as the gold standards. The variances of the calculated RE were compared using the Levene test. P < 0.05 was considered significant.
RESULTS
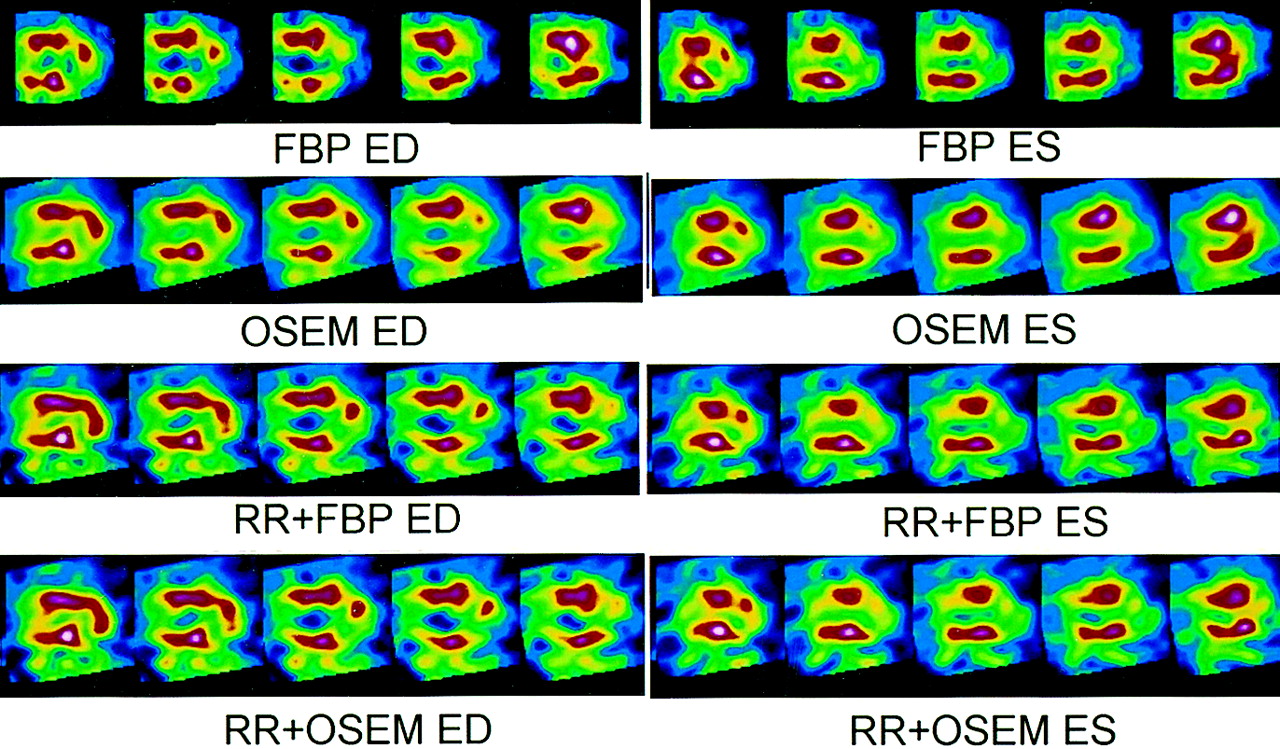
The summed rest score calculated for the rest summed GSPECT, the mean heart rate, and the systolic versus diastolic blood pressure were, respectively, 12 ± 12, 70 ± 16 bpm, and 122 ± 15 versus 71 ± 9 mm Hg. The mean heart rate and the systolic versus diastolic blood pressure at planarRNA were, respectively, 68 ± 14 bpm and 120 ± 17 versus 69 ± 11 mm Hg (not statistically significant [NS]). Figure 2 illustrates the quality of images obtained with the different GSPECT processing methods.

Illustration of GSPECT study of patient with anterior myocardial infarction. Reported are vertical long-axis slices of both end-diastolic (ED) and end-systolic (ES) segments with different processing methods.
LVEF
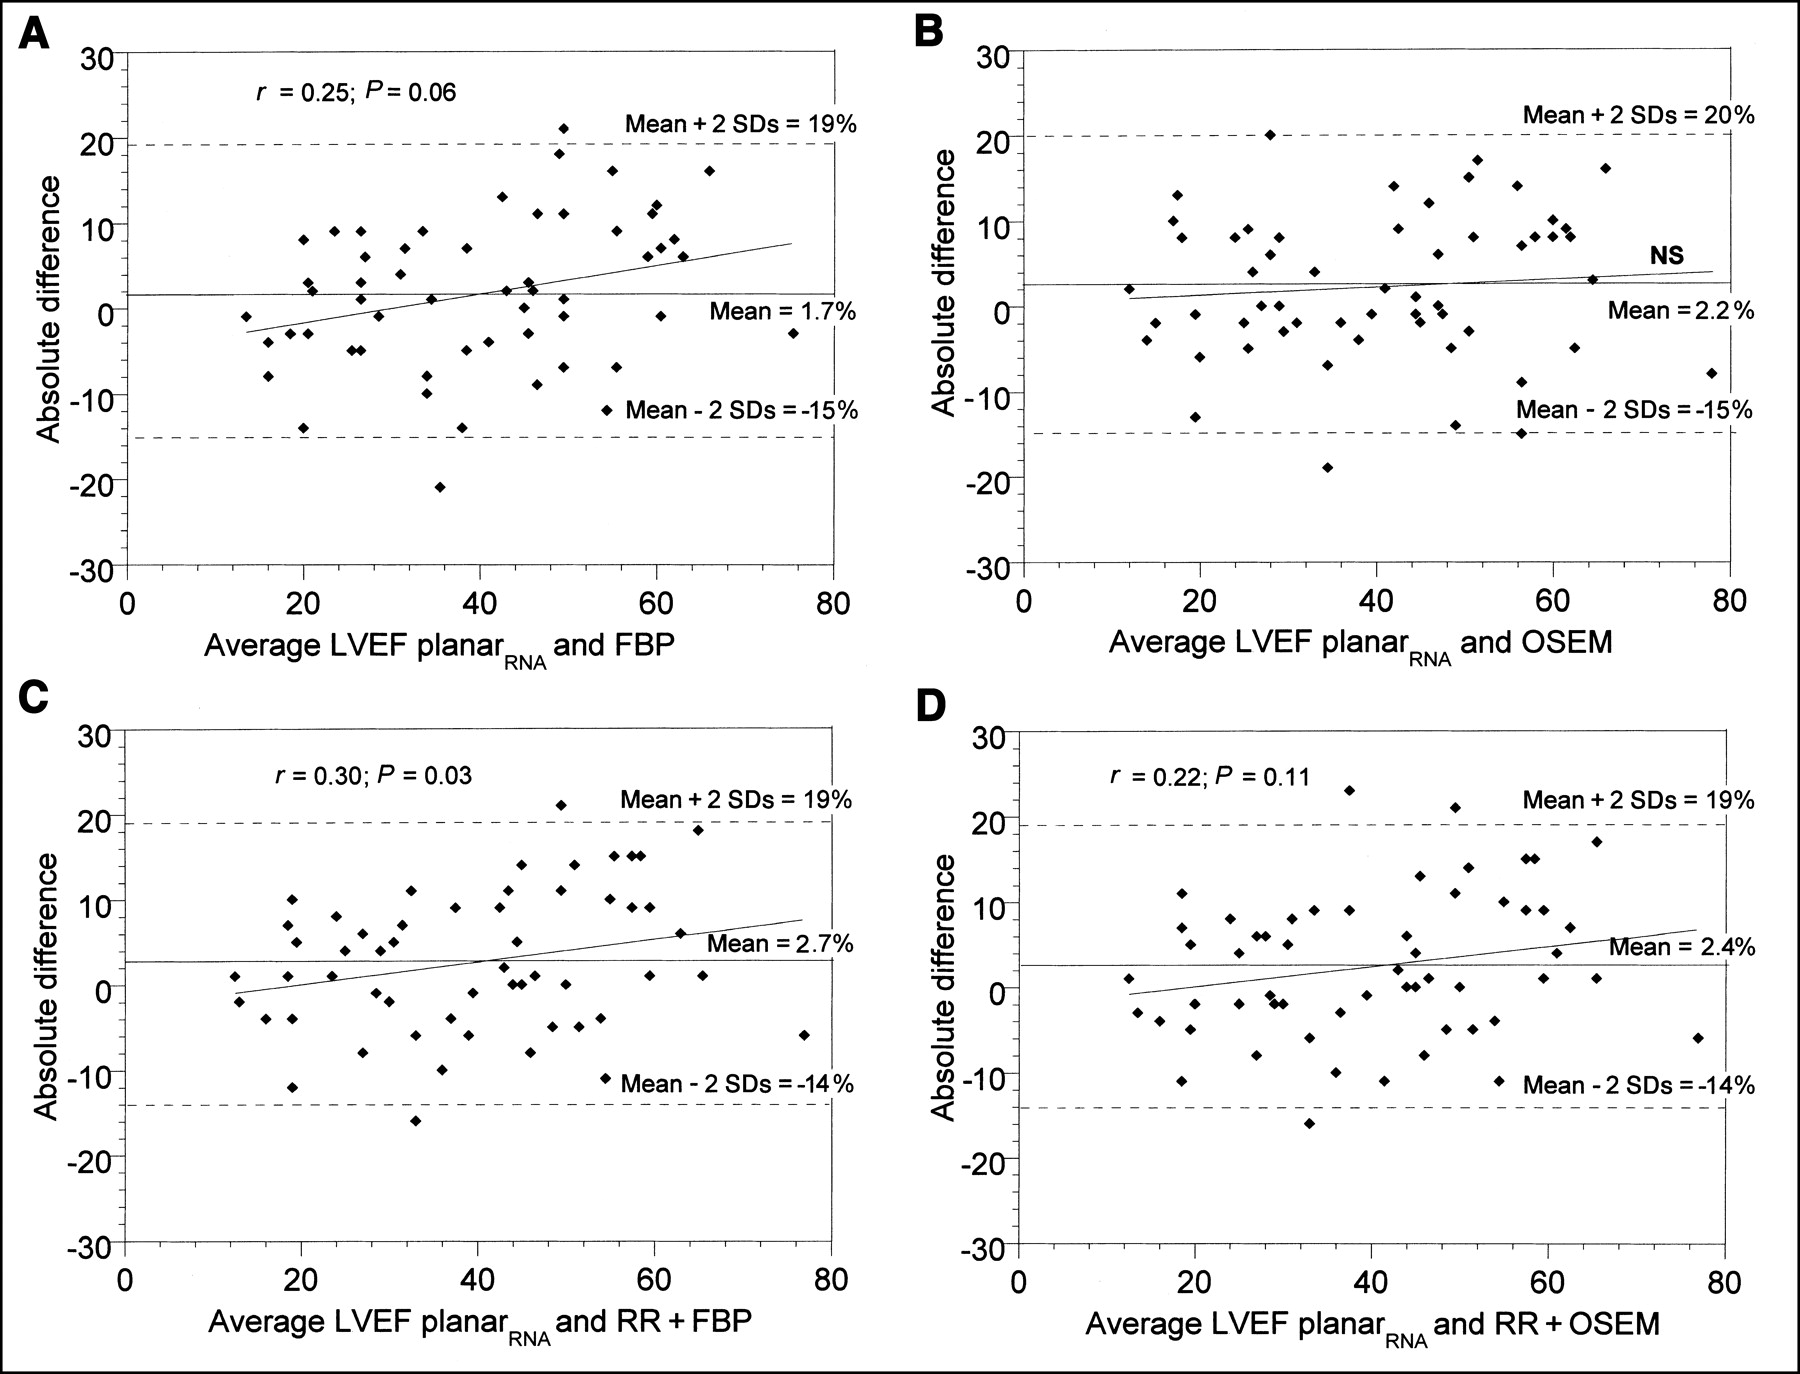
LVEF calculated with planarRNA and GSPECT methods (FBP, OSEM, RR + FBP, and RR + OSEM) were all similar (NS), and the variance of random error did not significantly differ between FBP, OSEM, RR + FBP, and RR + OSEM for LVEF (Table 1). LVEF calculated with these 4 different GSPECT methods correlated well with planarRNA LVEF values (Fig. 3; Table 2).

Linear correlation of FBP GSECT method versus planarRNA method for LVEF calculation. ser = SE of regression.
LVEF Estimated with GSPECT Reconstruction Methods vs. PlanarRNA
Linear Regression of LVEF Estimated with GSPECT Reconstruction Methods vs. PlanarRNA
On Bland-Altman analysis, the mean ± SD of the absolute difference in LVEF with GSPECT FBP, OSEM, RR + FBP, and RR + OSEM methods versus planarRNA was, respectively, 1.7% ± 8.6%, 2.2% ± 8.5%, 2.7% ± 8.2%, and 2.4% ± 8.4% (NS). Moreover, there was a weak linear correlation between the absolute difference and average values for the RR + FBP method and a tendency toward correlation for the FBP method. These linear correlations were no longer present when OSEM was used instead of FBP. The limits of agreement were relatively large for all methods (Fig. 4).

Bland-Altman analysis of the 4 different GSPECT methods (FBP, OSEM, RR + FBP, and RR + OSEM) versus planarRNA method for LVEF calculation.
There was no difference in the variance of RE between FBP, OSEM, RR + FBP, and RR + OSEM for LVEF (NS).
LV Volumes
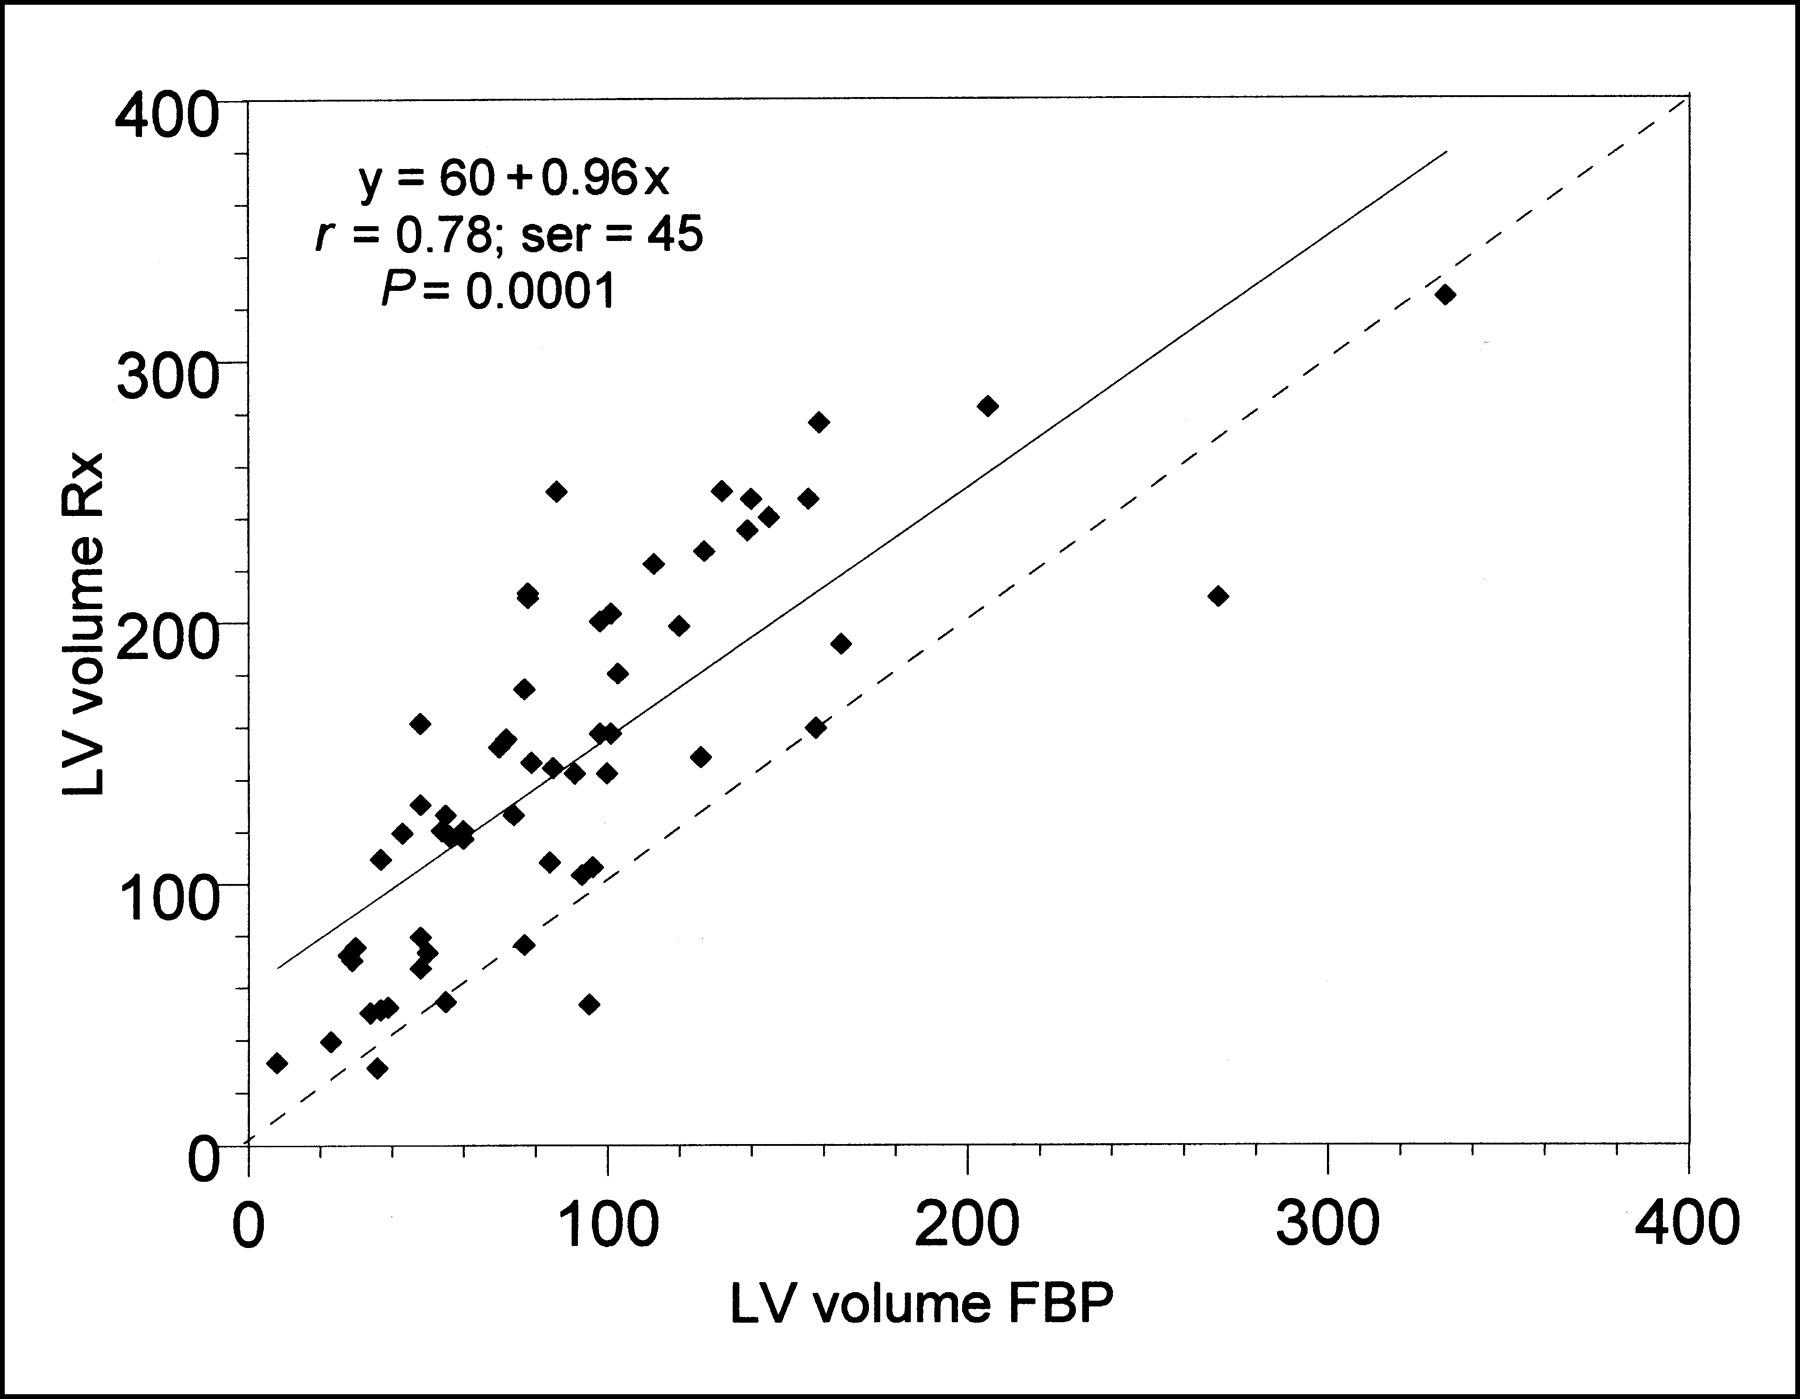
LV volumes calculated with FBP, OSEM, RR + FBP, and RR + OSEM were significantly lower than their corresponding Rx values (Table 3). LV volumes calculated with FBP and OSEM were similar (NS) and were lower than volumes calculated with RR + FBP and RR + OSEM (P < 0.01). Moreover, volumes calculated with RR + FBP and RR + OSEM were similar (NS). Independent of the method of GSPECT reconstruction, LV volumes correlated well with Rx volumes (Fig. 5; Table 4).

Linear correlation of FBP GSPECT method versus Rx for LV volume calculation. Volumes are expressed in milliliters. ser = SE of regression.
LV Volumes Estimated with GSPECT Reconstruction Methods vs. Rx
Linear Regression of LV Volumes (EDV + ESV) Estimated with GSPECT Reconstruction Methods vs. Rx
On Bland-Altman analysis, the mean ± SD of the absolute difference in LV volumes with GSPECT FBP, OSEM, RR + FBP, and RR + OSEM methods versus Rx were, respectively, 56 ± 45 mL (P < 0.01 vs. the other methods), 57 ± 45 mL (P < 0.01 vs. the other methods), 43 ± 48 mL, and 46 ± 47 mL. Moreover, a weak but significant linear correlation existed between the absolute difference and the average values for both the FBP method and the OSEM method. This linear correlation was no longer present when RR was combined with either FBP reconstruction or OSEM reconstruction. The limits of agreement were relatively large for all methods (Fig. 6).
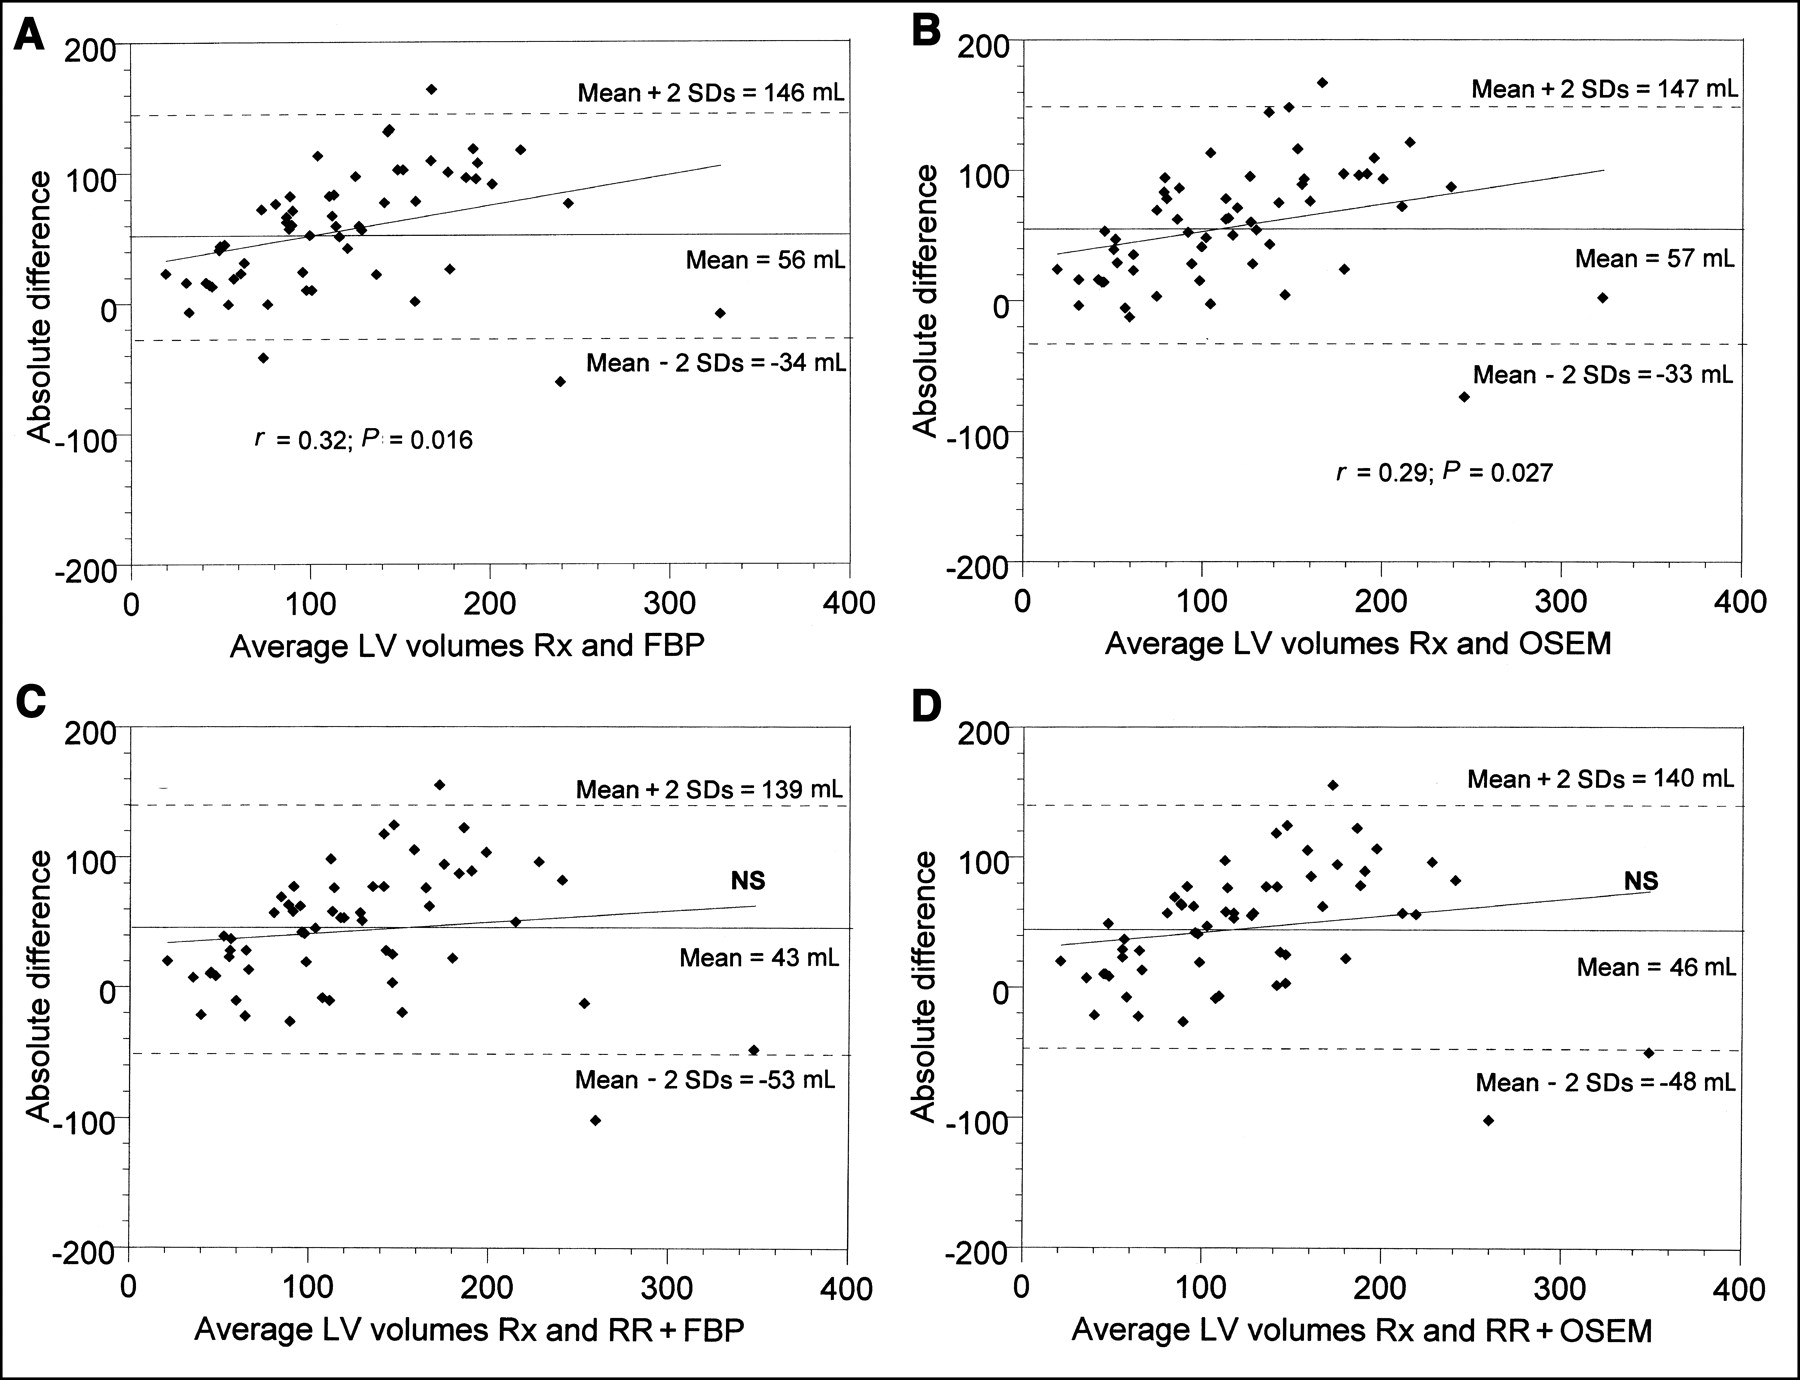
Bland-Altman analysis of the 4 different GSPECT methods (FBP, OSEM, RR + FBP, and RR + OSEM) versus Rx for LV volume calculation. Volumes are expressed in milliliters.
There was no difference in the variance of RE between FBP, OSEM, RR + FBP, and RR + OSEM for LV volumes (NS).
DISCUSSION
In our study, FBP and OSEM reconstruction provided similar LVEF and LV volumes with the QGS software. The combination of depth-dependent RR with either FBP or OSEM reconstruction provided higher LV volumes, further increasing agreement with the measured Rx LV volumes, but similar LVEF. When we corrected for systematic error by accounting for linear regressions, the 4 GSPECT reconstruction methods were similarly accurate for both LVEF and volume measurements as reflected by their RE.
With SPECT imaging, the coupling of function to myocardial perfusion is of major interest. Naturally, as previously reported for perfusion parameters, the derived functional parameters similarly face different degrading factors more or less inherent to the SPECT technique, including deterioration of depth-dependent resolution, the partial-volume effect, scatter, and attenuation. These derived functional parameters may well also be influenced by the accuracy of the reconstruction methods, that is, FBP versus OSEM. The effects on global LV functional parameters of correcting for these different factors have not been studied.
In our study, we evaluated the impact on LVEF and volumes measured with QGS of using an iterative reconstruction method against traditional FBP reconstruction and of correcting for depth-dependent resolution. These 2 methods are expected to be most useful in, respectively, studies with low count statistics and studies with tracers presenting lower resolution, as encountered in 201Tl studies, as compared with 99mTc-labeled GSPECT myocardial perfusion. Despite the better imaging and radiation dosimetry characteristics of the latter, 201Tl remains the preferred tracer for myocardial viability SPECT studies because of its redistribution characteristics. Moreover, the use of 201Tl for myocardial viability allowed us to study LV function in our patients with planarRNA on the same day.
Because of technical developments, iterative reconstruction has become a clinically practical alternative to FBP. Iterative reconstruction techniques, including fast OSEM, are interesting because they allow more accurate modeling of the imaging system by including such elements as the positivity constraints on the reconstruction and the Poisson redistribution of the projection data. Moreover, iterative reconstruction has improved noise properties over FBP, such as reduced noise correlation length at low numbers of iterations (17–19). Thus, OSEM produces less contamination of high-count noise into low-count regions, potentially improving structure detection. This is precisely the situation one may encounter with myocardial perfusion imaging because of the presence of myocardial perfusion defects in patients with previous myocardial infarction and the variably high subdiaphragmatic uptake of the tracer. A more accurate determination of myocardial repartition of the tracer with OSEM should translate into better edge detection with the QGS software. In our study, the expected improvement between OSEM and FBP was not met for either LV volumes or LVEF, the OSEM method providing results not significantly different from those of FBP. This result may be explained by the limited increase in accuracy obtained with OSEM, compared with FBP.
The resolution of SPECT is not optimal. This factor becomes crucially important when one is imaging structures with dimensions less than the spatial resolution of the imaging system, in particular during myocardial perfusion studies, in which LV myocardial wall thickness is usually less than 20 mm. This limitation has been exploited with myocardial perfusion imaging to derive regional myocardial thickening parameters based on the count-density-thickness relationship. However, absolute values of myocardial wall thickness and thickening cannot accurately be determined. This also applies to a lesser degree for LV volume measurement, especially in small LV volumes, if 201Tl is used.
The depth dependence of resolution in SPECT results in a lower resolution for deep objects than for objects closer to the surface of the body. If this difference is accounted for and corrected, image resolution is homogenized and improved overall. As previously reported for myocardial perfusion studies, spatial resolution slightly improves through correction of scatter, attenuation, or both, whereas spatial resolution greatly improves through correction of collimator response (10,11). This improvement in resolution may explain the significant increase in LV volumes encountered in our study with depth-dependent RR. This improvement similarly affects both LV EDV and ESV, which partially cancel each other, and explains the annihilation of the positive influence of depth-dependent RR on LVEF.
Estimation of global LV function with the QGS software relies on determination of the endocardial LV border, defined as points lying at 65% of SDin of count profiles from the mid myocardial surface along its normal. Any improvement in resolution as seen in depth-dependent RR will translate into a decrease in SDin and therefore an increase in LV volumes.
In our study, we reframed the acquired planarRNA study from 16 frames to 8 frames per cardiac cycle by summing the acquired images. We then processed the latter to calculate the corresponding planarRNA LVEF and used it for comparison with the other GSPECT methods, whose images were also acquired and processed at 8 frames per cardiac cycle. It is well established that a temporal sampling of at least 16 frames per cardiac cycle is needed for accurate LVEF and volume measurement, particularly end-systolic volume. Temporal sampling below 16 frames per cardiac cycle slightly underestimates LV EDV but significantly overestimates LV ESV. The result is a significant underestimation of the derived LVEF. Comparing methods with different temporal sampling (in our study, planarRNA sampled at 16 frames per cardiac cycle and GSPECT sampled at 8 frames per cardiac cycle) will inevitably introduce further statistical noise to the results, decreasing the power of the results our study intended to demonstrate. In our study, by reframing the planarRNA to 8 frames per cardiac cycle and rendering it similar to the temporal sampling of GSPECT, we no longer were introducing additional statistical noise by comparing methods with different temporal sampling. Consequently, the presence of a smaller difference between the GSPECT methods and planarRNA was easier to demonstrate.
These results are expected to be applicable to 99mTc-labeled GSPECT myocardial perfusion studies. First, the higher counting statistics encountered with 99mTc-labeled tracers, compared with 201Tl, are expected to minimize the benefit of using OSEM rather than FBP. This benefit is already absent with 201Tl and therefore is also expected to be absent with 99mTc-labeled tracers. Second, the gain in accuracy with RR was substantial with 201Tl and is expected to also be substantial with 99mTc-labeled tracers (although to a lesser degree), despite their slightly better resolution. Future studies should address this question.
CONCLUSION
The use of OSEM iterative reconstruction, compared with FBP, did not improve the accuracy of the LVEF or volume measured with the QGS software. Combining them with depth-dependent RR provided similar LVEF values but significantly higher LV volumes that further approached those of Rx. The use of RR should be encouraged for more accurate measurement of LV function with 201Tl GSPECT.
Footnotes
Received Dec. 12, 2001; revision accepted Sep. 25, 2002.
For correspondence or reprints contact: Doumit Daou, MD, Department of Nuclear Medicine, Lariboisière University Hospital, AP-HP, 2 rue Ambroise-Paré, 75475 Paris Cedex 10, France.
E-mail: doumit.daou{at}lrb.ap-hop-paris.fr
REFERENCES
In this issue


Jump to section
Related Articles
Cited By...
- Urinary Voiding as a Tool to Reduce Radiation Exposure in the Nuclear Stress Lab
- Three-Dimensional Ordered-Subset Expectation Maximization Iterative Protocol for Evaluation of Left Ventricular Volumes and Function by Quantitative Gated SPECT: A Dynamic Phantom Study
- OSEM Reconstruction, Associated with Temporal Fourier and Depth-Dependant Resolution Recovery Filtering, Enhances Results from Sestamibi and 201Tl 16-Interval Gated SPECT