


Abstract
We proposed to train a back-propagation artificial neural network (aNN) on a cohort of surgically proven non-small cell lung cancers (NSCLCs) and compare its accuracy with that of a trained 18F-FDG PET reader. We plan to show that an aNN trained on 18F-FDG PET- and CT-derived data is more accurate in predicting the true surgicopathologic nodal stage than a human reader. Methods: One hundred thirty-three NSCLC patients with surgically proven N status treated at the University of Washington Medical Center or the Veterans Affairs Puget Sound Health Care System between February 1998 and September 2002 were used as inputs for the creation of an aNN. From CT of the thorax and 18F-FDG PET (neck to pelvis) performed before surgery, we extracted the primary tumor size and uptake (maximum pixel SUV [maxSUV]), normal lung and mediastinal uptake, and nodal uptake (maxSUV). Using the same 133 cases, the same output (surgical N status, N0 to N3), and the same software configuration settings, scenarios were created to assess which input parameters were most influential in creating an optimal aNN. To compute this optimal aNN, cases were split randomly 100 times into a training subset of 103 cases and a testing subset of 30 cases having the same proportion of N0, N1, N2, and N3 cases. N status predicted by the aNN was compared with the proven surgical N status to calculate the aNN accuracy. The N status readings from 18F-FDG PET were also compared with the surgical N status for the same cases to determine 18F-FDG PET accuracy. Results: Statistical tests demonstrate that the best aNN accuracy is achieved by using N1-N2- N3 nodal maxSUV divided by background uptake, the primary tumor size, and primary tumor maxSUV as inputs. The aNN correctly predicted the N stage in 87.3% of the testing cases compared with 73.5% for the 18F-FDG PET expert reader. Accuracy of the aNN increased to 94.8% (PET, 89.4%) when comparing N0 + N1 with N2 or N3 status and to 94.9% (PET, 91.9%) when comparing N0 + N1 with N2 + N3 status. Conclusion: A back-propagation aNN can be trained to predict hilar and mediastinal nodal involvement with greater accuracy than an expert 18F-FDG PET reader. Such a tool could be used to improve clinical interpretations and for clinical training.
Lung cancer remains the leading cause of cancer death in the United States, with over 169,400 new cases and 154,900 deaths expected in 2002 (1). Approximately 80% of primary lung cancers are of non-small cell histology. The stage of non-small cell lung cancer (NSCLC) is the most important factor determining prognosis, management, and operability. Accurate staging is necessary to (a) prevent clinical overstaging and the denial of therapy with curative intent; (b) avoid clinical understaging and the subsequent morbidity, time, and cost of ineffective therapies, particularly unnecessary thoracotomies; (c) select and enroll patients in clinical trials. For NSCLC, accurate staging of the mediastinum is an essential step as treatment options and decisions hinge on the presence or absence of mediastinal lymph node involvement. In the absence of distant metastatic disease, patients with mediastinal node involvement are not candidates for a primary resection. Instead, the patients undergo chemotherapy and radiotherapy as induction treatment before a potential resection for those with only ipsilateral nodal involvement and as a definitive therapy for those with more extensive nodal disease. Therefore, every means should be used to establish the correct stage of a newly diagnosed lung cancer before initiating therapy.
Included in the clinical staging of NSCLC is CT of the thorax and, more recently, PET with 18F-FDG PET. 18F-FDG PET has been shown to be sensitive and specific in detecting distant metastases as well as more accurate than CT for mediastinal staging in NSCLC (2–11). However, 18F-FDG PET staging of the mediastinum remains challenging because of the decreased specificity caused by 18F-FDG accumulation in inflammatory lymph nodes that can lead to a false-positive interpretation. Conversely, the lack of sufficient 18F-FDG uptake in lymph nodes with minimal metastatic involvement can result in a false-negative interpretation. Vansteenkiste et al. (12) demonstrated that in NSCLC the more intense the 18F-FDG uptake in a lymph node, the more likely it is to be malignant and that nodes with lower level uptake are more likely to be inflammatory. However, a significant amount of overlap is present in the ranges of 18F-FDG uptake for both inflammatory and malignant nodes.
Practical experience shows that other imaging features help differentiate malignant from benign nodal disease in NSCLC. For example, the location of hypermetabolic nodes relative to the location of the primary tumor influences the likelihood of a node being malignant. A single hypermetabolic mediastinal lymph node located contralaterally to the primary tumor is less likely to be related to the primary tumor. Furthermore, the uptake of malignant lymph nodes is expected to decrease as the distance from the primary tumor increases. Although the uptake value in lymph nodes provides a further stratification of their malignant likelihood (12), it is unlikely that a single standard uptake value (SUV) threshold could apply equally well to all NSCLCs given the wide range of metabolic activity exhibited by primary lung cancers. Hence, taking into consideration the metabolic activity of the primary tumor should also be of benefit when evaluating the nodal stage of lung cancers from 18F-FDG PET images. Finally, the size of a NSCLC influences significantly the incidence of malignant mediastinal adenopathy with larger tumors being more likely to have nodal involvement than smaller tumors (13,14).
To take into consideration all imaging features that influence the likelihood of malignant spread to regional lymph nodes is very challenging. Furthermore, a human interpreter is unable to integrate the cumulative predictive value of this information for a large cohort of patients and to apply it to a new unknown case. Neural networks are software tools that can be trained on such a cumulative experience. They offer a unique opportunity to improve the accuracy of nodal staging with 18F-FDG PET beyond that achieved by trained interpreters. We therefore proposed to train a back-propagation artificial neural network (aNN) on a cohort of surgically proven NSCLC cases and to compare its accuracy with that of an expert reader. We proposed to show that an aNN trained on 18F-FDG PET-derived nodal uptake, primary tumor uptake, and size is more accurate in predicting the true surgicopathologic nodal stage than an expert human reader.
MATERIALS AND METHODS
Patient Selection
Patients with potentially resectable NSCLC after chest CT and clinical evaluation were prospectively enrolled in a study of the prognostic significance of NSCLC 18F-FDG uptake. Patients were recruited from the University of Washington Medical Center and the Veterans Affairs Puget Sound Health Care System between February 1998 and September 2002. Patients with type I diabetes were excluded before 18F-FDG PET. Patients with stage IV disease by 18F-FDG PET had their metastatic status confirmed by either additional anatomic imaging or percutaneous biopsy and were also excluded from this aNN study. The subsequent surgical staging was performed as follows and as previously reported (10): Patients without distant metastases at PET but with PET evidence of pleural implants underwent thoracoscopy for confirmation if findings were not confirmed as pleural nodules on second review of the thoracic CT scan. Patients without distant metastases at PET but with evidence of mediastinal disease in a location that would not be accessible by mediastinoscopy were surgically staged with thoracoscopy, mediastinotomy, or thoracotomy as indicated. All other patients were staged with bronchoscopy and mediastinoscopy. Surgical confirmation of the nodal status was performed in all patients without distant metastases or pleural implants independently of the size of the lymph nodes on chest CT or the presence or absence of uptake by PET imaging. None of these patients had received chemotherapy or radiotherapy before PET or surgical staging. The results of 18F-FDG PET imaging in the mediastinum were available to the surgeon before confirming the mediastinal nodal status. The pathology departments of the University of Washington Medical Center and the Veterans Affairs Puget Sound Health Care System reviewed all biopsy and resection specimens. The non-small cell nature of each tumor was established, as was the surgicopathologic nodal status. The resulting subset of patients with surgical proof of their mediastinal nodal status was selected for the aNN study. Figure 1 reviews the selection protocol. One hundred thirty-three patients satisfied the enrollment criteria. The disease characteristics of these patients are summarized in Table 1. This study was conducted under Institutional Human Subjects approval.

18F-FDG PET-based clinical and surgical staging and management of NSCLC.
Statistic of Cases Ordered by Nodal N Stage
PET
All PET studies were performed on a dedicated whole-body PET tomograph (PET Advance; General Electric Medical Systems). Patients were asked to fast for a minimum of 12 h before tracer administration. Intravenous access was obtained for tracer administration and blood sampling. An initial blood sample was obtained at the time of intravenous catheter placement to screen for abnormally high plasma glucose levels. Just before tracer administration, patients received 1 mg of intravenous lorazepam to decrease benign muscular uptake in the neck and upper thorax that could compromise image interpretation. 18F-FDG (259–407 MBq) was infused intravenously over 2 min using a Harvard pump. After a 45-min rest and uptake period, patients were placed supine in the scanner with the thorax positioned to fit within 2 contiguous 15-cm-wide tomograph fields of view. Imaging always started with a 15-min emission scan performed over the thoracic field of view encompassing the primary lung cancer. This allowed quantitative analysis of tracer uptake via the SUV in the primary tumor over a standard time period (45–60 min) after injection to control for the time dependence of the SUV. The other thoracic field of view as well as the abdomen was also imaged with 10-min emission scans. Five-minute emission scans were performed over the neck and pelvis. This was followed by 15-min transmission studies over the 3 fields of view encompassing the chest and abdomen, performed after all emission studies had been completed. Overall, total imaging time was 90 min.
All studies were collected in 2-dimensional imaging mode with scatter septa in place. Real-time correction for random counts was performed using counts obtained with a delayed coincidence window, and deconvolution-based scatter correction was performed using algorithms supplied by the manufacturer. The raw PET data were reconstructed using the standard filtered backprojection technique available on the PET Advance system. The following reconstruction parameters were used: 12-mm Hanning filter, 55-cm image diameter, and 128 × 128 array size. Both emission scans and attenuation-corrected scans were reconstructed for each patient. The transmission scan that is coregistered to the other 2 scans was also reconstructed as it provides anatomic localization details that may not be easily appreciated on the 2 other scans. All 18F-FDG PET scans were read prospectively on a dedicated workstation by the same experienced reader and with the benefit of comparison with the patient’s thoracic CT scans. The expert reader had available to him the size of the primary tumor and the FDG uptake values for the lymph nodes and the primary tumor as defined below. Subsequent to the PET scan interpretation, feedback of surgical nodal staging results was provided to the expert reader.
From the attenuation-corrected 18F-FDG PET study, regions of interest (ROIs) were drawn over the primary tumor and the hypermetabolic mediastinal or hilar nodes to extract maximal pixel standard uptake values (maxSUVs). All SUVs are defined by SUV = C × W/ID, where C is the radiotracer concentration (MBq/mL) in a voxel of tissue, W is the patient weight (g), and ID is the injected tracer dose (MBq). From the attenuation-corrected images and the reconstructed transmission scan, the PET interpreter assigned a location to each measured lymph node according to the American Joint Committee on Cancer TNM staging system for lung cancer. Metastasis to ipsilateral peribronchial and/or ipsilateral hilar lymph nodes is considered N1 disease. N2 disease is considered metastasis to ipsilateral mediastinal and/or subcarinal lymph nodes, whereas N3 is metastasis to contralateral mediastinal, contralateral hilar, and ipsilateral or contralateral scalene or supraclavicular lymph nodes. The most metabolically active node was selected for each N station. For each patient, this yielded a maxSUV for N1, N2, and N3. ROIs were drawn on 3 contiguous axial planes over the normal lung near the primary tumor or symmetrically in the opposite lung parenchyma to obtain a mean lung background SUV. ROIs were also drawn on 3 contiguous axial planes a few millimeters under the carina to calculate the mean mediastinal background SUV. The mean lung background was used to correct the primary tumor maxSUV for partial-volume effect according to a method previously described (15). Lung SUV also served to normalize the N1 station nodal uptake by either subtracting or dividing the lung background from the N1 station maxSUV (N1 lymph nodes are intralobar or hilar in location and surrounded by normal lung tissue). Uptake at the N2 and N3 nodal stations was corrected by either subtracting or dividing by the mean mediastinal background. The significance of FDG uptake in a mediastinal lymph node depends on its intensity relative to that of normal mediastinum. Because normal mediastinum varies slightly in its FDG uptake from patient to patient, we compared nodal uptake in a patient with mediastinal uptake in that same patient. To simulate visual perception, the comparison of nodal uptake with its corresponding background was expressed in 2 different ways, a subtraction and a ratio, and we evaluated which of the 2 methods provided the most accurate neural network architecture. In the absence of uptake at the N1, the N2, or the N3 station, the corresponding background value was used for that N station—that is, mean lung background for the N1 station and mean mediastinal background for N2 and N3 stations. As an input for the aNN, the nodal station uptake was therefore a set of 3 numbers derived from the PET images (iN1, iN2, iN3).
The size of the primary NSCLC was determined by averaging its 3 greatest dimensions measured on mediastinal windows of the chest CT. Primary tumor size was also used to correct primary tumor maxSUV for partial-volume effects (15).
Neural Network
We used the DOS platform version 4R1 of NevProp (16), distributed freely under the terms of the GNU Public License (www.gnu.org), to compute all aNNs. This program was used to derive a feedforward multilayer-perceptron aNN using supervised learning and the back-propagation algorithm for training. aNNs are composed of logical units (neurons) grouped and placed into hierarchic layers before being connected. The feedforward aNN type refers to a specific connection structure where neurons of 1 neuron layer may only have connections to neurons of deeper layers. Our aNN was composed of 3 neuron layers: an input layer, a hidden layer, and a final output layer. The hidden layer always lies between the aNN input and output layers. It is called hidden because its neuron values are not visible outside the aNN. The usage of hidden layers extends the aNN abilities to learn logical operations. Each time a new set of values is passed to the aNN input neuron layer the neurons generate output values. Those values circulate through all neurons interconnected and will be modified by each of them to finally reach the output layer, producing the final value of the aNN. Values from the output layer are then compared with a target output (surgicopathologic nodal status). Based on the difference between these outputs, the aNN error is computed and propagated backward (back-propagation) through the network to modify values of each connection between neuron layers. The aNN learning process is based on this error back-propagation.
All analyses were implemented on a personal computer equipped with a 1.8-GHz clock and 256 megabytes of RAM memory. A dedicated Structured Query Language server was built as an intermediate between the patient database and NevProp to allow computing of many different aNNs and to report the efficacy of these networks.
The neural network study was performed in 2 phases. The first phase consisted of the identification of the best input parameters for the aNN. The second phase consisted of the evaluation of the accuracy of the aNN for these selected best input parameters. The desired output for a trained aNN consists of a set of 4 values (aNN-N0, aNN-N1, aNN-N2, aNN-N3) representing the likelihood of each of the nodal stages as predicted for the patient by the network. The nodal output with the highest predicted likelihood is the one selected as the nodal stage predicted by the aNN. For example, an output of (0, 0.05, 0.80, 0.20) means that the aNN predicts a 0% chance that a patient has N0, a 5% chance of being N1, an 80% likelihood that the patient has an N2 surgical status, and a 20% chance of being N3. Therefore, the aNN predicted stage for this case would be N2.
Phase One.
Twelve different aNN scenarios corresponding to 12 different combinations of inputs were studied to assess which combination of input parameters was most effective. The following parameters were tested: mediastinal and hilar nodes maxSUV by station (iN1, iN2, iN3) divided or subtracted by their respective background, primary tumor size in centimeters, primary tumor maxSUV, and primary tumor maxSUV corrected for partial-volume effect (PVCmaxSUV). Lymph node size was not used as input for the aNN or to correct nodal uptake for partial-volume effect. Scenario 1 was composed only of nodal station maxSUV (iN1, iN2, iN3) subtracted by its background. In scenario 2, primary tumor size and background-subtracted nodal maxSUV were considered; scenario 3, background-subtracted nodal maxSUV and primary tumor maxSUV; scenario 4, primary tumor size was added to scenario 3; scenario 5, background-subtracted nodal maxSUV and primary tumor PVCmaxSUV; scenario 6, primary tumor size was added to scenario 5. Scenarios 7–12 are composed of the same combinations as scenarios 1–6 but the ratio of nodal maxSUV to its corresponding background was used in place of the difference between nodal maxSUV and its background (Table 2). All scenarios share the same 133 cases (Table 1), the same output definition (surgicopathologic N status, N0 to N3), and the same software configuration settings (1 hidden layer of 7 units, 75,000 iterations: training was done with 50% of cases and cross-checking with the other 50%). Each scenario was run 100 times, with different case subsets to obtain an average accuracy for the aNN defined by a scenario. The scenario yielding the most accurate network was retained for the second phase of the study.
Phase 1 Study: aNN Accuracy in Identifying Absolute Nodal Status (N0, N1, N2, and N3)
Phase Two.
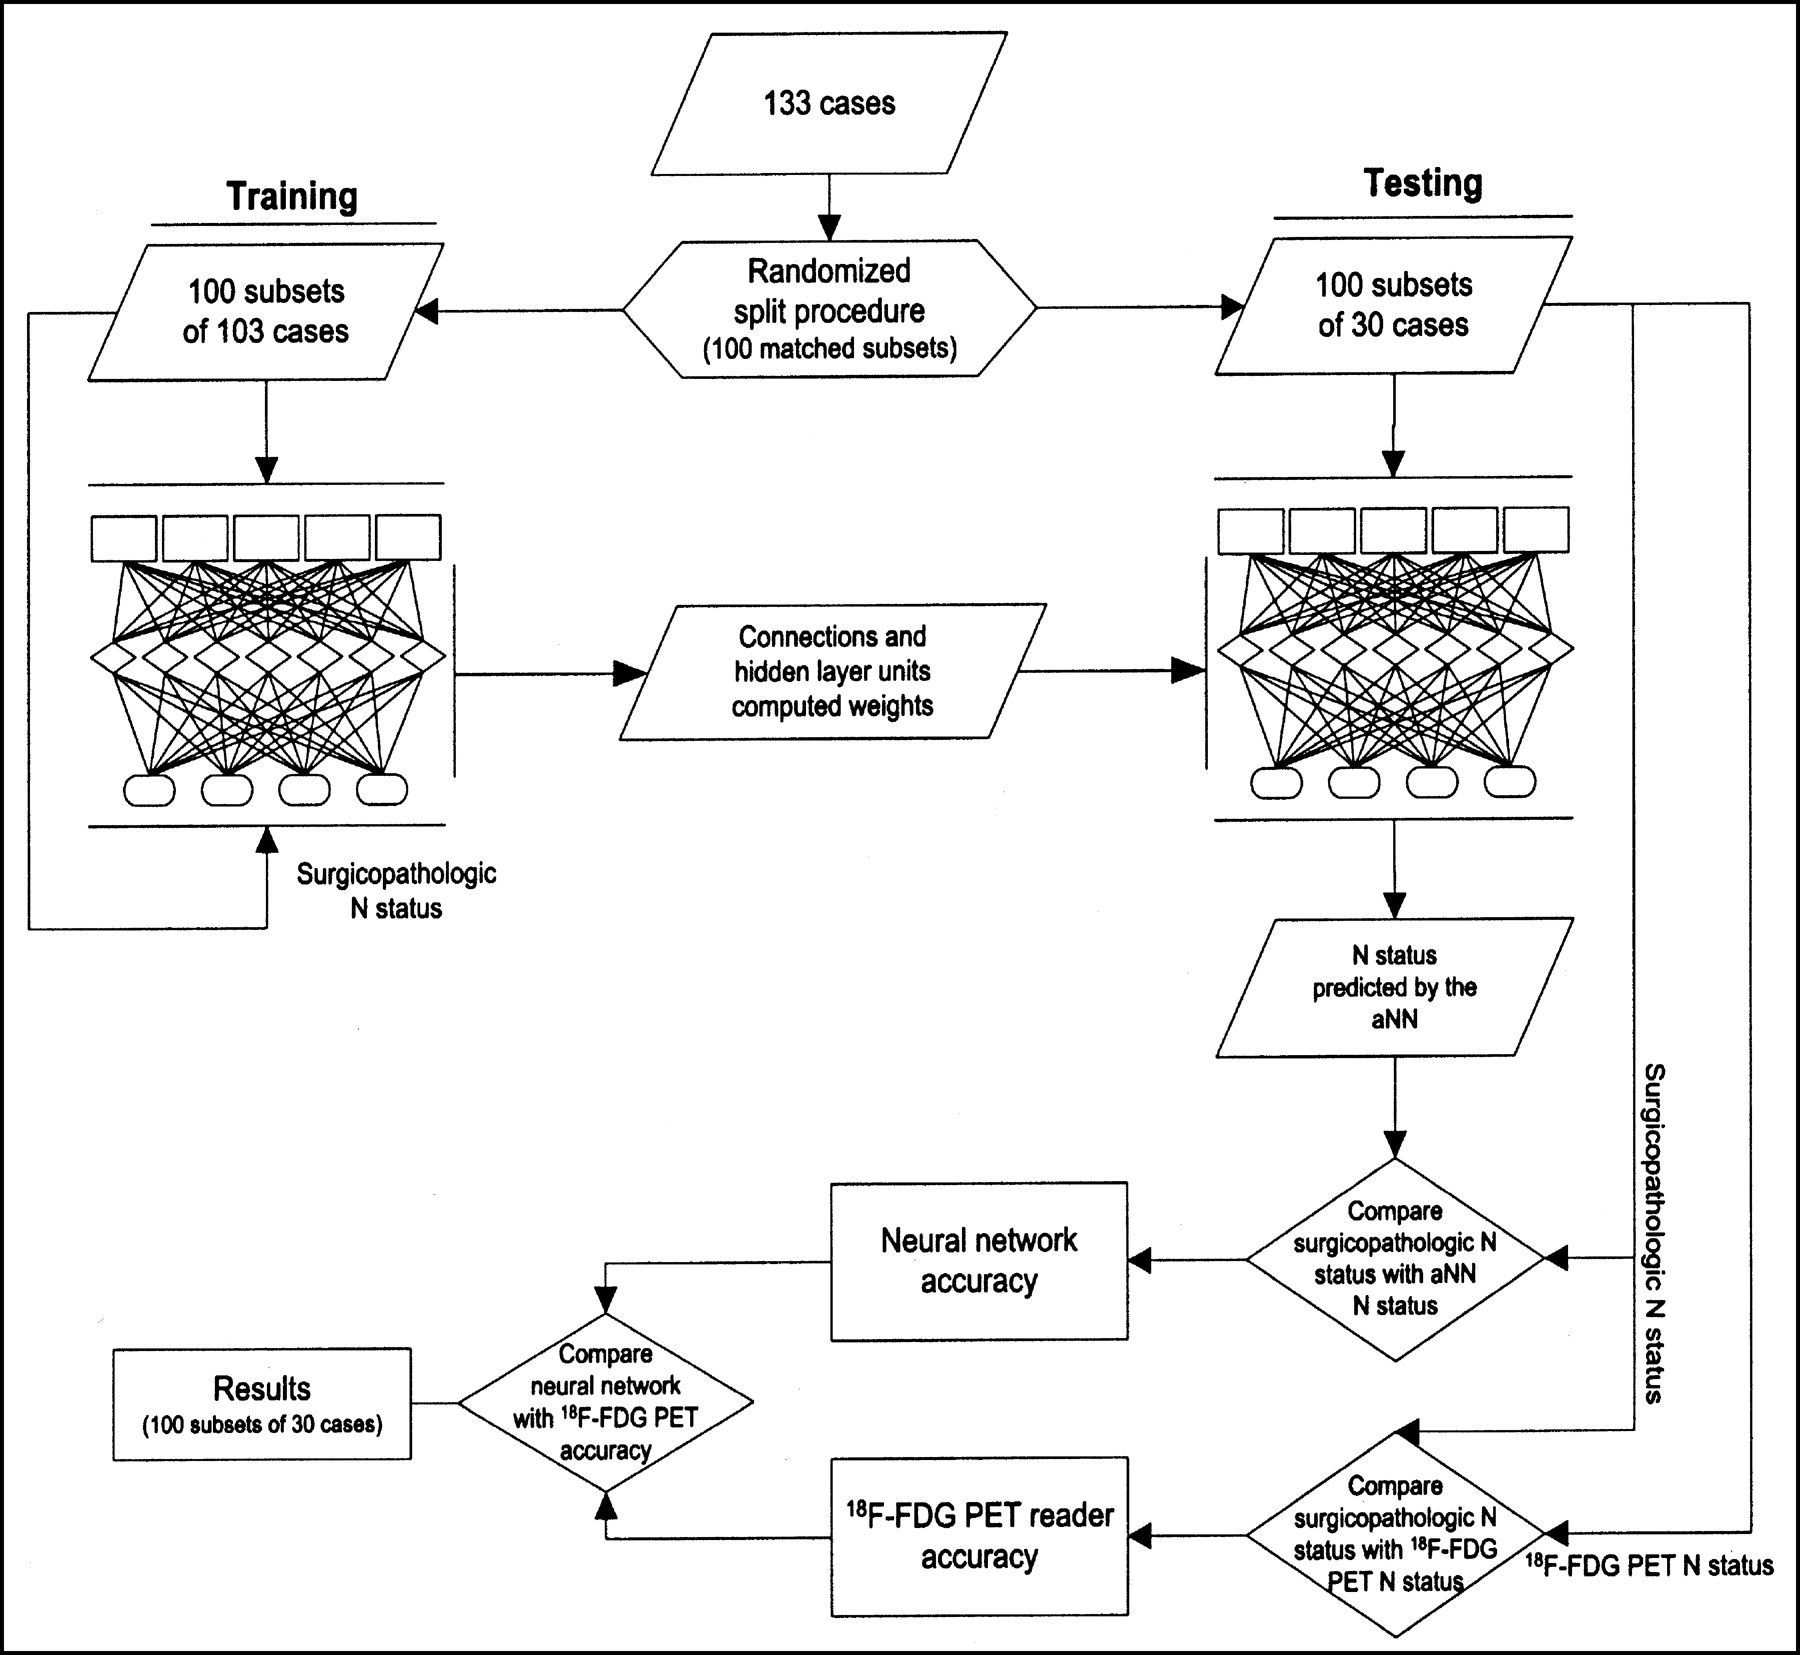
The 133 available cases were split 100 times into a training subset of 103 cases and a testing subset of 30 cases. Each testing subset is composed of randomly selected cases from the whole database and has the same proportion of N0 (49.5%), N1 (19.5%), N2 (25%), and N3 (6%) cases as the entire cohort of 133 cases. This results in an identical proportion of cases in each N status group for the matched training subset as well. The aNN training was done using the input variables determined in phase one, a hidden layer of 7 units, an adaptive learning rate (step 0.01), 75,000 iterations, and an output composed of the surgicopathologic N status (Fig. 2). Each of the 100 training subsets of 103 cases each was used to train a blank aNN with the other 30 cases sequestered as a future test set. This training yielded a set of coefficients defining this aNN (Fig. 3). Its testing against the 30 unknown cases it had never seen yielded an accuracy for this aNN implementation with the surgicopathologic N status as the truth. Not to be biased to a high- or low-accuracy run, we repeated this process 100 times, each time starting with a different set of 103 training cases and a new empty aNN with blank coefficients. The average of the resulting 100 accuracies is an estimation of the accuracy of an aNN of this architecture for this task.

aNN diagram (scenario 10).

Phase 2: summary of aNN protocol.
We also compared the N status determined by the expert reader for the same testing cases to the surgicopathologic N status to calculate the 18F-FDG PET accuracy. This was done by averaging the accuracies of the human reader for each of the 100 test sets of 30 cases used to test the aNN. Direct comparison between the aNN and 18F-FDG PET reader accuracies was performed to demonstrate the benefits of using an aNN to predict mediastinal N status. Figure 3 reviews the analysis protocol. Comparisons of the accuracy between an aNN defined by 2 different scenarios were performed using the paired t test.
RESULTS
Results obtained from all scenarios tested in the first phase of the study demonstrate an increase in accuracy as additional input information is entered into the aNN (Table 2; Fig. 4). Taking the scenarios using only nodal maxSUV corrected either by background division or by subtraction (scenarios 1 and 7) as a starting point, a significant increase (p1−3,p7−9<0.001) in accuracy is observed when the primary tumor maxSUV is added as an input (scenarios 3 and 9). A further increase in accuracy (p3−5,p9−11<0.001) is obtained when using primary tumor PVCmaxSUV instead of maxSUV (scenarios 5 and 11). Because tumor size is indirectly included in PVCmaxSUV, no significant difference in accuracy (p4−6 = 0.866, p10−12 = 0.353) was observed using primary tumor PVCmaxSUV and primary tumor size (scenarios 6 and 12) when compared with primary tumor maxSUV and primary tumor size (scenarios 4 and 10). The above aNN implementations also permitted comparisons between 2 methods for correcting nodal uptake with surrounding background uptake. An important increase in accuracy (p4−10<0.001) is observed when using the nodal maxSUV/background ratio, primary tumor size, and tumor maxSUV (scenario 10) as compared with scenario 4, which uses nodal maxSUV with background subtracted, primary tumor size, and tumor maxSUV. The highest accuracy was reached with scenario 10 (nodal maxSUV/background, primary tumor size, tumor maxSUV) and scenario 12 (nodal maxSUV/background, primary tumor size, tumor PVCmaxSUV) without significant difference in accuracy between the 2 (p10−12 = 0.353). We elected to use scenario 10 over scenario 12 for the following reasons. First, because partial-volume correction may not be available at all PET centers, maxSUV is simpler to implement than PVCmaxSUV. Second, partial-volume correction could compound any error made in lesion size determination.

aNN accuracy for predicting surgicopathologic N status. CI = confidence interval.
The second phase of this study was executed using the aNN with inputs defined by the ratio of nodal uptake/background at N1, N2, N3, primary tumor maxSUV, and primary tumor size (scenario 10). When considering all 133 cases available, the accuracy of the PET reader in determining the surgicopathologic N status was 72.2% (Table 3). For the task of differentiating N0 + N1 from N2 or N3 status, the PET reader accuracy increases to 89.5%. It reaches 91.7% when differentiating N0 + N1 from N2 + N3 status.
PET Reader/Surgicopathologic N Status Comparison for all 133 Cases
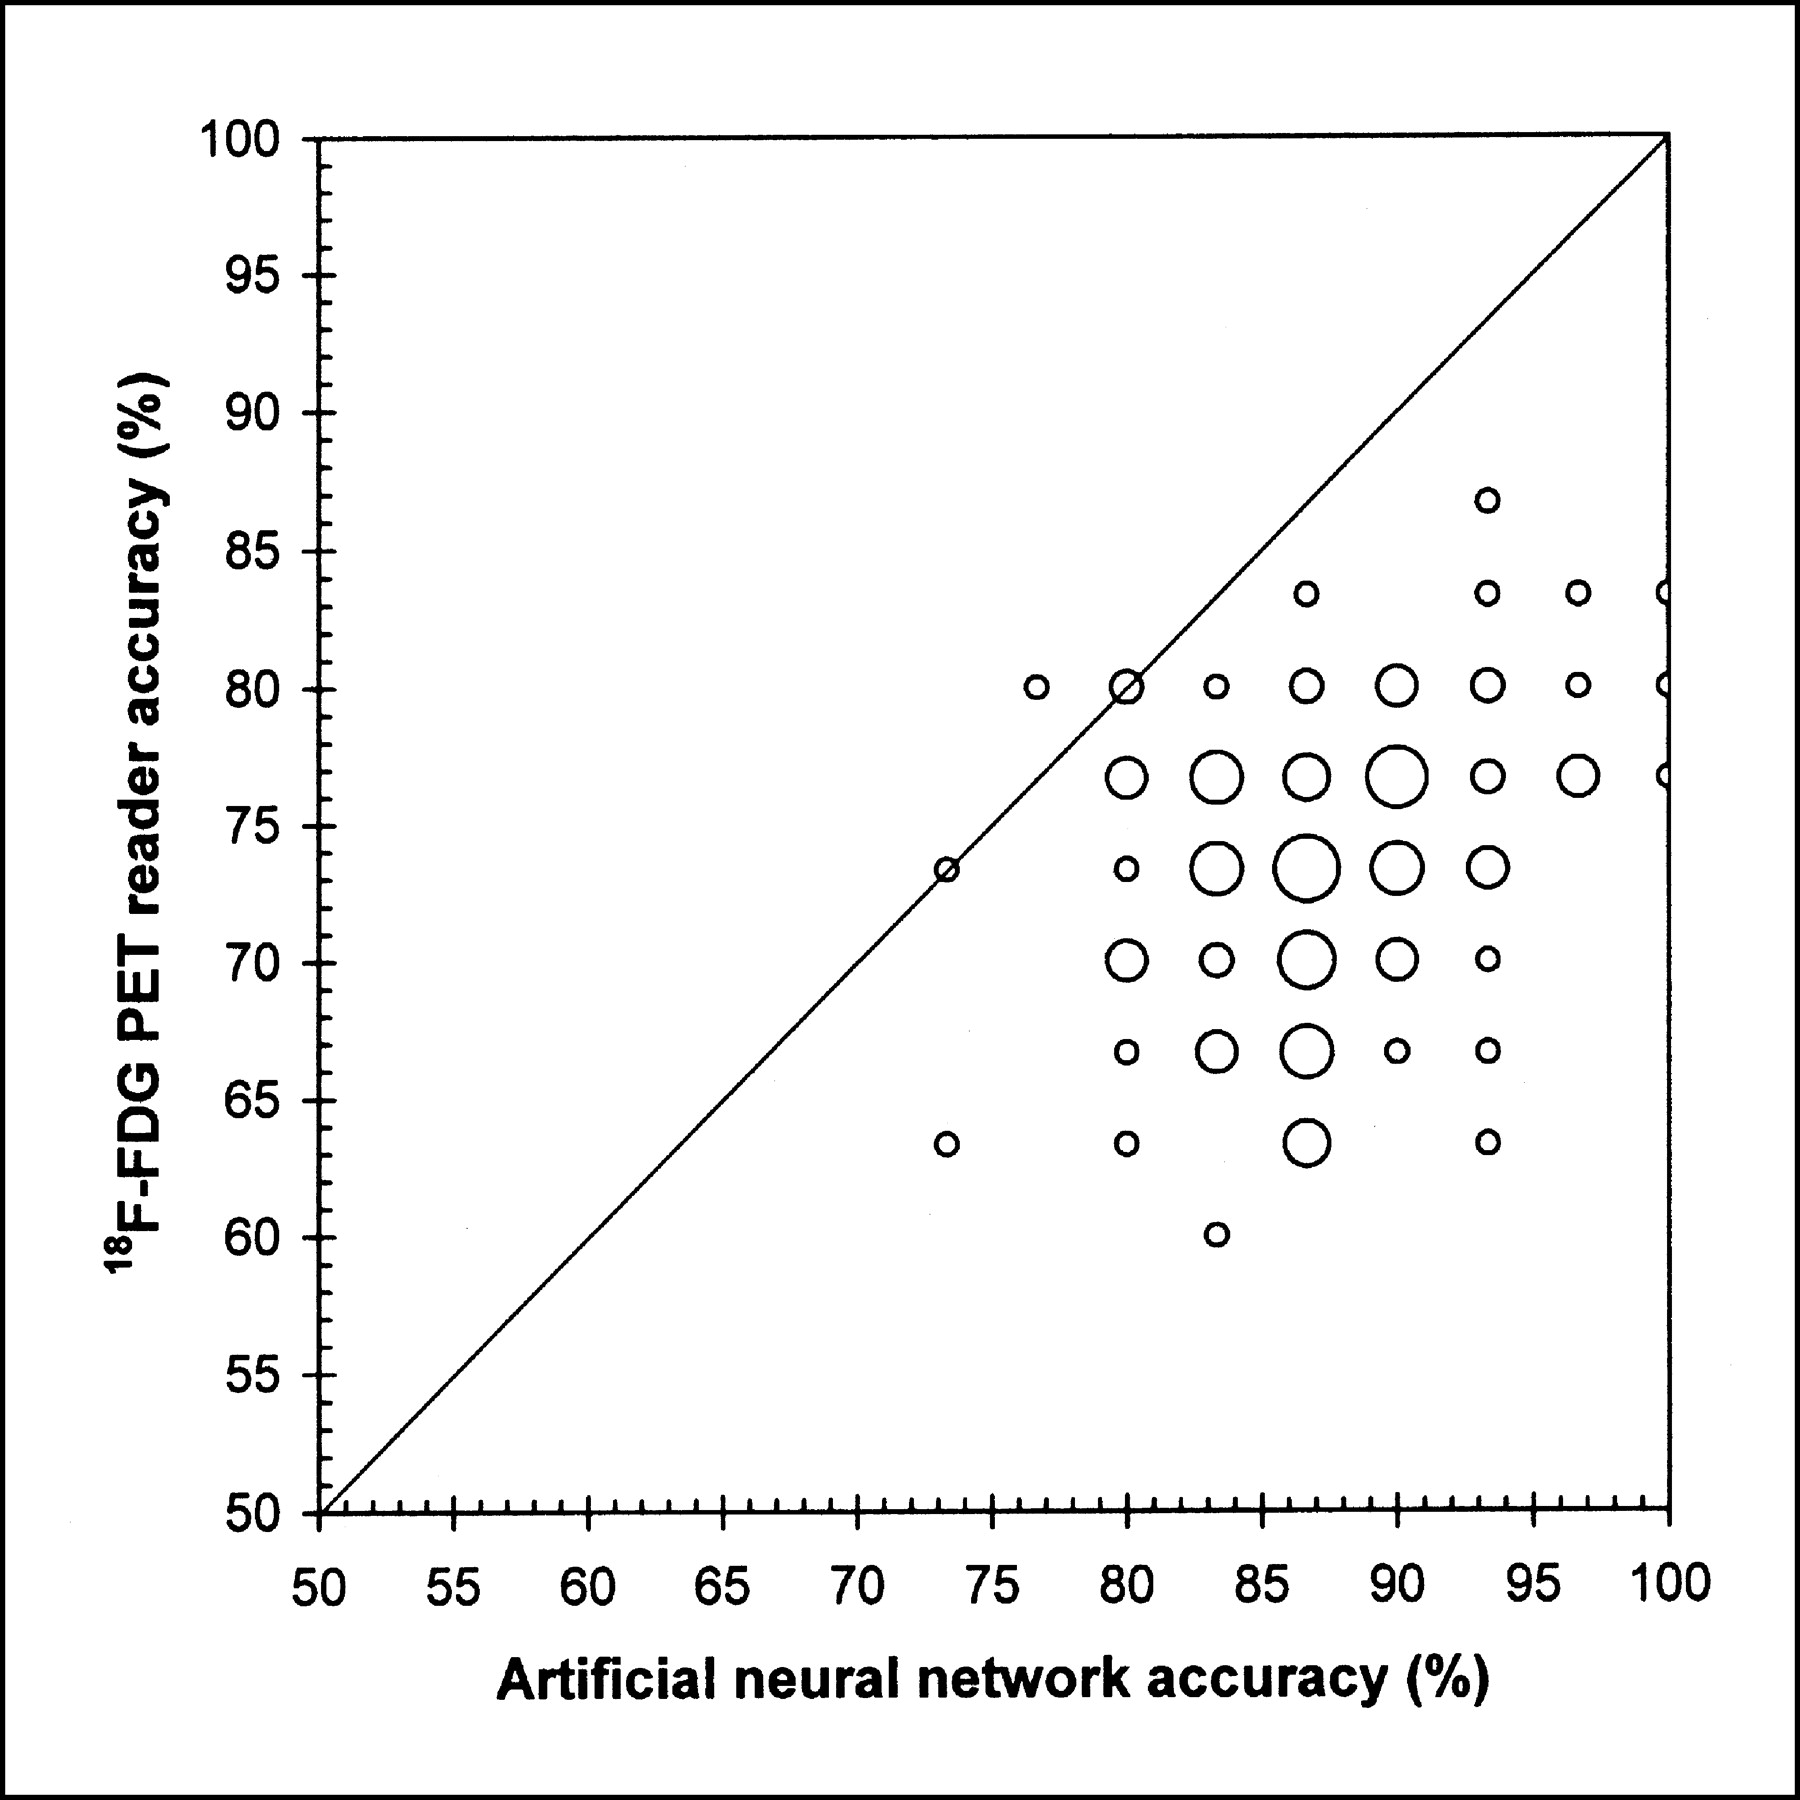
The average accuracy of the 100 networks trained in phase 2 was evaluated and compared with that of the PET reader for the same 100 testing sets of 30 cases each. The average accuracy of all 100 trained aNNs in determining the surgicopathologic N status was 87.3% ± 0.54% as compared with 73.5% ± 0.55% for the PET reader (Table 4). The average accuracy of the networks increased to 94.8% ± 0.31% (PET reader, 89.4% ± 0.45%) for the task of differentiating N0 + N1 from N2 or N3 and to 94.9% ± 0.31% (PET reader, 91.9% ± 0.39%) when differentiating N0 + N1 from N2 + N3 status. For the vast majority of trained aNNs, the aNN accuracy was higher than that of the PET reader with very high significance (P < 0.001) (Fig. 5).

Comparison of aNN and PET reader accuracy for each of 100 training sessions. The larger the frequency of accuracy, the larger the symbol.
PET Reader and aNN-Predicted N Status Compared with Surgicopathologic N Status for 100 Subsets of 30 Cases
DISCUSSION
18F-FDG PET provides more accurate noninvasive mediastinal staging than standard CT staging as reported in a meta-analysis of published results for 14 PET studies and 29 CT studies (17). The mean sensitivity and specificity were 79% ± 3% and 91% ± 2%, respectively, for PET and 60% ± 2% and 77% ± 2%, respectively, for CT (17). For all 133 cases enrolled in our study, the sensitivity and specificity of the expert PET reader were 80.5% and 96.7%, respectively, in staging the mediastinum, which is therefore in keeping with published series.
The interpretation of nodal uptake at 18F-FDG PET imaging of NSCLC remains challenging because (a) 18F-FDG accumulation in inflammatory lymph nodes can result in false-positive readings and (b) minimal nodal tumor burden may yield a low 18F-FDG uptake and consequently a false-negative interpretation. Furthermore, the significance of nodal uptake depends on the metabolic activity of the cells of a given cancer as reflected in the activity of the primary tumor. Moreover, the larger the primary tumor, the more likely it has spread to regional lymph nodes (13,14). Finally, the location of hypermetabolic nodes relative to the primary tumor has significance. Because of these many factors influencing the interpretation of nodal uptake, we investigated whether an aNN could perform better than a human interpreter in predicting the surgicopathologic stage of a NSCLC. To our knowledge, an aNN has not been previously applied to the interpretation of 18F-FDG PET scans.
All patients enrolled in our study had disease considered potentially resectable prior to 18F-FDG PET imaging. By eliminating those cases with distant metastases and pleural implants, we were left with patients for whom accurate mediastinal nodal staging by 18F-FDG PET was critical in determining their clinical management. These patients present a diagnostic challenge because they have a nodal disease burden that covers a wide range of stages with varying degrees of nodal uptake. Of the 133 patients enrolled, 66 were surgicopathologically identified as having no nodal involvement (N0, 49.5%); 26 had only extension to the N1 station (19.5%), 33 to the N2 station (25%), and 8 to the N3 station (6%). This distribution of disease is compatible with a patient population screened by CT for potential resectability and where patients with bulky nodal burden are eliminated.
Phase 1 of our study clearly demonstrated that the size and the metabolic activity of the primary tumor are important variables in interpreting 18F-FDG PET of NSCLC as they affect the likelihood of malignant involvement in hypermetabolic nodes. The importance of the primary tumor size as an input for the aNN is in keeping with the correlation found between size and nodal N status in our database and published data (13,14). Furthermore, nodal hypermetabolic activity has to be related to the local background 18F-FDG uptake to determine its true significance. We found that dividing nodal maxSUV by background activity resulted in better aNN performance than background subtraction.
In phase 2 of our study, we trained an aNN using the inputs determined to be most significant: the nodal maxSUV (N1, N2, and N3) divided by background, the primary tumor size, and the primary tumor maxSUV. From the 133 available cases, 30 cases were randomly moved into a new data subset (testing subset) that subsequently served as an unknown set of cases to test the aNN. This splitting procedure was done 100 times to calculate an aNN average accuracy. The 100 subsets of 30 cases were all composed of the same proportion of N0, N1, N2, and N3 nodal disease in order to not bias the aNN learning process because the aNN accuracy will vary with the number of cases in each category. For example, if there were less N3 cases in one subset than in the others, the aNN would consequently have less experience in identifying N3 nodal disease than the other aNNs. With this kind of split procedure, we avoided such bias in the aNN learning process.
When reading all 133 available cases, the expert PET reader had an accuracy of 72.2% in identifying the exact nodal status (N0, N1, N2, N3), an accuracy of 89.5% in identifying N0 + N1 from N2 or N3, and an accuracy of 91.7% in identifying N0 + N1 from N2 + N3. Analyzing only the 100 subsets, each consisting of 30 cases, the average accuracy of the PET reader was 73.5% ± 0.55% for differentiating N0 from N1, N2, or N3. The PET reader average accuracy increased to 89.4% ± 0.45% when differentiating N0 + N1 from N2 or N3 and increased to 91.9% ± 0.39% when differentiating N0 + N1 from N2 + N3 status. Therefore, the PET reader accuracy was similar for the 133 cases when compared with the 100 subsets of 30 cases. This demonstrates that the random selection process of the 100 subsets of 30 cases is representative of the whole group of 133 cases. The subset creation did not induce selection bias that could benefit either the aNN or the expert PET reader.
From these 100 subsets, the aNN correctly identified the exact nodal status in 87.3% ± 0.54% of the cases (PET reader, 73.5% ± 0.55%). The aNN reliably identified 95% of the cases with N0 disease (PET reader, 90.5%), 67.6% with N1 disease (PET reader, 22.6%), 80.1% with N2 disease (PET reader, 70.8%), and 99% with N3 disease (PET reader, 74%). The lack of sensitivity of the PET reader for N1 disease likely originates from the fact that N1 lymph nodes are often located close to the primary tumor and their modest 18F-FDG uptake, compared with the more intense uptake of the adjacent primary mass, makes them very difficult to identify. In addition, this low sensitivity for N1 disease may result, in part, from the small size of intralobar N1 nodes making them difficult to visualize by PET. These small nodes are also difficult to identify on chest CT and are often found only during pathologic examination of resected specimens. In several cases, the aNN was able to predict the presence of N1 disease in the absence of definite N1 nodal uptake on 18F-FDG PET. It did so based on its training and on the size and uptake of the primary tumor.
For one of the most important differentiations to be made for preoperative treatment planning, the aNN accurately differentiated N0+1 from N2+3 disease in 94.9% ± 0.31% (PET reader, 91.9% ± 0.39%). Patients with N0–1 status are preferably treated by primary resection without preoperative chemotherapy if their T status allows resection and if there is no distant metastatic disease; N2 patients are considered for chemotherapy or chemoradiotherapy before resection and N3 patients undergo definitive chemoradiotherapy.
The trained aNN performed consistently better than a human expert reader in determining (a) the surgicopathologic N status (N0 vs. N1 vs. N2 vs. N3), (b) N0 + N1 versus N2 or N3, and (c) N0 + N1 versus N2 + N3. The strength of the aNN resides in the fact that it can be taught to predict the presence of microscopic nodal involvement based on the size and uptake of the primary tumor even in the absence of nodal uptake noted at 18F-FDG PET imaging. Furthermore, the aNN can learn from many cases and then gauge any new unknown case against its acquired experience. Although a trained human observer uses its experience to interpret new cases, he or she is unable to compare a new case with a large personal database.
For example, in the event of no mediastinal or hilar uptake read as N0 by the human reader but found to have microscopic N1 or N2 disease at surgery (false-negative FDG interpretation), the aNN may be able to predict the accurate N1 or N2 stage by realizing that the primary tumor is large and very metabolically active and that in its “experience” such tumors usually have positive N1 or N2 status. Similarly, the aNN can avoid false-positive interpretation by realizing that the uptake in a node is not high enough to be interpreted as positive. It does so among other things by comparing the nodal uptake with that of the primary tumor. More metabolically active tumors are expected to have “hotter” positive nodes than less metabolically active tumors.
For an aNN to learn, rigorous techniques need to be observed to limit error. Therefore, standardized protocols were followed for PET imaging. Data extraction from PET and CT scans was standardized and 1 experienced reader read all scans and extracted all data. Also, all patients followed the same surgical pathway with uniform staging. For this study, the aNN aimed at establishing the nodal status of a patient and not at establishing the entire TNM stage as the N status at 18F-FDG PET presents unique interpretative challenges. To be of use in a clinical setting, an aNN needs to be easy to implement and use. We, thus, elected to limit the number of input parameters required by the aNN to primary tumor size and maxSUV and to nodal uptake. We defined these parameters in a simple fashion so that extracting the input data from PET and CT scans could be easily accomplished by the individual interpreting 18F-FDG PET scans in a clinical setting. However, care should be taken before exporting a trained aNN to another center, primarily because of variations in 18F-FDG PET protocol among imaging centers. These variations will affect the SUVs used as inputs for the aNN. These variations include time from 18F-FDG injection to imaging, type of image reconstruction algorithm (filtered backprojection vs. ordered-subsets expectation maximization vs. row-action maximization-likelihood algorithm) and reconstruction filter, different transmission and emission scan length, and different attenuation correction methods. Standardization in these areas should be made before exporting an aNN to another medical center. As an alternative, this network definition could be used but would need to be trained with locally acquired data.
CONCLUSION
A feedforward multilayer-perceptron aNN, with back-propagation algorithm, can be trained to predict hilar and mediastinal nodal involvement from 18F-FDG PET images of NSCLC with greater accuracy than an expert PET interpreter. Such a tool can be used to enhance the accuracy of clinical interpretations. It could also serve to train residents and fellows in reading PET scans.
Acknowledgments
This study was supported by National Institutes of Health grant CA80907
Footnotes
Received Apr. 25, 2003; revision accepted Sep. 8, 2003.
For correspondence or reprints contact: Hubert Vesselle, PhD, MD, Department of Radiology, Division of Nuclear Medicine, Box 356113, University of Washington Medical Center, 1959 NE Pacific St., Seattle, WA 98195.
E-mail: vesselle{at}u.washington.edu
REFERENCES
In this issue


Jump to section
Related Articles
Cited By...
- Diagnostic Accuracy of Lymph Node Metastasis Depends on Metabolic Activity of the Primary Lesion in Thoracic Squamous Esophageal Cancer
- 18F-FDG Uptake by Primary Tumor as a Predictor of Intratumoral Lymphatic Vessel Invasion and Lymph Node Involvement in Non-Small Cell Lung Cancer: Analysis of a Multicenter Study