


Abstract
After traumatic brain injury (TBI), subcortical white matter damage may induce a functional disconnection leading to a dissociation of regional cerebral metabolic rate of glucose (CMRglc) between the cerebral cortex and deeper brain regions. Therefore, thalamic and brain stem CMRglc may have a closer correlation than does the cerebral cortex with depth of coma after TBI. Methods: Eleven adult healthy volunteers and 23 adult patients with TBI (median initial Glasgow Coma Scale score [GCSini], 8) underwent 18F-FDG PET within 5 d after injury. The CMRglc of cortical areas (remote from hemorrhagic lesions), striatum, thalamus, brain stem, cerebellar cortex, and whole brain was compared with severity of injury and the level of consciousness evaluated using GCSini and the Glasgow Coma Scale score at the time of PET (GCSpet). Results: The regional CMRglc of the brain stem is relatively unaffected by the TBI. Compared with healthy volunteers, TBI patients exhibited significantly depressed CMRglc in the striatum (3.9 ± 1.3 vs. 5.1 ± 0.9 mg/100 g/min, P < 0.05) and thalamus (3.1 ± 1.0 vs. 4.3 ± 0.9 mg/100 g/min, P < 0.05). CMRglc levels were not statistically lower in the cerebellum (2.9 ± 0.8 vs. 3.5 ± 0.8 mg/100 g/min, P = NS) and brain stem (2.5 ± 0.5 vs. 2.6 ± 0.5 mg/100 g/min, P = NS). However, compared between comatose and noncomatose patients, CMRglc values in the thalamus (2.7 ± 0.7 vs. 3.6 ± 1.2 mg/100 g/min, P < 0.05), brain stem (2.2 ± 0.4 vs. 2.8 ± 0.5 mg/100 g/min, P < 0.01), and cerebellar cortex (2.6 ± 0.5 vs. 3.4 ± 1.0 mg/100 g/min, P < 0.05) were significantly lower in comatose patients. When individual values of regional CMRglc were plotted against posttraumatic level of consciousness, CMRglc values for the thalamus, brain stem, and cerebellum significantly correlated with the level of consciousness at the time of PET (r = 0.58, P < 0.01; r = 0.66, P < 0.01; r = 0.64, P < 0.01, respectively). CT or MRI findings were normal for the analyzed structures except for 3 patients with diffuse axonal injury of the brain stem. The presence of shear injury was associated with poor GCSini (P < 0.05.) but was not related to GCSpet and brain stem CMRglc. Conclusion: A PET investigation using 18F FDG demonstrated a significant difference in glucose metabolism in the thalamus, brain stem, and cerebellum between comatose and noncomatose patients acutely after TBI. The metabolic rate of glucose in these regions significantly correlated with the level of consciousness at the time of PET.
The etiology of coma after traumatic brain injury (TBI) remains unclear. One speculation is that coma is the result of functional or anatomic disconnection between the cerebral cortex and deeper brain regions or disconnection within the thalamic-brain stem structures (1). This disconnection presumably occurs as a result of diffuse axonal injury (DAI) due to either shearing or neuropraxia (2). Pathologic evidence for such a process has been difficult to come by because histologic examination of brain tissue generally is possible only for fatal injuries. Although MRI studies often reveal punctuate white matter hemorrhages in cases of diagnosed DAI (3), the extent of the visible injury is insufficient to explain the profound level of coma seen after TBI. Other investigators have assessed DAI using diffusion-weighted imaging (4) and MRI spectroscopy (5). Regional cerebral blood flow (CBF) measurements using SPECT have shown white matter abnormalities not observed with conventional CT or MRI (6). Both hyperglycolysis and metabolic depression have been noted in patients with DAI studied with PET (7–10).
Under normal and many pathologic circumstances, CBF is coupled with the functional activation of the cortex (11). However, in a study of patients who were vegetative from a variety of etiologies, Laureys et al. (1) demonstrated an uncoupling between thalamic and cortical CBF. Because coupling was restored after recovery, the authors suggested that the vegetative state was due to a functional disconnection of the reticular activating system from the cerebral cortex in the absence of anatomic abnormalities. Whether this finding applies specifically to TBI has not been established.
Assessment of the regional cerebral metabolic rate of glucose (CMRglc) may better demonstrate regional neuronal function, since glucose is the major metabolic substrate of the human brain. In an earlier study, we reported a poor correlation between global cortical CMRglc and level of consciousness among severe TBI patients studied with 18F-FDG PET within 1 mo of injury (12). Because of methodologic resolution issues, we could not accurately assess metabolic activity in deeper discrete structures such as the brain stem. A newer-generation PET scanner and concurrent MRI have now allowed accurate, previously impossible, identification of smaller discrete brain regions on PET images. Consequently, we have been able to probe deeper within the brain to determine whether metabolic coupling within the thalamic and brain stem regions was better than that within the cerebral cortex at predicting the level of consciousness acutely after TBI. The analysis revealed that the correlation between the deeper brain structures and level of consciousness was indeed better.
MATERIALS AND METHODS
Patient Selection
From September 1998 through August 2001, 34 head-injured patients underwent 18F-FDG PET at the University of California at Los Angeles (UCLA) Medical Center. To be included in this prospective study, the TBI patients had to have a Glasgow Coma Scale score (GCS) < 9 or a GCS of 9–15 with positive CT findings, be older than 16 y, have no prior known history of neurologic or psychiatric disease, and be clinically “stable” for PET from a hemodynamic, pulmonary, and intracranial pressure standpoint. All but 4 of the 34 underwent brain MRI within 7 d of PET (the exceptions were due to early death or intracranial metallic substances). The MRI scan, coregistered to the PET scan, was used to accurately localize the discrete brain regions of interest (ROI). Of the remaining 30 patients, 7 were excluded from this analysis for the following reasons: a delay of greater than 5 d between the head injury and PET (1 patient), poor-quality MRI studies preventing coregistration (2 patients), significant head movement during PET scanning (2 patients), or a calibration error of the PET scanner (2 patients).
The final cohort included 23 patients with the following head-injury mechanisms: motor vehicle-related accidents (14 patients), falls (6 patients), or gunshot wounds (1 patient). The mechanism of injury was not known for the remaining 2 patients. Initial pupillary abnormality was observed in 8 of 23 patients. All patients had at least one of the following CT findings as evidence of traumatic injury: skull fracture (8 patients), epidural (3 patients) or subdural (9 patients) hematoma, subarachnoid (12 patients) or intraventricular (2 patients) hemorrhage, or cerebral contusion (14 patients). At the time of 18F-FDG PET, one or more of the following sedative or analgesic medications were used: propofol in 1 of 23 (6.9 μg/kg/min), midazolam in 13 of 23 (3.9 ± 3.1 [range, 1–12] mg/h), chlordiazepoxide in 1 of 23 (50 mg), morphine sulfate in 9 of 23 (3.2 ± 1.2 ([range, 2–5) mg/h, and fentanyl in 1 of 23 (500 μg/h). Seventeen healthy volunteers were recruited as control subjects (July 2000 to May 2001) and underwent similar 18F-FDG PET and MRI protocols with the exception that sedatives or analgesics were not used. The inclusion and exclusion criteria for recruitment were a volunteer age of 20–40 y, no prior history of head injury, no history of neurologic or psychiatric disease, and no current medication or drug known to affect cerebral metabolism. Six studies were not included in the analysis for the following reasons: inadequate MRI studies preventing coregistration (5 volunteers) or inappropriate preparation (fasting, 1 volunteer).
All study procedures were performed with informed consent and were approved by the UCLA Institutional Review Board and the UCLA Radiation Safety Office.
PET
Enteral and parenteral sources of glucose were withheld at least 4–6 h before the PET study. Patients supported on mechanical ventilation received neuromuscular paralytics in addition to morphine sulfate or a benzodiazepine. Nonintubated patients received either mild sedation (morphine sulfate, midazolam, or droperidol) or no additional medication. The lights in the room were dimmed, and the patients were kept in an unstimulated but awake state as much as possible. First, a transmission study was obtained for attenuation correction.
Dynamic acquisition of PET and serial arterial blood sampling were started immediately after an intravenous injection of 150–250 MBq of 18F-FDG. The acquisition protocol consisted of 18 frames (4 × 30 s, 4 × 120 s, and 10 × 300 s) with a total acquisition time of 60 min. The centrifuged plasma samples were analyzed in a γ-well counter for derivation of the arterial input curve.
All PET data were acquired with an ECAT HR+ (Siemens/CTI) in 3-dimensional acquisition mode. To minimize the effect of scatter originating outside the field of view, images were acquired after manual installation of a lead shield annulus (Neuro-Insert; CTI) with a 9-mm thickness and a 35-cm aperture diameter. The scanner has 32 rings yielding 63 planes covering a 15.5-cm axial field of view. The intrinsic spatial resolution of the scanner is 4.3 mm in full width at half maximum at the center of the central axis of the gantry.
Acquired image sets were reconstructed with filtered backprojection using a Hanning filter (cutoff frequency, 0.3 cycle per projection element) to generate 128 × 128 matrices. The spatial resolution of the resulting images was ∼5.5 mm in full width at half maximum. All dynamic scans were corrected for dead-time, attenuation (using a 10-min transmission scan obtained immediately before the dynamic studies), scatter, and decay before image reconstruction. Parametric images of metabolic rates for glucose (CMRglc; mg/100 g/min) were generated from the 18F-FDG dynamic images (30–60 min) and the arterial input curve using Patlak analysis (13,14).
For the calculation of CMRglc, we used different 18F-FDG lumped constant (LC) values for TBI patients and control subjects (0.44 and 0.66, respectively) (15). LC values were calculated from a larger cohort of TBI patients and control subjects (several of whom were included in the present study) using the equation:
 where Caglc is the arterial glucose plasma concentration and KFDG_Patlak the 18F-FDG net steady-state clearance (the product representing the cerebral uptake of 18F-FDG). CBF15O-water was CBF calculated from an H215O PET image acquired during the same PET session. The (A-V)glc represents the arteriojugular difference of whole-blood glucose concentration (which, multiplied by CBF, equals the CMRglc). Average values for TBI patients and control subjects were used. Because of inadequate H215O PET studies for several patients in the present study, unique trauma and control LC values could not be calculated and applied for the present cohort.
MRI Protocol, Image Coregistration, and ROI Identification
MRI used a 1.5-T magnet (Magnetom Vision; Siemens). The following sequences were performed on all patients and were used for analysis: axial T2*-weighted gradient-echo imaging, axial fluid-attenuated inversion recovery imaging, and coronal spoiled gradient-echo imaging. The MR images were coregistered to the set of 18F-FDG PET images (16). In brief, this algorithm involved convolving the MR image with a 3-dimensional point-spread function to generate a simulated PET image. A simple pixel-based intramodality registration algorithm was used to derive the transformation matrix, which was then applied to rotate the original MR image along a 3-dimensional axis. The adequacy of coregistration was assessed using the minimum mean square difference between all pixel values of the PET scan and the simulated PET image based on Powell’s algorithm for minimization (17,18). The coregistered MR images were then resliced into 63 planes to produce the same planes as for the 18F-FDG PET images.
ROIs were manually drawn on the resliced MR images to outline the following structures: striatum (caudate and putamen), thalamus, cerebellum, and brain stem (midbrain, pons, and medulla). ROIs were drawn using multiple MRI slices to define the volume of each anatomic region. Brain stem ROIs were drawn to exclude the cerebral and cerebellar peduncles. The midbrain was defined as the brain stem portion from the superior to the inferior colliculi, including a major part of the reticular activating system. The pons was defined as the brain stem from the level of the beginning of the cerebral aqueduct to the level of the rostral wall of the lateral recess of the fourth ventricle. The medulla was defined as the level including the inferior olivary nucleus (19). Practically, the rostral and caudal edge of the pons was first identified on the basis of anatomic information about the middle cerebellar peduncle and fourth ventricle. Planes for the midbrain and medulla were identified as brain stem areas rostral and caudal to the edge of each pontine plane, respectively. The caudal end of the medulla was determined as a caudal end of the inferior olivary nucleus, which was also shown with MRI as “surface swelling” (olive). In the cerebral cortex, ROIs were placed on cortical areas that appeared grossly normal on MRI. The ROIs were then applied to the corresponding parametric CMRglc PET images, and area-weighted averages were calculated to obtain the CMRglc value of each target region. In addition, a whole-brain ROI was drawn, again excluding hematomas and foci of contusion, and applied to determine the whole-brain CMRglc.
Assessment of Level of Consciousness
The level of consciousness was evaluated using the GCS (20). The initial (best) postresuscitation GCS (GCSini) was determined within 8 h from admission to the emergency room. GCS at the time of PET (GCSpet) was determined before the PET study. For patients mechanically ventilated, a verbal score of 1 was given. For studies in which the subjects were pharmacologically paralyzed or sedated at the time of the PET study, the GCS recorded by the examining physician on the morning rounds was used (each within 6 h of the PET study). The post-PET study GCS was reviewed in these patients to confirm that there was no significant change in the GCS. Patients who had a GCS of 8 or less at the time of PET were considered to be comatose in this study.
Statistical Analysis
Between-groups analysis of continuous variables was performed using the Student t test for comparison of 2 groups or by ANOVA for comparison of more than 2 groups. Noncontinuous variables between 2 groups were compared by the Mann-Whitney rank test. Correlations between regional CMRglc and GCS were performed using Spearman correlation coefficients. Statistical significance was set at P < 0.05.
RESULTS
Cohort Characteristics
The mean age of the 23 TBI patients studied was 44 ± 18 y (range, 17–81 y). Five of the patients were female. The mean interval between the time of head injury and 18F-FDG PET was 62 ± 30 h, and the range was 17–123 h. The mean age of the healthy volunteers did not differ significantly from that of the patients (36 ± 8 y). The healthy volunteer group included 4 women. The median GCSini and GCSpet were both 8 (range, 3–15). Thirteen patients had GCSpet ≤ 8 and were considered comatose during the PET scan. Table 1 compares the characteristics between comatose and noncomatose patients (Table 1). There was no significant difference in intracranial pressure, global CBF, arterial oxygen concentration, oxygen extraction fraction, initial CT findings, or sedatives or analgesics between comatose and noncomatose patients.
Comparison of Characteristics Between Comatose and Noncomatose Patients
Regional PET Parameters
Table 2 compares the KFDG_Patlak and CMRglc between patients and healthy volunteers for each regional structure. The KFDG_Patlak was lower by 30%–50% in regions of head-injured patients compared with the corresponding regions of healthy volunteers. All differences were statistically significant (P < 0.0001). The differences in CMRglc were smaller than KFDG_Patlak, ranging from 0% (brain stem) to 30% (thalamus). Significant differences in CMRglc were observed in striatum (P < 0.05) and thalamus (P < 0.05), whereas brain stem and cerebellar CMRglc did not differ significantly from those of healthy volunteers. Intragroup regional differences were greater in healthy volunteers, showing a 50% difference between the highest (striatum) and lowest (brain stem) brain regions, whereas the difference was 35% in patients with head injury (Table 2).
Summary of Regional PET Parameters
Regional CMRglc and GCS
Table 3 compares the CMRglc values between comatose and noncomatose patients. Comatose patients showed generally lower CMRglc values. In particular, CMRglc values in the thalamus (P < 0.05), brain stem (P < 0.01), and cerebellar cortex (P < 0.05) of comatose patients were significantly lower than those of noncomatose patients. Correlational analysis between regional CMRglc values and GCSini did not show a significant trend (Fig. 1A).
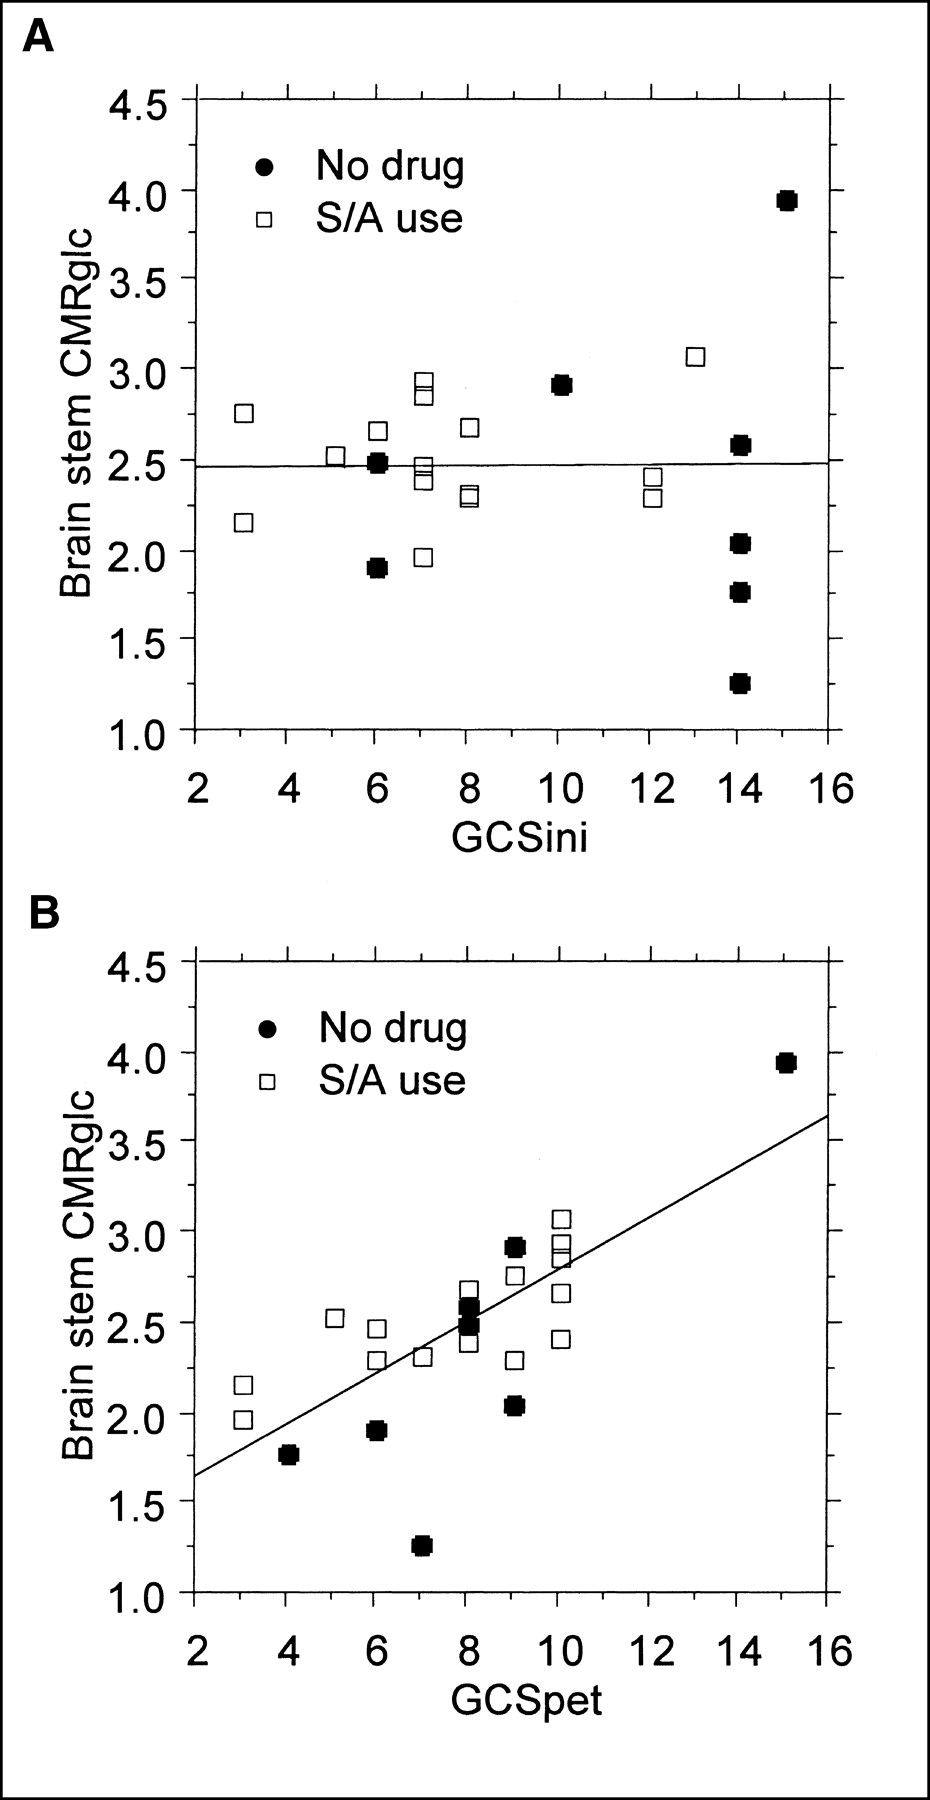
Correlation between brain stem CMRglc and GCSini (A) or GCSpet (B) in patients who did or did not use sedative/analgesic (S/A) drugs.
Comparison of Metabolic Rate of Glucose Between Comatose and Noncomatose Patients
Figure 2 presents an example of parametric images for CMRglc overlaid on MR images. CMRglc was globally lower in the comatose patient, showing clearly reduced CMRglc in thalamus, brain stem, and cerebellar cortex.
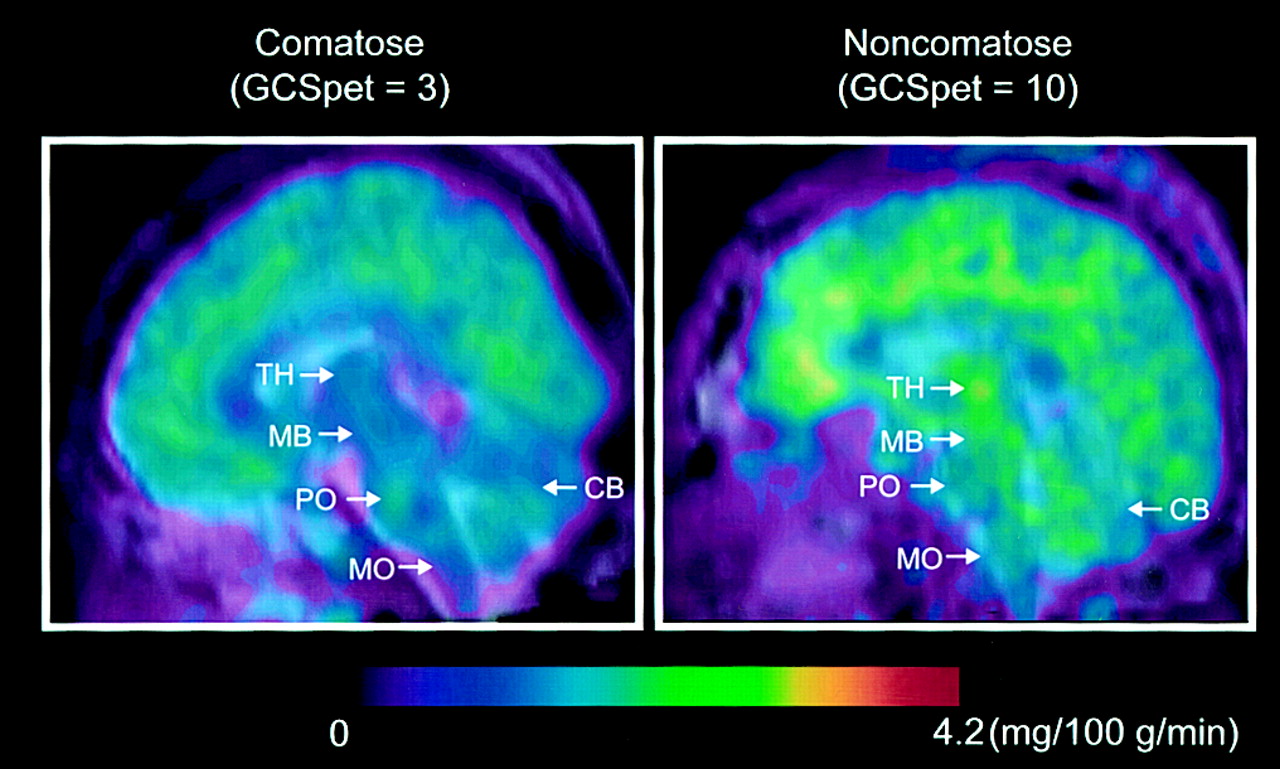
Example parametric images (sagittal view) for CMRglc were compared between comatose and noncomatose patients. Color scale is normalized to 4.2 mg/100 g/min. CB = cerebellum; MB = midbrain; MO = medulla oblongata; PO = pons; TH = thalamus.
A moderate to strong correlation was observed between regional CMRglc and GCSpet (Table 4). All Spearman correlations were significant, except for remote cortical areas. As shown in Figure 1B, the correlation appeared to be influenced by a single point from a patient with a GCSpet of 15. Excluding this data point resulted in a loss of statistical significance for the whole brain, remote cortex, and striatum (Table 4).
Spearman Rank Correlation Between Metabolic Rate of Glucose and GCS
Correlation with CT or MRI
Cerebral contusions were observed on the initial CT scans in 14 of 23 patients. All contusions were in the cerebral hemispheres and did not extend into the striatum, thalamus, brain stem, or cerebellum. The presence or absence of cerebral contusion did not correlate significantly with GCSini. The median GCSini of patients with and without contusions was 10 (range, 5–15) and 7 (range, 3–14), respectively (P = NS). Similarly, the GCSpet did not differ with respect to the presence of a cerebral contusion (both groups having a median GCSpet of 8). Comparing patients with and without cerebral cortex contusions, there was no appreciable difference in the brain stem CMRglc (mean ± SD of brain stem CMRglc was 2.4 ± 0.6 mg/100 g/min with contusion, 2.5 ± 0.3 mg/100 g/min without contusion, P > 0.05).
Based on MRI findings, evidence of shear-type injury (DAI) was observed in 15 of 23 patients. Using these anatomic imaging-based criteria, the presence of shear-type injury was significantly associated with poor GCSini: the median of GCSini was 7 (range, 3–14) with DAI versus 11 (range, 7–15) without DAI (P < 0.05). No similar association was seen with regard to GCSpet and DAI (GCSpet with DAI, 8 [range, 3–10]; GCSpet without DAI, 9 [range, 3–15] [P = NS]) or brain stem CMRglc and DAI (CMRglc with DAI, 2.4 ± 0.5 mg/100 g/min; CMRglc without DAI, 2.6 ± 0.6 mg/100 g/min [P = NS]). Three of the 15 patients with subcortical evidence of DAI also showed MRI findings suggesting brain stem injury. The GCSini and GCSpet of the 3 patients varied greatly (range, 3–14), whereas the brain stem CMRglc values were similar (2.1, 2.6, and 2.7 mg/100 g/min).
DISCUSSION
The present study revealed that, compared with the CMRglc of the remote cortex, striatum, or thalamus, the CMRglc of the brain stem was relatively unaffected by TBI. However, when individual values of regional CMRglc were plotted against posttraumatic level of consciousness, brain stem CMRglc demonstrated the strongest correlation with posttraumatic level of consciousness.
The pathophysiologic basis of the GCS is unknown. The present study demonstrated a significant association of glucose metabolism in the thalamus, brain stem, and cerebellum with GCS at the time of PET scanning, whereas no correlation was found with initial GCS. On the contrary, MRI findings suggestive of DAI were significantly associated with a lower GCSini. No similar association with DAI was found for GCSpet or brain stem CMRglc. Clinically, the initial GCS is considered to reflect the severity of the injury and is useful for predicting the outcome of the patients (21,22). In particular, a prolonged unconscious state after injury is considered to be a clinical sign of DAI (23,24). The lower GCSini in patients with positive MRI DAI findings in the present study may warrant this clinical sign. Unlike the MRI findings, PET CMRglc values significantly correlated with GCSpet but not with GCSini. Therefore, regional CMRglc may reflect concomitant neuronal function and is relatively independent of the initial anatomic damage. Previously, GCS was shown to correlate with the metabolic rate of oxygen (25). Glucose use, however, may not always be coupled with oxygen metabolism because altered metabolic states, including anaerobic glycolysis, may occur acutely after severe head injury (9,26,27).
The role of thalamus and brain stem glucose metabolism in the level of consciousness has been reported for PET experiments with healthy volunteers during general anesthesia or physiologic non-rapid-eye-movement sleeping (28–30). The mechanism affecting regional glucose metabolism is still unknown, but one speculation is that an activated γ-aminobutylic acid (GABA) system suppresses regional glucose metabolism. In fact, GABA receptor density is known to be higher in the cerebellar cortex, possibly explaining the significant difference in glucose metabolism between comatose and noncomatose patients. However, whether traumatic head injury activates the GABAnergic system is unknown. Recent animal experiments, by reporting a downregulation of GABA receptor density after traumatic head injury, did not support the hypothesis (31). In addition, GABA receptor density is relatively sparse in the thalamus and brain stem and therefore is unlikely to explain the difference in glucose metabolism observed in brain stem regions (32).
Unlike the GABAnergic system, various excitatory neurotransmitters have been reported to be released after TBI (33). In particular, activation of the cholinergic system has been reported in relation to unconsciousness. Using an animal concussive model and the autoradiographic technique, Hayes et al. found increased glucose uptake in the pontine cholinergic system (34,35). The result of the present study seems to agree with their finding in that we observed a generally depressed brain stem CMRglc in comatose patients. Unfortunately, we could not find a hot spot in substructures within the pons, possibly because of the spatial resolution of the clinical PET system.
This study supplements a previous study in which a dissociation was found between level of consciousness and global glucose metabolism (12). In contrast to the previous study, the present analysis observed a trend in correlation between level of consciousness and regional CMRglc. The apparent difference can be attributed partly to the different characteristics of the patient population. The present population did not include patients with global hyperglycolysis. In addition, the present study had only 1 patient with a GCS of 15, whereas the previous study had several GCS 15 patients, with a wide variety of CMRglc values. Also, the present study was more weighted to moderate injury. In fact, the previous study showed a trend in correlation when analyzed among patients with moderate injury. The reason for this possible injury severity-related correlation is not clear, although patients at the extremes (GCS 3 and 15) may exhibit floor-and-ceiling effects with respect to CMRglc that may mask the correlation existing in the moderate range.
The present study had several possible methodologic limitations. First, the absolute value of the CMRglc measurement depends on the value of the LC, for which a consensus has not been established for human brain. We used different pooled mean LC values for healthy volunteers (LC = 0.66) and TBI patients (LC = 0.40). Although the pooled TBI LC value that we used has not been validated by other investigators, the methodology is fundamentally similar to that used by other brain 18F-FDG PET investigators (36).
The LC value used for healthy volunteers in the present study was higher than the LC value of 0.42 adopted in our previous TBI studies using 18F-FDG PET (9,12,37). However, Hasselbalch et al. have suggested that the traditional value of 0.42 for LC may overestimate the CMRglc in the healthy population (38). They suggested that the error in the original estimation of the LC value (39,40) arose because the CMRglc was not measured directly. A recent study by Graham et al. likewise suggested the possible overestimation of CMRglc using an LC value of 0.42 (41). As noted in the Materials and Methods, we could not calculate individual global LC values for each subject in this study. A subsequent analysis doing so may be required with regard to the correlational analysis between CMRglc and level of consciousness.
The different LC values used (control vs. TBI) resulted in a smaller difference in CMRglc between healthy volunteers and TBI patients, although KFDG_Patlak was significantly lower for patients with TBI than for healthy volunteers in all regions investigated. Kinetic parameters, such as the KFDG_Patlak value determined by Patlak analysis, indicate the behavior of 18F-FDG in tissue that encompasses both glucose transporter density and hexokinase activity. Further analysis of the kinetic parameters using other modeling techniques may better describe the behavior of 18F-FDG in human brain after TBI and possibly indicate whether the value of LC is regionally heterogeneous.
In the present study, we observed a global reduction of CMRglc, but regional differences were seen in only the striatum and thalamus. In particular, average CMRglc values of brain stem regions in TBI patients were similar to those in healthy volunteers. Unfortunately, we could not determine whether regional changes in the LC value occurred after TBI, although our preliminary kinetic modeling did not support a significant regional variability in the LC value (42).
Another possible limitation of our methodology was that the regional CMRglc values were not independent, showing significant correlations among different structures. In particular, CMRglc of brain stem strongly correlated with that of other areas, resulting in a relatively lower and nonsignificant partial correlation coefficient. Therefore, although Spearman correlation was high in the brain stem, this finding does not imply the brain stem to be a single independent region that is responsible for the level of consciousness. The results should rather be interpreted as showing a correlation between CMRglc of the brain stem together with other areas and GCSpet.
Our analysis was done with and without inclusion of the sole patient with a GCS of 15. Our intention was to verify that the correlations were maintained even without this single data point (Fig. 1). Aside from having a GCS of 15, the patient was otherwise unremarkable compared with the others studied. He was a 45-y-old man who sustained a head injury from a fall approximately 2 d before the PET scan. He had a cerebral contusion but no evidence of DAI.
The use of sedatives or analgesics in the TBI patients may limit the validity of comparison with healthy, unmedicated subjects. Among 15 patients on medication in the present study, midazolam was used in 13 patients and morphine was used in 9 patients (8 patients received both medications). Previous studies reported a 20% decrease in CMRglc with diazepam and a 5%–15% decrease with morphine from normal awake conditions (43,44). It is not clear whether these drugs reduce CMRglc to a similar degree in the acute posttraumatic state when CMRglc is depressed at baseline. Therefore, we have no way of determining if the correlation between GCS and CMRglc was significantly affected by medications in this limited study. Other differences in clinical characteristics may cause a bias in the study population. In the present study, there was no significant difference in intracranial pressure, global CBF, arterial oxygen concentration, oxygen extraction fraction, initial CT findings, or sedatives or analgesics between comatose and noncomatose patients.
Lastly, the GCS may not be the best determinant of the level of consciousness because it is not parametric, is somewhat subjective, is affected by medications, and is inaccurate because of lack of verbal score. However, the present study suggests that the score reflects the metabolic activity of the brain stem and cerebellar cortex. Considering the anatomic location of the reticular activating system, the present observations may give a theoretic background to support GCS as an index of level of consciousness.
CONCLUSION
A PET investigation using 18F FDG demonstrated a significant difference in glucose metabolism of the thalamus, brain stem, and cerebellum between comatose and noncomatose patients acutely after TBI. The metabolic rate of glucose in these regions correlated significantly with the level of consciousness.
Acknowledgments
This study was supported by grant 30308 from the National Institutes of Neurological Disorders and Stroke, by grants DE-FC03-87ER630615 and DE-FC03-02ER63420 from the U.S. Department of Energy, and by the Lind-Lawrence Foundation.
Footnotes
Received Feb. 25, 2003; revision accepted Jun. 13, 2003.
For correspondence or reprints contact: Naoya Hattori, MD, PhD, Box 956948, Los Angeles, CA 90095-6948.
E-mail: nhattori{at}mednet.ucla.edu
REFERENCES
In this issue


Jump to section
Related Articles
Cited By...
- Resting brain activity in disorders of consciousness: A systematic review and meta-analysis
- The collective therapeutic potential of cerebral ketone metabolism in traumatic brain injury
- The pathophysiology of traumatic brain injury at a glance
- Acute Changes in Regional Cerebral 18F-FDG Kinetics in Patients with Traumatic Brain Injury