


Abstract
Substituted benzamides such as 11C-raclopride or 123I-iodobenzamide are selective radiotracers for PET and SPECT imaging of D2-like dopamine (DA) receptors. 18F-Desmethoxyfallypride (18F-DMFP) is a benzamide tracer with the advantage of an 18F label. We optimized the synthesis and evaluated 18F-DMFP in PET studies on healthy human volunteers. Methods: The affinity of DMFP for D2-like DA receptors was characterized in vitro using membrane preparations from rat striatum and the DA receptor ligand 3H-spiperone. PET studies on 10 healthy human volunteers were performed using a whole-body PET scanner after injection of 214 ± 54 MBq (mean ± SD) 18F-DMFP. Brain images were acquired dynamically over 124 min, and metabolite-corrected plasma activity was used as the input function. Data analysis was performed using several different approaches (compartmental, graphical, equilibrium methods). Results: The mean inhibition constant (Ki) of DMFP was 15 ± 9 nmol/L. In human brain, the striatum-to-cerebellum ratio reached a maximum of about 4 between 60 and 120 min. When specific binding in the striatum was expressed as the difference between binding in the striatum and the cerebellum, it reached a maximum at approximately 60 min after injection and remained almost constant until the end of data acquisition. The ratio of specific striatal to nonspecific cerebellar binding was about 3:1 at 120 min after injection. A small, but significant specific tracer binding could also be detected in the thalamus. Treatment of a schizophrenic patient with a high dose (1,000 mg/d) of another substituted benzamide, amisulpride, resulted in a reduction of specific tracer uptake of about 90% in striatal regions. With regard to measured distribution volumes and binding potentials, there was an excellent agreement between all applied analytic methods. Conclusion: Our study demonstrates that 18F-DMFP is a highly reliable tracer for PET imaging of D2-like DA receptors. It offers the major advantage that it can be used independently of an on-site cyclotron within a PET satellite network. Noninvasive analytic methods without blood sampling provide valid measurements of receptor quantities in human striatum. Because of the 18F label and the favorable imaging properties, 18F-DMFP could become an efficient substitute for 11C-raclopride in a clinical context.
The D2-like dopamine (DA) receptor was the first neuroreceptor to be visualized by PET, with 3-N-11C-methylspiperone (11C-NMSP) as the radiotracer (1–3). Subsequently, 11C-raclopride, a substituted benzamide radioligand, was developed for quantification of D2-like DA receptors (4). Whereas 11C-NMSP binds not only to D2-like DA receptors but also to 5-hydroxytryptamine-2A and α1-receptors to a considerable extent (5,6), 11C-raclopride has the advantages of selective binding to D2-like DA receptors and a relatively easy tracer kinetic modeling. Substituted benzamide neuroleptics are a group of D2-like DA receptor antagonists, which share their high affinity and selectivity for those receptors. 123I-Iodobenzamide (123I-IBZM) is an established benzamide tracer for selective labeling of D2-like DA receptors with SPECT (7). Recently, the benzamide ligands 123I-NCQ 219 (epidepride) (8) and 11C-FLB 457 (9) have been labeled for use with SPECT and PET, respectively, for visualization and quantification of extrastriatal DA receptors.
Substituted benzamides with an 18F label are currently being developed for broader clinical use. The 18F label offers the advantage of a longer half-life compared with the 11C label of, for example, 11C-raclopride. This can also allow an increase in time of follow-up examinations after pharmacologic challenges. Two of the most promising 18F-labeled benzamide radiotracers are 18F-fallypride (N-[(1-allyl)-2-pyrrolidinyl)methyl]-5-(3-18F-fluoropropyl)-2,3-di- methoxybenzamide; 18F-FP) and 18F-desmethoxyfallypride ((S)-N-[(1-allyl)-2-pyrrolidinyl)methyl]-5-(3-18F-fluoropro- pyl)-2-methoxybenzamide; 18F-DMFP), with 18F-FP having a higher affinity for D2-like DA receptors (50% inhibitory concentration [IC50], 0.6 nmol/L vs. 15.0 nmol/L) (10). In monkey studies, both tracers have proven to be receptive for amphetamine-induced changes in synaptic DA levels (11,12). Here we report on the first 18F-DMFP PET studies in humans and our efforts to describe the tracer’s behavior in brain with a variety of different analytic methods.
MATERIALS AND METHODS
18F-DMFP was synthesized via direct fluorination of a tosylated precursor, ((S)-N-[(1-allyl)-2-pyrrolidinyl)methyl]-5-(3-toluenesulfonyloxy-propyl)-2-methoxybenzamide. It was obtained according to a method described in the literature (10,12). Modifications of the published method led to a much higher yield and simultaneously simplified the purification. Through these modifications it became possible to prepare the precursor of 18F-DMFP on a larger scale.
The tosylated precursor (5 mg, 10 μmol) was dissolved in 1 mL acetonitrile, treated for 5 min at 65°C with potassium carbonate (5 mg, 36 μmol), and subsequently transferred into a 5-mL vial containing 18F-fluoride using the method proposed by Hamacher et al. (13). The 18F-fluoride was delivered from other cyclotron centers with transport periods ranging from 2 to 4 h. The reaction mixture was heated for 20 min at 85°C, diluted with 1 mL phosphoric acid (10%), and separated using high-performance liquid chromatography (HPLC) (250 × 10, RP8, CH3CN:0.25 mol/L ammonium acetate buffer + 5 mL acetic acid/L 30:70, 5 mL/min). The fraction containing 18F-DMFP was isolated, diluted with 0.15 mol/L disodium hydrogen phosphate buffer, and adsorbed on a C18 cartridge to remove the HPLC solvent. The column was washed with 2 mL water and eluted with 1 mL ethanol. The elute was diluted with 9 mL of an isotonic NaCl solution and sterilized by filtration. Before injection, quality was controlled, which included determination of chemical and radiochemical purity, specific activity, pH, and absence of pyrogens. The volume of 18F-DMFP injected as an ethanol:water mixture (1:9) was 5 ± 1 mL.
The specific activity was analyzed by means of the same HPLC using the calibrated fluoro-DMFP ultraviolet intensity. The specific activity at the time of injection ranged from 37 to 834 GBq/μmol (mean ± SD, 295 ± 265 GBq/μmol). Accordingly, the injected tracer mass for all studies was <1 μg.
The binding of DMFP was characterized in vitro using membrane preparations from rat corpus striatum and the DA receptor ligand 3H-spiperone using a published method (14) with slight modifications. Tissue was homogenized in 50 vol of 50 mmol/L Tris-HCl buffer, pH 7.4, containing 0.32 mol/L sucrose. Membranes were prepared by differential centrifugation. The final pellet (40,000g) used for in vitro binding was stored frozen (−20°C).
After thawing, the pellet was resuspended (5 mg original wet weight per mL) in 15 mmol/L Tris-HCl buffer, pH 7.4, containing 120 mmol/L NaCl, 5 mmol/L KCl, 2 mmol/L CaCl2, and 1 mmol/L MgCl2. In the binding assays tubes were filled with 0.9 mL membrane suspension, 50 μL DMFP solution (final concentration, 10–100 nmol/L) or distilled water, 25 μL distilled water, or, for determination of nonspecific binding, 50 μmol/L (+)-butaclamol (final concentration, 1 μmol/L) and 3H-spiroperidol (specific activity, 851 GBq/mmol; Amersham, Braunschweig, Germany). After a 30-min incubation at 30°C, 5 mL Tris buffer were added and the suspension was filtered under vacuum through GF/C filters (Whatman, Ann Arbor, MI) using a 24-manifold filtration apparatus. After 2 rinses of the same buffer, filter-bound radioactivity was determined by liquid scintillation counting. Each determination was run in duplicate.
The study was approved by the local ethics committee in Mainz, Germany, and the German radiation safety authorities. PET studies were performed on 10 healthy male volunteers (age range, 24–44 y; mean age ± SD, 31 ± 6 y), who gave written informed consent to participate in the study. Additionally, to demonstrate blockade of specific 18F-DMFP binding by DA receptor antagonists, we studied a schizophrenic patient, who was treated with a high dose (1,000 mg/d) of another substituted benzamide, amisulpride, which also binds selectively to D2 and D3 DA receptors. This patient had been on an amisulpride monotherapy for 6 wk, and the dose had been kept stable for at least 4 wk. The patient had not been treated with depot neuroleptics for at least 6 mo. Informed consent was also obtained from this patient.
Data Acquisition
Images were acquired on a Siemens ECAT EXACT whole-body PET scanner. The camera has a field of view of 16.2 cm in 47 planes with a plane spacing of 3.375 mm, an axial resolution of 4.6-mm full width at half maximum, and an in-plane resolution of 6.0 mm (resolution in center with scanner in 3-dimensional [3D] mode). Data acquisition comprised of a series of 28 time frames. The scan duration increased progressively from 1 min to 10 min (4 scans of 1 min, 3 scans of 2 min, 3 scans of 3 min, 15 scans of 5 min, 3 scans of 10 min), resulting in a total scanning time of 124 min. A 20-min transmission scan using a 68Ge source was obtained before each study for subsequent attenuation correction.
A mean of 214 ± 54 MBq (mean ± SD; range, 157–308 MBq) 18F-DMFP was injected intravenously as a bolus into a cubital vein over approximately 30 s. Plasma samples for determination of the kinetics of total plasma radioactivity and labeled metabolites were obtained from a radial artery according to the following protocol: continuous sampling for the first 2 min, 1-min intervals up to 5 min after injection, 2½-min intervals up to 10 min after injection, 5-min intervals up to 20 min after injection, and 10-min intervals up to 120 min after injection. Blood samples were immediately centrifuged, and plasma radioactivity was counted in a γ-scintillation spectrometer.
The positioning of the head in the scanner was parallel to the canthomeatal line. In the healthy volunteer, a T1-weighted 3D gradient echo magnetic resonance (MR) scan with 1.5-mm slice thickness and 128 slices was acquired. The MR scan was resliced according to the anterior commissure–posterior commissure (ac–pc) line, which was identified on a midsagittal plane. The PET images were then coregistered with the resliced MR images for accurate anatomic positioning of regions of interest (ROIs) using the Automatic Image Registration (AIR) algorithm (15). Polygonal ROIs were drawn on planes, where the respective regions (cerebellum, thalamus, putamen, caudate nucleus) have maximal areas. The thalamus was chosen as a region for analysis of binding to extrastriatal DA receptors, because this structure is easily identifiable on MR images and its size minimizes possible partial volume effects. Also, the thalamus has been demonstrated to contain a considerable amount of D2-like DA receptors at least in the rat (16). ROIs were drawn bilaterally and subsequently averaged. For the subsequent analyses, the cerebellum was chosen as a reference region, because it is generally considered to be DA receptor free.
Plasma Metabolite Studies
Blood samples of 2.5 mL for determination of labeled metabolites were withdrawn from the radial artery at the time points 2, 5, 10, 20, 30, 40, 60, 90, and 120 min after injection. The samples were centrifuged for 10 min at 5.5g. One-half milliliter acetonitrile was added to aliquots of 0.5 mL plasma for precipitation, and the resulting mixtures were centrifuged again for 10 min at 5.5g. Aliquots of 10–30 μL of the supernatant were transferred on silica gel 60 plates (Merck, Darmstadt, Germany) for thin-layer chromatography (methanol:ethyl acetate, 1:1). Activity distribution was detected using an Instant Imager (Canberra-Packard, Dreieich, Germany) with Rf values of 0.4–0.5 for 18F-DMFP and 0–0.1 for polar metabolites.
Data Analysis
Volumes of distribution (VDs) or binding potentials (BPs) were calculated with graphical, compartmental, and equilibrium methods. Here we report on the results obtained with 6 analytic methods.
Kinetic Analysis Invasive (Single- and 2-Tissue-Compartment) Models.
Both single-tissue (3 parameter) and 2-tissue (5 parameter) models were applied to fit the measured data (17–20). For the single-tissue, 2-compartment, 3-parameter model, the tissue concentration Ct is related to the metabolite-corrected plasma concentration CP according to the equation Ct(t) = K1CP(t) ⊗ exp(−k2t), and the measured radioactivity concentration within an ROI, CROI, is assumed to be equal to Ct + VPCP, where K1 is the unidirectional transport rate constant of tracer across blood–brain barrier from vascular space to tissue (mL/min/mL), k2 is the rate constant for efflux (1/min), and VP (mL/mL) is the fractional plasma volume in vascular space. After obtaining the parameters K1, k2, and VP, the VD can be calculated as VD = K1/k2. From the VDs determined, BPs for specific brain regions can be calculated as:
 The 2-tissue, 3-compartment, 5-parameter model is described by the equations:

 Here, the measured radioactivity concentration within an ROI, CROI, is assumed to be equal to CNS+F + CB + VPCP, where K1 (mL/min/mL) is the transport rate constant from the plasma compartment to the free plus nonspecific binding compartment, k2 (1/min) is the efflux rate from the free plus nonspecific binding compartment, k3 (1/min) is the transport rate constant from the free plus nonspecific binding compartment to the specific binding compartment, k4 (1/min) is the inverse rate constant from the specific binding compartment to the free plus nonspecific bonding compartment, and VP (mL/mL) is the fractional plasma volume in vascular space. CNS+F and CB are the concentrations in the free plus nonspecific compartment and specific bound compartment, respectively. By assuming that K1/k2 estimated from the reference tissue cerebellar time–activity curve using single-tissue compartmental analysis is the same as in the target tissue, the model parameters of the 3-compartment model can be estimated by fixing the K1/k2 value during nonlinear fitting. The VD and BP values are then estimated as VD = (K1/k2)(1 + k3/k4) and k3/k4 after model fitting, respectively.
Logan Plot with Arterial Blood Sampling.
Plots of ∫0t ROI(t)dt/ROI(t) versus ∫0t CP(t)dt/ROI(t) (where ROI and CP are functions of time describing the variation of tissue radioactivity in the ROI and plasma radioactivity, respectively) are generated from the time–activity data in striatal regions, thalamus, cerebellum, and plasma (21). The slope of the linear portion of the plot for the cerebellum represents a = K1/k2, and the slope of the linear portion of the plots for the striatal and thalamic regions represents b = K1/k2(1 + k3/k4), with K1 being a delivery rate constant and k2, k3, and k4 being first-order kinetic rate constants. The BP k3/k4 is then equal to b/a − 1.
Logan Plot with Reference Region.
Logan et al. (22) described a noninvasive graphical method for estimation of the distribution volume ratio, DVR, from which the BP can be calculated by the equation BP = DVR − 1. Under the assumption that CRF(t)/CRC(t) becomes reasonably constant for a sufficiently long period of time over the course of the scanning period, knowledge of the transfer constant from tissue to plasma in the reference tissue k′2 is not necessary, and then the DVR can be estimated from the slope of the linear portion of the plot of ∫0t CRC(t)dt/CRC(t) versus ∫0t CRF(t)dt/CRF(t) (where CRC and CRF are functions of time describing the variation of tissue radioactivity in receptor-containing and receptor-free regions, respectively).
Lammertsma Simplified Reference Tissue Model.
A simplified reference tissue model was applied to estimate BP according to the following equation (23):
 where CRC is the tissue radioligand activity in the receptor-containing ROI, CRF is the tissue radioligand activity of 18F-DMFP in the reference tissue (cerebellum), k2 is the rate constant for transfer from the free compartment to plasma, R1 is the influx rate constant (K1) ratio for target region versus reference region, and t is time. The parameters R1, k2, and BP (k3/k4) were estimated with a nonlinear least-square minimization procedure.
Transient Equilibrium Model.
Under the assumption that tissue radioligand activity in the nondisplaceable compartment is the same in reference and receptor-containing tissues, the tissue radioligand activity bound to receptors C3(t) equals the difference CRC(t)–CRF(t) (24). When C3(t) is plotted and a curve is fitted to these data, at the peak of this curve, dC3(t)/dt = 0 (the point of peak equilibrium); thus, C3(t)/CRF(t) = BP = k3/k4.
Statistical Analysis
Group comparisons were performed by the Mann–Whitney U test. Correlations between the various analytic methods were tested using the Spearman rank order correlation (rs). The level of significance was set at α = 0.05.
RESULTS
Chemistry
The synthesis of 18F-DMFP consists of 2 main steps: the synthesis of (S)-N-allyl-2-aminomethylpyrrolidine and the formation of the tosylated precursor, ((S)-N-[(1-allyl)-2-pyrrolidinyl)methyl]-5-(3-toluensulfonyloxy-propyl)-2- methoxybenzamide. For the synthesis of (S)-N-allyl-2-aminomethylpyrrolidine, a stereo-conservative route first described by Högberg et al. (25) was applied. For this 3-step process the workup has been simplified and yields were improved. The crude product of the first step could be used without further purification as educt for the second step. However, through a higher concentration of sodium dihydrido-bis(2-methoxyethoxo)-aluminate (SDMA) in the third step, much higher yields of (S)-N-allyl-2-aminomethylpyrrolidine could be obtained. Further studies showed that, by using N,N,N′,N′-tetramethyl(succinimido)uronium tetrafluoroborate (TSTU) instead of dicyclohexylcarbodiimide (DCC) for coupling the (S)-N-allyl-2-aminomethylpyrrolidine and the 2-methoxy-5-(3-hydroxypropyl)benzoic acid, the product could be purified through an easy extraction system (10). These modifications of the synthesis led to a 4-fold overall yield.
For the optimization of the 18F fluorination, different reaction parameters such as solvents, reaction temperatures, and phase transfer catalysts were examined. The highest radiochemical yields of 30%, comparable with that reported in the literature (12), were achieved using acetonitrile as the solvent and Kryptofix 2.2.2. (Merck, Schuchardt, Germany) as phase transfer catalyst at a reaction temperature of 85°C and a reaction time of about 20 min. Varying the precursor concentration improved the radiochemical yield only slightly. However, the addition of potassium carbonate (36 μmol/mL) to the precursor (10 μmol/mL) led to drastically increased radiochemical yields of 80% ± 10%.
In Vitro Studies
In vitro binding studies using variable concentrations of 3H-spiperone (0.05–2.5 nmol/L) and 0–50 nmol/L of the macroscopic (natF) DMFP revealed competitive inhibition. The mean inhibition constant (Ki) of DMFP calculated from 4 independent experiments was 15 ± 9 nmol/L.
PET Studies in Humans
Plasma Metabolite Studies.
The metabolism of 18F-DMFP was relatively slow. At 120 min after tracer injection, >50% of the injected ligand was found unchanged in arterial plasma (Fig. 1).
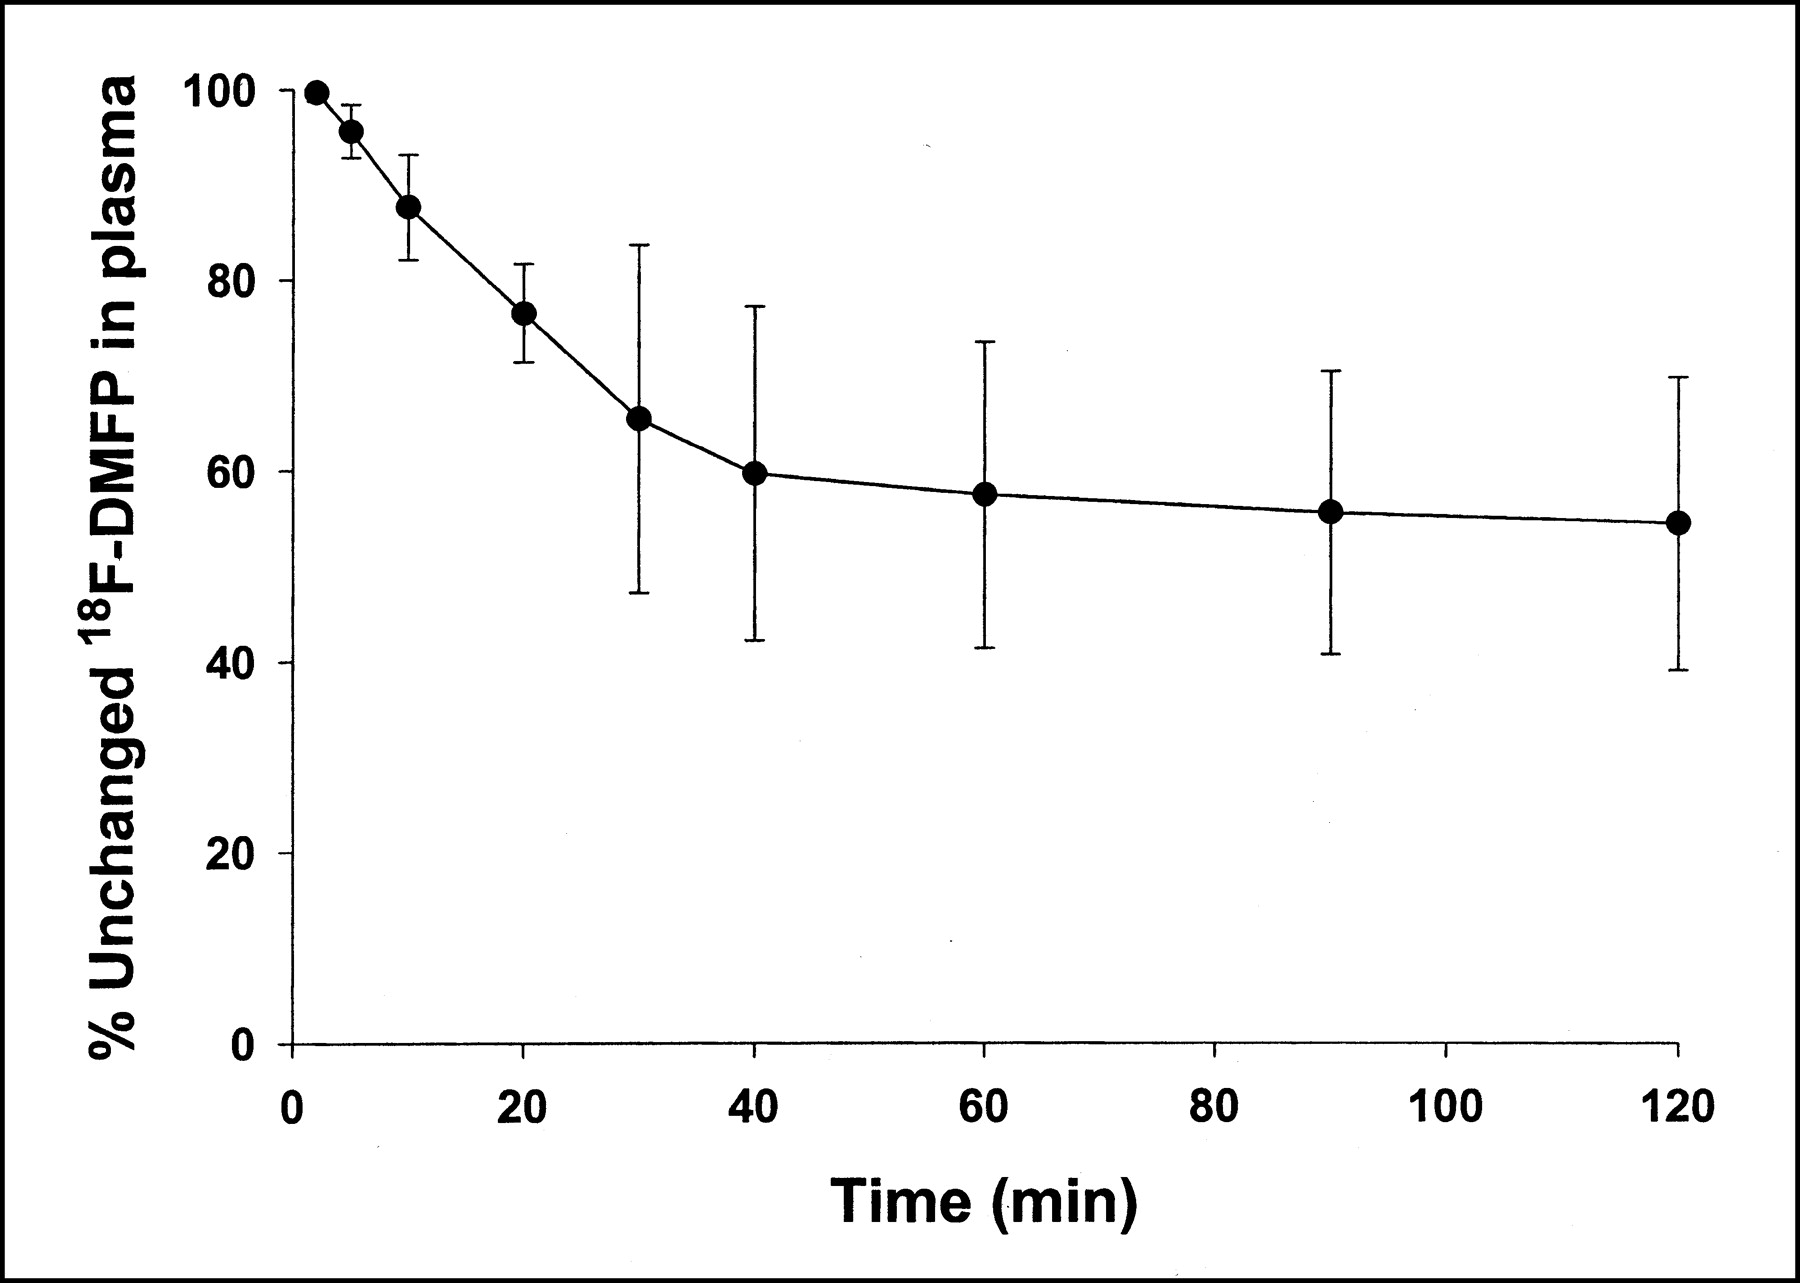
Fraction of unchanged 18F-DMFP over scanning time of 124 min (n = 10; mean ± SD).
By means of thin-layer chromatography, the metabolites were determined to be polar in nature. Rf values were 0.45 (5) for 18F-DMFP and 0.10 (5) for the metabolite(s). Figure 2 demonstrates typical chromatograms 10 and 60 min after injection (Fig. 2 top and Fig. 2 bottom, respectively). Because it is well justified to assume that the polar metabolites are not able to cross the blood–brain barrier, the number of metabolites and chemical identity were not determined.
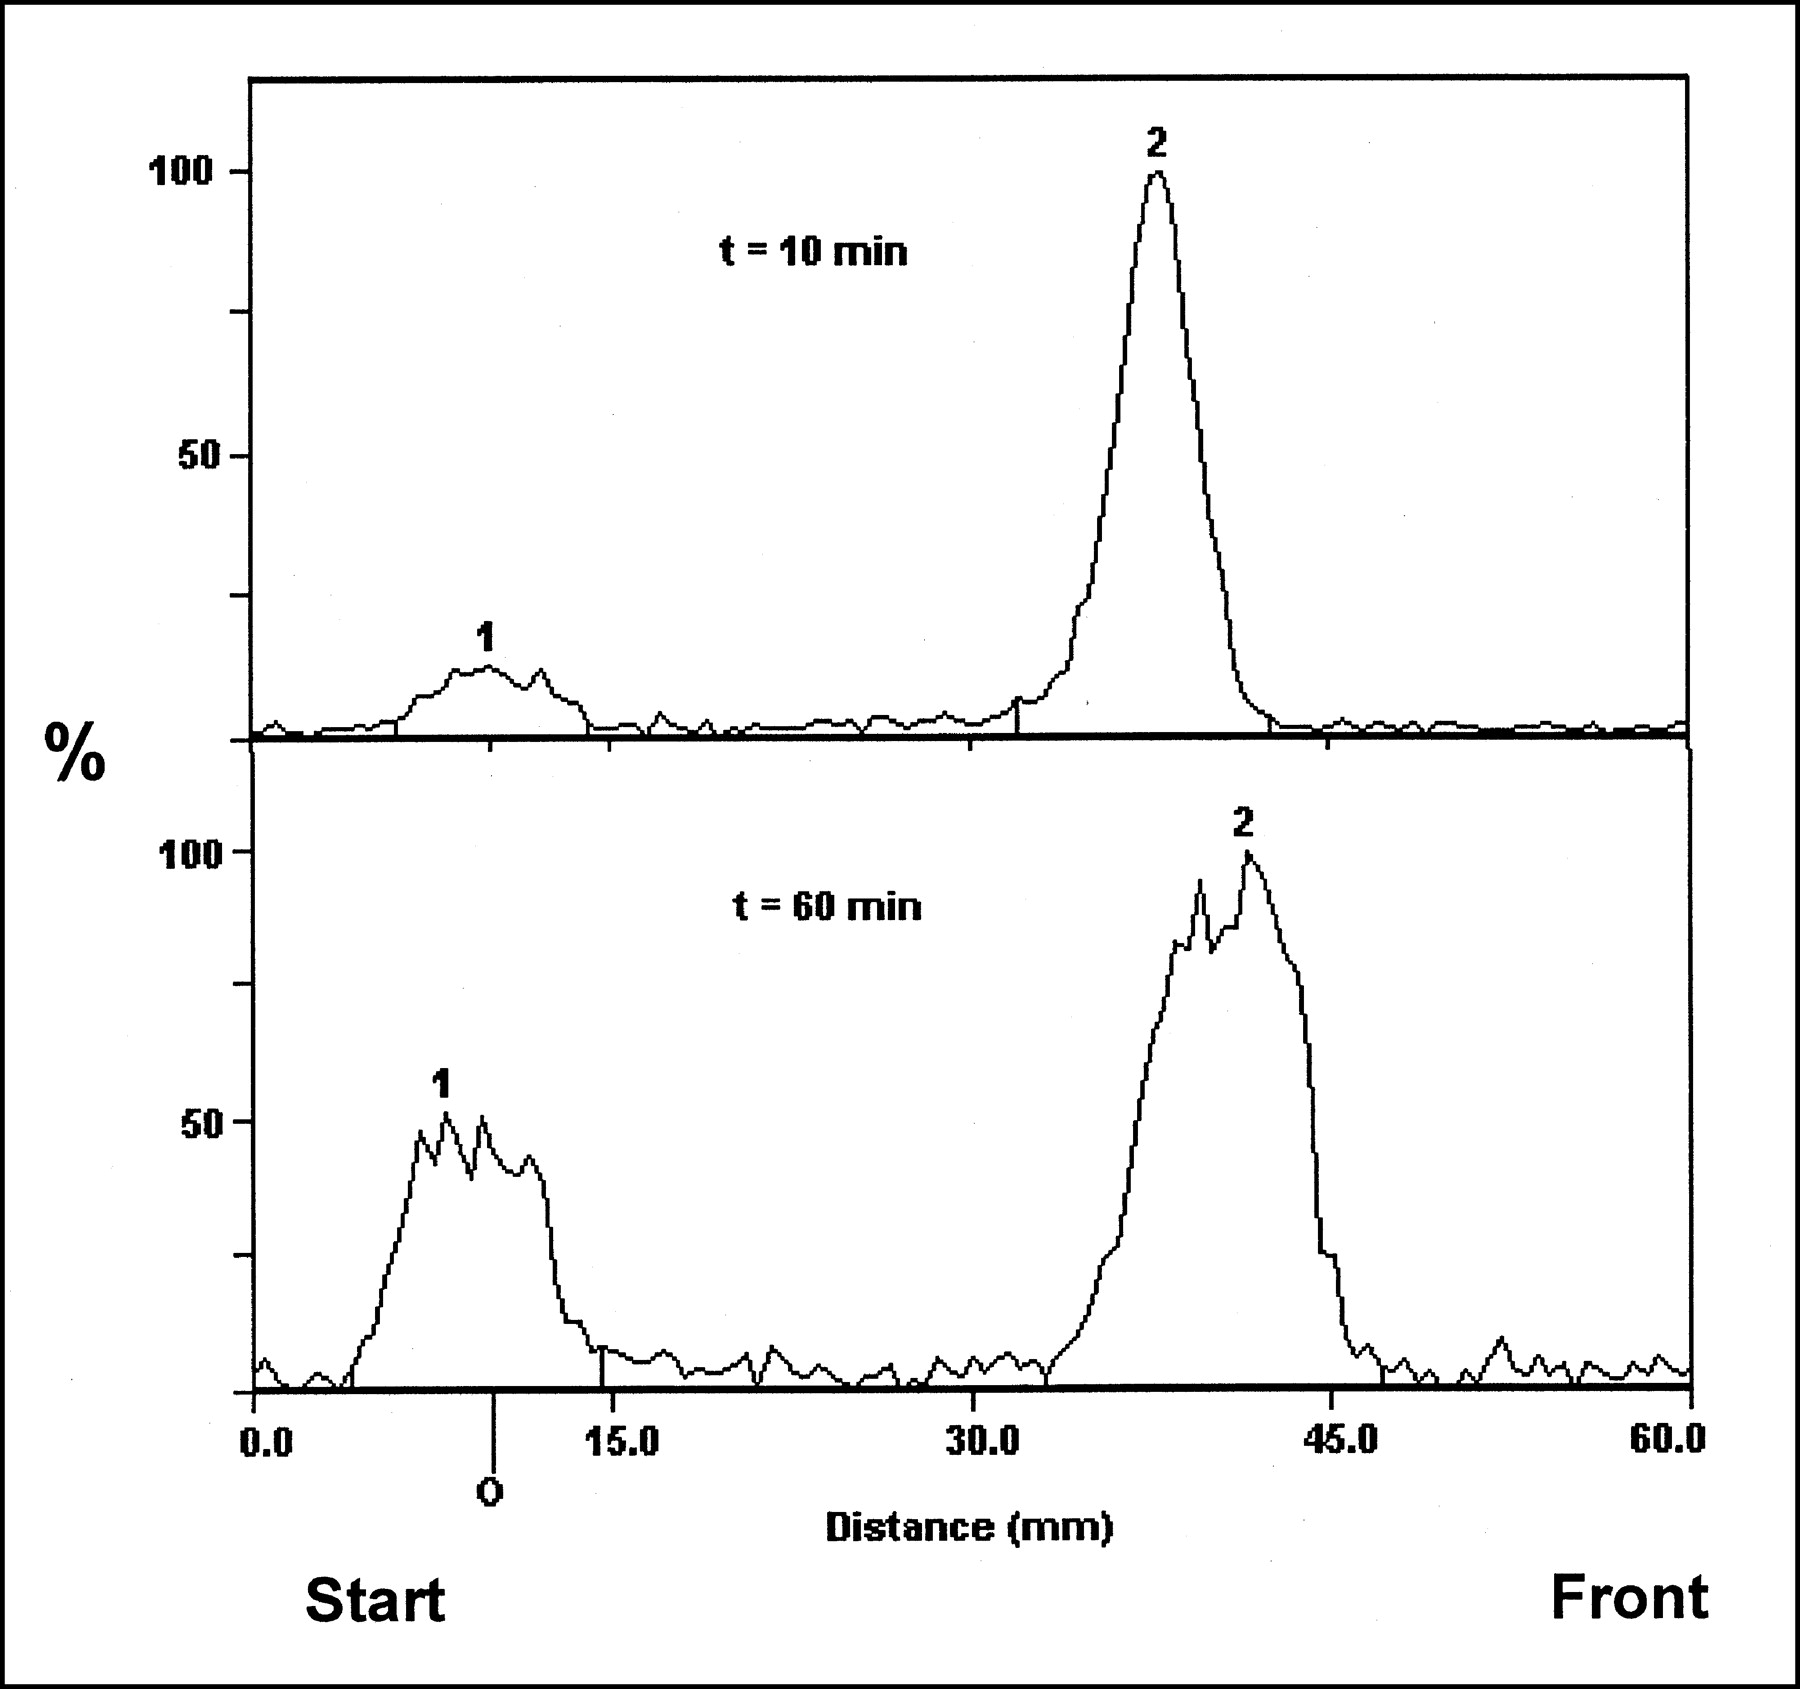
Typical thin-layer chromatograms for 18F-DMFP and metabolite(s) 10 min (top) and 60 min (bottom) after injection, respectively. 1 = Metabolite; 2 = intact 18F-DMFP.
PET Imaging.
In human brain, tracer uptake was rapid and high, reaching a maximum in striatal regions at about 30 min (Fig. 3). The striatum-to-cerebellum ratio reached a maximum of about 4 between 60 and 120 min. When specific binding was expressed as the difference between binding in the striatum and in the cerebellum, a region where the density of D2-like DA receptors was assumed to be negligible, it reached a maximum at about 60 min after injection and only slightly decreased thereafter. The ratio of specific striatal to nonspecific cerebellar binding was about 3:1 at 120 min after injection (Fig. 3). A small, but significant, specific tracer binding could also be detected in the thalamus (Fig. 3). Radioactivity accumulation in this region with a considerable amount of extrastriatal D2-like DA receptors was consistently about 20% higher than that in the cerebellum.

Typical set of time–activity curves in putamen (▴), thalamus (▪), and cerebellum (•) with fitted curves (solid lines) obtained in healthy human volunteer. Dashed lines represent specific binding in putamen (long dashes) and in thalamus (short dashes), when specific binding in these structures is expressed as difference between total binding in structure and cerebellum. From 3-compartment, 5-parameter model, rate constants in putamen in this subject were determined as follows: K1 = 0.405 mL/min/mL; k2 = 0.077/min; k3 = 0.862/min; k4 = 0.338/min.
Treatment of a schizophrenic patient with a high dose (1,000 mg/d) of the selective D2 and D3 DA receptor antagonist, amisulpride, resulted in a markedly reduced specific tracer uptake in striatal regions (Fig. 4).

Time–activity curves in putamen (▴) and cerebellum (•) with fitted curves (solid lines) obtained in schizophrenic patient, who was treated with benzamide antipsychotic amisulpride (1,000 mg/d), which is also highly selective for D2 and D3 DA receptors. Dashed line represents specific binding in putamen, when specific binding in this structure is expressed as difference between total binding in structure and cerebellum. In this patient, scan duration was just 90 min.
Quantitative Binding Analyses.
Results of the various analytic approaches for quantification of specific 18F-DMFP binding to D2 and D3 DA receptors are summarized in Table 1. Correlations between the gold standard 3-compartment model and various invasive and noninvasive other analytic methods as well as a comparison between the 2 most commonly applied noninvasive methods (reference tissue model and transient equilibrium model) are shown in Figures 5 and 6.
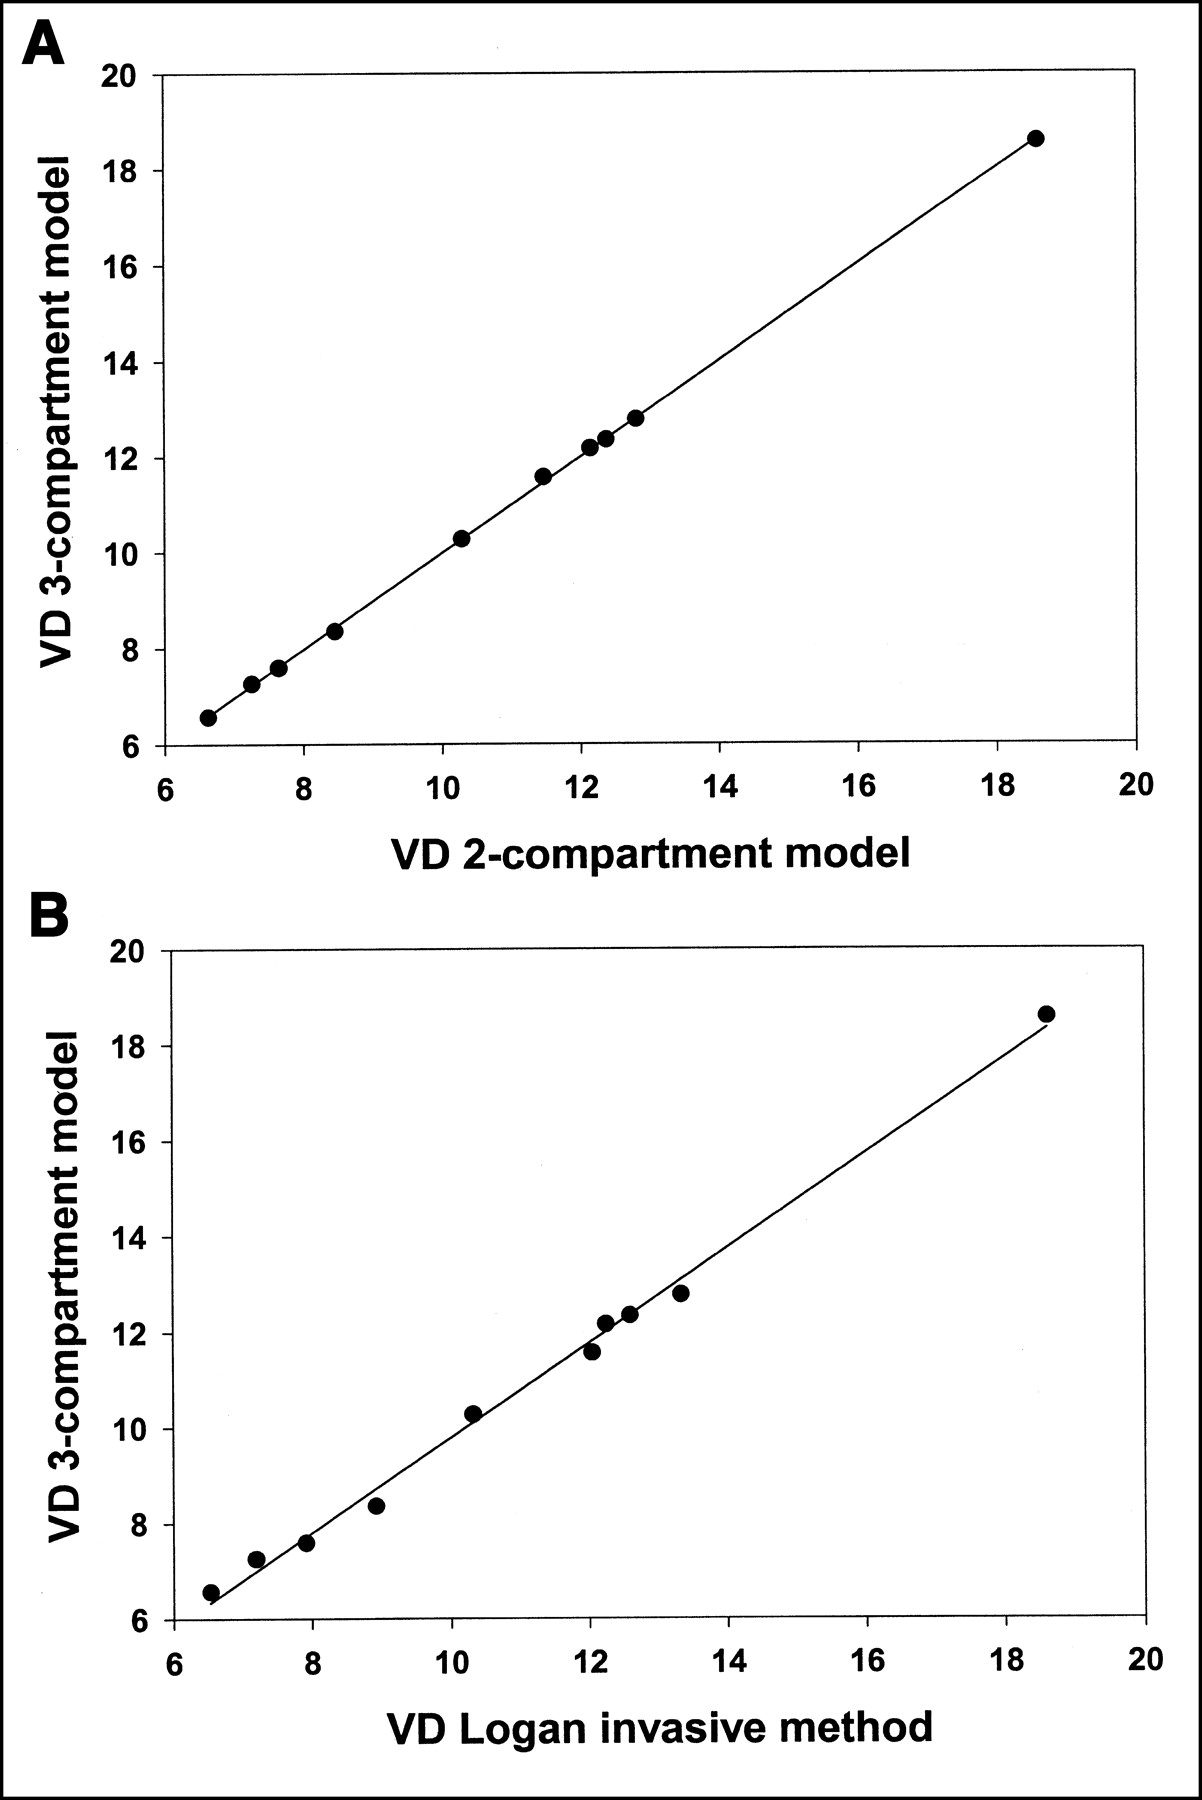
Correlations between VDs as determined with 3-compartment model and 2-compartment model (A) as well as between VDs as determined with 3-compartment model and Logan plot with arterial blood sampling (Logan invasive method; B).

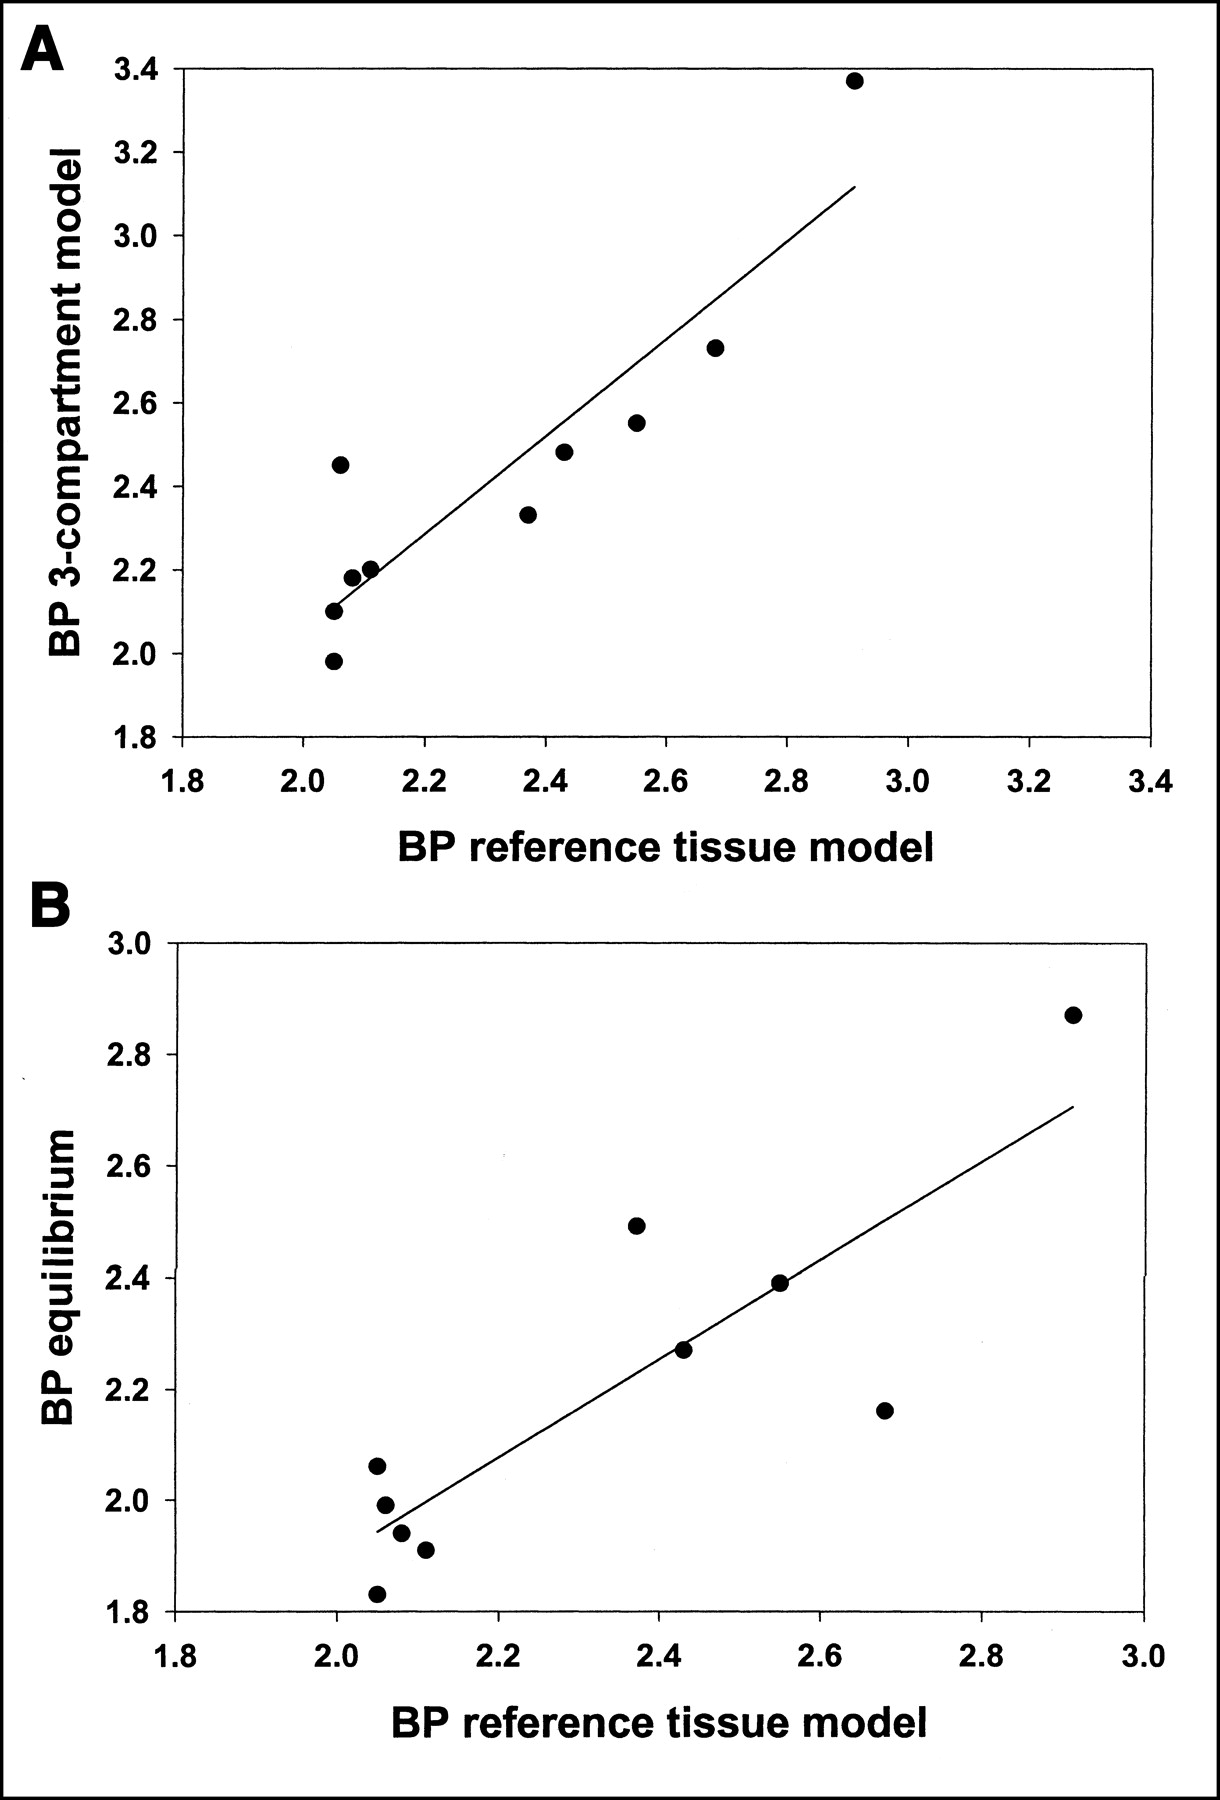
Correlations between BPs as determined with 3-compartment model and reference tissue model (A) as well as between BPs as determined with transient equilibrium model and reference tissue model (B).
VDs and BPs in Human Brain
With regard to measured VDs, there was an excellent agreement between the applied analytic methods, especially in striatal regions (Table 1). VDs from the 3-compartment model were highly significantly correlated with those from the 2-compartment model (rs = 1.00; P < 0.0001; Fig. 5A) as well as with VD values from the Logan plot with arterial blood sampling (rs = 1.00; P < 0.0001; Fig. 5B). In the putamen, the VDs ranged from 10.74 ± 3.59 (3-compartment model) to 10.97 ± 3.61 (Logan plot with arterial blood sampling). In the caudate, the variation was even lower, with estimates between 8.73 ± 3.01 and 8.87 ± 3.00. Regardless of the method used, VDs in the thalamus were consistently and statistically significantly higher than those in the cerebellum in all subjects (P < 0.005; based on 3-compartment model), indicating a modest binding in extrastriatal regions.
Regarding the BPs, there was also a very good agreement between all methods (Table 1). BPs in the putamen ranged from 2.19 ± 0.32 (mean ± SD) as determined by the transient equilibrium model to 2.44 ± 0.40 as measured with the compartment kinetic models. In the caudate, the respective values ranged from 1.61 ± 0.34 (Logan plot with reference region) to 1.80 ± 0.41 (2-compartment model). In the thalamus, BPs were determined to be around 0.20 in magnitude, with the Logan graphical methods at the low end and, again, the 2-compartment model revealing the highest value (Table 1).
In general, there was also a very good correlation between the invasive (using the metabolite-corrected arterial blood input function) and the noninvasive (without blood) methods. All applied methods correlated statistically significantly with each other. Figure 6 shows the correlations between representative methods applied to data for the putamen. Results for the other regions are very similar. The strongest correlation was found between the Logan plot with arterial blood sampling and the Lammertsma reference tissue model (rs = 0.997; P < 0.0001; data not shown). The latter method was also significantly correlated with the gold standard 3-compartment model (rs = 0.924; P < 0.0001; Fig. 6A). The transient equilibrium model tended to demonstrate weaker correlations with all other analytic methods (with correlation coefficients around 0.70), although the correlations were statistically significant in all cases. Figure 6B shows the correlation between the transient equilibrium model and the reference tissue model (rs = 0.748; P = 0.013). All other methods were statistically significantly correlated with each other, with correlation coefficients of around 0.90 (data not shown).
DISCUSSION
In this study on human healthy male volunteers we confirmed earlier results from monkey studies demonstrating the selective, high-affinity binding of the benzamide tracer 18F-DMFP to D2-like DA receptors (10). 18F-DMFP belongs to a class of 18F-labeled substituted benzamide PET radioligands that were initially described by Mukherjee et al. (26). These authors determined an IC50 of 15 nmol/L for 18F-DMFP at D2-like DA receptors (using 3H-spiperone) compared with a value of 30 nmol/L for the well-characterized PET radioligand 11C-raclopride (10). The equilibrium dissociation constant Kd for 18F-DMFP was calculated to be 0.34 nmol/L. In one of their first papers on 11C-raclopride, the Karolinska group reported a Ki of 26 nmol/L (using 3H-spiperone) (27) and a Kd of 1.15 nmol/L. For 18F-DMFP, we determined a Ki of 15 nmol/L using 3H-spiperone, which is only slightly higher than the Ki reported for 11C-raclopride. Because the Ki is expected to be markedly higher than the Kd when spiperone is used as the competitor (28), our Ki value of 15 nmol/L for 18F-DMFP is well in line with the Kd of 0.34 nmol/L reported by Mukherjee et al. (10). These available data point to a slightly higher affinity of 18F-DMFP for D2-like DA receptors compared with 11C-raclopride.
Corresponding to the minor difference in in vitro affinity between the 2 tracers, 18F-DMFP differs only slightly from 11C-raclopride with regard to binding indices determined in human brain (19,29). Interestingly, although the BPs obtained with the 2 tracers are very similar in magnitude, VD values measured with 18F-DMFP are almost 10-fold higher than those from 11C-raclopride studies. The distribution volume represents the blood volume, in which the same amount of tracer is distributed that is allocated to 1 mL tissue (in mL blood/mL tissue). Thus, the distribution volume of a radiotracer in the reference tissue corresponds to the nonspecific binding of the tracer in this tissue, which is generally assumed to be the same as in receptor-rich areas. For 11C-raclopride, Lammertsma et al. (19) report VDs of about 0.40 for the cerebellum and 2.20 for the striatum. With markedly higher VDs in all assessed brain regions, 18F-DMFP seems to display a higher nonspecific binding than 11C-raclopride, probably because of the higher lipophilicity of the compound caused by the fluorine label. However, according to our studies, this does not influence the calculated BPs derived from these VDs.
Several authors reported the distribution of D2-like DA receptors in various species using heterogeneous ligands such as sulpride, spiperone, and raclopride (16,30–33). The highest DA receptor densities have been demonstrated in the caudate nucleus and in the putamen, with decreasing numbers in various subcortical structures such as the thalamus and lowest densities—the almost receptor-free cerebellum excluded—in the cortex, especially in layer 5 (16,32). Although we were able to demonstrate that even extrastriatal DA receptors can be quantified to a certain extent—at least in brain regions with higher receptor densities—with this tracer (Fig. 4), the affinity is certainly too low for the quantification of cortical DA receptors. However, the same is true for 11C-raclopride (34). Although attempts have been made to quantify cortical DA receptors with 11C-raclopride or 123I-IBZM, it seems doubtful whether the results obtained with these tracers are truly reliable because the interindividual variability in binding by far exceeds the measured signal (35,36). The quantification of extrastriatal, especially neocortical, DA receptors remains the domain of the high-affinity benzamide ligands 11C-FLB 457 or 18F-fallypride, the latter being an 18F-DMFP analog with an affinity for D2-like DA receptors in the picomolar range (37,38). On the other hand, 18F-fallypride has the disadvantage of its slow kinetics (because of its high affinity), which requires a data acquisition of at least 3 or even 4 h (39).
Because of the longer half-life of the 18F label (109.7 vs. 20.4 min), 18F-DMFP has several advantages over 11C-raclopride. First, 18F-DMFP can be used independently of an on-site cyclotron, which means in practice that satellite PET centers even hundreds of kilometers away from the manufacturing radiochemistry site are able to administer the ligand for clinical and research applications. Second, 18F-DMFP allows for more time to follow pharmacologic and behavioral challenges applied in PET studies of the sensitivity of dopaminergic systems in neuropsychiatric disorders. Compared with the established SPECT tracer 123I-IBZM, it demonstrates a markedly higher signal-to-noise ratio. The only true disadvantage of the longer half-life of the fluorine label may be that it cannot be easily administered repeatedly in a short period of time, which may be necessary in pharmacokinetic studies (5). In psychiatric patient populations, studies on D2 receptor occupancies by antipsychotics and their relationship to doses, plasma levels, and clinical effects and side effects, on the one hand, and the evaluation of pharmacologic and nonpharmacologic challenges on binding of the radioligand could be the domain of 18F-DMFP. In neurologic samples, the tracer could be an ideal tool for studies of movement disorders.
Another advantage of using an 18F-derivative is its high specific activity. Whereas maximal values of <100 GBq/μmol are reported for 11C-raclopride, specific activities of >800 GBq/μmol at the time of injection could be obtained with 18F-DMFP in our study. Specific activities of about 1,000 GBq/μmol could be reached if the 18F were produced on site.
We have shown that VDs and BPs obtained with 18F-DMFP are well described by means of various noninvasive analytic methods such as the Logan noninvasive plot (22), the transient equilibrium method (24), or the reference tissue model (23). Thus, for future clinical and research applications it may be possible to use this tracer without arterial blood sampling to obtain quantitative information about the general binding parameters.
CONCLUSION
Our results indicate that 18F-DMFP is a highly selective PET ligand for quantitative assessment of D2-like DA receptors, which can be used independently of an on-site cyclotron. Moreover, our comparative analyses demonstrate that noninvasive analytic methods without blood sampling provide valid measures of receptor quantities in human striatum.
Acknowledgments
The authors thank Ralf Schirrmacher, Sabine Höhnemann, Stephan Maus, and Wilhelm Hamkens from the Institute of Nuclear Chemistry for performing the radiochemical syntheses and the metabolite studies and Heike Armbrust from the Department of Nuclear Medicine for assistance in performing the PET studies. The authors also thank Peter Stoeter and his staff from the Institute for Neuroradiology for performing the MRI studies and Professor Hakan Håll from the Karolinska Institute, Stockholm, Sweden, for discussion of the Ki value of 18F-DMFP in comparison with 11C-raclopride. Part of this work was supported by the Deutsche Forschungsgemeinschaft (grant Ba 1011/2-1), by Merck KgaA, Darmstadt, Germany, and by the National Institutes of Health (grants R01 DA11080, R01 AA1283, K24 NS389279, RO1 MH4282, and RO1 DA 094821).
Footnotes
Received Apr. 8, 2002; revision accepted Jul. 26, 2002.
For correspondence or reprints contact: Gerhard Gründer, MD, Department of Psychiatry, University of Mainz, Untere Zahlbacher Strasse 8, 55131 Mainz, Germany.
E-mail: gruender{at}mail.uni-mainz.de
REFERENCES
In this issue


Jump to section
Related Articles
Cited By...
- Cocaine cue-induced dopamine release in the human prefrontal cortex
- Assessment of Striatal Dopamine D2/D3 Receptor Availability with PET and 18F-Desmethoxyfallypride: Comparison of Imaging Protocols Suited for Clinical Routine
- The Value of the Dopamine D2/3 Receptor Ligand 18F-Desmethoxyfallypride for the Differentiation of Idiopathic and Nonidiopathic Parkinsonian Syndromes
- The "delayed onset" of antipsychotic action -- an idea whose time has come and gone: 2004 Innovations in Neuropsychopharmacology Award Paper
- Parametric Mapping of Binding in Human Brain of D2 Receptor Ligands of Different Affinities