


Abstract
Abnormalities in myocardial L-type Ca2+ channel abundance and function have been described in cardiac hypertrophy and failure. In vivo quantification of the density of these channels using PET and an adequate ligand would provide new insights into cardiac disease. Methods: The dihydropyridine L-type Ca2+ channel antagonist S12968 (3-ethyl 5-methyl (−)-2-[(2-(2-aminoethoxy)ethoxy)methyl]-4-(2,3-dichlorophenyl)-6-methyl-1,4-dihydropyridine-3,5-dicarboxylate) was labeled with 11C and injected in various amounts (5–23 nmol), 20 or 30 min apart, into dogs. This protocol allowed a separate evaluation of the density of binding sites (Bmax) as well as association and dissociation rate constants. The parameters were calculated using a nonlinear mathematic model. Results: Using the multiinjection approach, a complete model describing interactions between S12968 and the dihydropyridine binding sites was obtained. Bmax was found to be 19.2 ± 3.3 pmol·mL−1 of tissue. Association and dissociation constants (estimated by Kon/VR and KdVR, respectively) were found to be 0.015 ± 0.01 mL·pmol−1·min−1 and 4.2 ± 2.2 nmol·mL−1, respectively. Conclusion: The present data suggest that it is possible to measure myocardial dihydropyridine binding site density with a single radiosynthesis and a simple PET protocol that is not time consuming (75 min for the total examination, including transmission and emission scans). This methodology can be useful to investigate human cardiac disease in vivo.
Calcium channels play a key role in the physiologic control of the heart (depolarization, excitation-contraction coupling, mediation of the inotropic state). The L-type Ca2+ channels have at least 3 binding sites for Ca2+ channel blockers: the 1,4-dihydropyridine (DHP), the phenylalkylamine, and the benzothiazepine sites (1). Expression of the myocardial DHP receptors (α1 subunit of L-type Ca2+ channel) is altered in congestive heart failure (2). The development of severe hypertrophy, congestive heart failure (2–5), endotoxin-induced cardiac depression (6), and sympathetic denervation (7) in animal models is associated with abnormalities in L-type Ca2+ channel abundance and function. In patients, changes in DHP binding sites have been described in hypertrophic cardiomyopathy (8) and end-stage heart failure (9). β-adrenoceptor antagonists are therapeutic agents commonly used in these diseases. Consequently, the measurement of β-adrenoceptor density, using PET and CGP12177 (which is a β-adrenoceptor antagonist), cannot be performed because the therapeutic agent binds to the myocardial β-adrenoceptors. Therefore, the in vivo measurement of Ca2+ channel density is of clinical interest in hypertrophic cardiomyopathy and heart failure.
1,4-DHPs are potent and specific ligands of the slow, voltage-dependent L-type Ca2+ channels. The use of 3H-DHPs has resulted in the identification of high-affinity, saturable, and stereoselective binding sites. PET would allow determination of the density of DHP binding sites provided a radioligand were available. For in vivo studies, several DHPs (nifedipine, nicardipine, nisoldipine, nitrendipine, and isradipine) have been labeled with 11C (10–12). Two studies of the in vivo kinetics of 3H-nifedipine, 3H-nimodipine, 3H-PN 200 110 or 11C-PN 200 110, and 3H-amlodipine showed rapid washout of the tracers from myocardial tissue and a low specific binding (12,13).
The L-type Ca2+ channel antagonist S11568 (3-ethyl 5-methyl (±)-2-[(2-(2-aminoethoxy)ethoxy)methyl]-4-(2,3-dichlorophenyl)-6-methyl-1,4-DHP-3,5-dicarboxylate) and its enantiomers S12968 and S12967 (S and R absolute conformations, respectively) have been labeled with 11C and studied in vivo using PET (12,14). These studies demonstrated that only 11C-S12968—the pharmacologically most active enantiomer—was suitable for in vivo Ca2+ channel imaging (14). In this study, an attempt was made to quantify DHP binding sites in the dog heart using a multiinjection protocol and a mathematic compartmental analysis.
MATERIALS AND METHODS
Animals
Dog use procedures were in accordance with the recommendations of the European Economic Community (86/609/CEE) and the French National Committee (decree 87/848) for the care and use of laboratory animals.
Female beagle dogs (n = 5; mean weight, 10 kg) were anesthetized with pentobarbital, intubated, and artificially ventilated with 1%–1.5% isoflurane, 67% N2O, and 33% O2. The animals were positioned in a human brain scanner (953B/31; CTI PET Systems, Knoxville, TN) that is also suitable for cardiac imaging of small animals. This scanner allows simultaneous acquisition of 31 slices (3.37 mm apart) with an intrinsic spatial resolution of about 6 mm. Reconstructed images had a resolution of 8.5 mm. Transmission scans were acquired for 15 min using 3 retractable 68Ge rod sources.
Preparation of 11C-S12968
A single radiosynthesis was performed for a complete PET experiment. S12968 was labeled with 11C using the enantiomerically pure (enantiomeric excess > 95%) carboxylate precursor (3-ethyl (−)-(S)-2-[(2-(2-aminoethoxy)ethoxy)methyl]-4-(2,3-dichlorophenyl)-6-methyl-1,4-DHP-3,5-dicarboxylate) (15) and 11C-methyl triflate (in N,N-dimethylformamide containing 0.8–1.6 equivalents of benzyltrimethylammonium hydroxide, with respect to starting carboxylate precursor, at 100°C for 1 min). Typically, 3.7–4.4 GBq (100–200 mCi) of 11C-S12968 (yield, 25%–30% decay-corrected based on 11C-methyl triflate) were routinely obtained within 25–30 min of radiosynthesis (including high-performance liquid chromatography purification), with specific radioactivities ranging from 29.6 to 44.4 GBq·μmol−1 (0.8–1.2 Ci·μmol−1). Radiochemical, chemical, and enantiomeric purities were found to be greater than 98%, 95%, and 95%, respectively (15).
PET Experimental Protocols
Dogs were intravenously injected with 5–23 nmol 11C-S12968 2 times 30 min apart or 3 times 20 min apart. Table 1 provides the details of each experiment. The PET acquisitions lasted 60 min (3 injections) or 64 min (2 injections). The scanning protocol consisted of 2 or 3 sequences of dynamic images. For the 2-injection protocol, each sequence consisted of 17 images (4 of 30 s, 5 of 1 min, 5 of 2 min, and 3 of 5 min), and for the 3-injection protocol, each sequence consisted of 15 images (6 of 30 s, 5 of 1 min, and 4 of 3 min). For determination of the arterial input function, blood samples were obtained from the femoral artery at designated times. Heart rate and blood pressure (femoral artery) were carefully monitored during the PET experiment.
Protocol Parameters Corresponding to the 5 Experiments
PET Data Processing
Myocardial time-activity curves were measured from a left ventricular region of interest automatically drawn on the slices using an isocontour plotting routine without any reorientation. The 70% isocontour included both the interventricular septum and the left ventricular free wall. 11C-S12968 tissue concentrations (Bq·mL−1) were obtained after correction for attenuation and for 11C decay and were expressed as pmol·mL−1 using the value of the specific radioactivity measured at the beginning of the PET experiment. Spillover from blood cavity to myocardium was not corrected but was taken into account through a vascular fraction, that is, the fraction of blood present in the tissue volume (16), which was fitted.
Determination of Plasma Metabolites
The identification of model parameters required knowledge of the unchanged radioligand concentration in plasma. This concentration was used as the input function in the subsequent modeling. For analysis of unchanged radioligand, arterial blood samples were processed as described previously (11). Blood samples were collected at 5, 15, and 20 min after injection of the tracer and were immediately centrifuged to obtain cell-free plasma. For deproteinization, plasma was mixed with acetonitrile containing 0.001 mg·mL−1 of cold standard as reference compound. After centrifugation, the supernatant was directly used for high-pressure liquid chromatography analysis. Plasma concentration of unchanged radioligand was expressed as pmol·mL−1 after division by the specific radioactivity measured at the beginning of the PET experiment.
The Ligand-Receptor Model
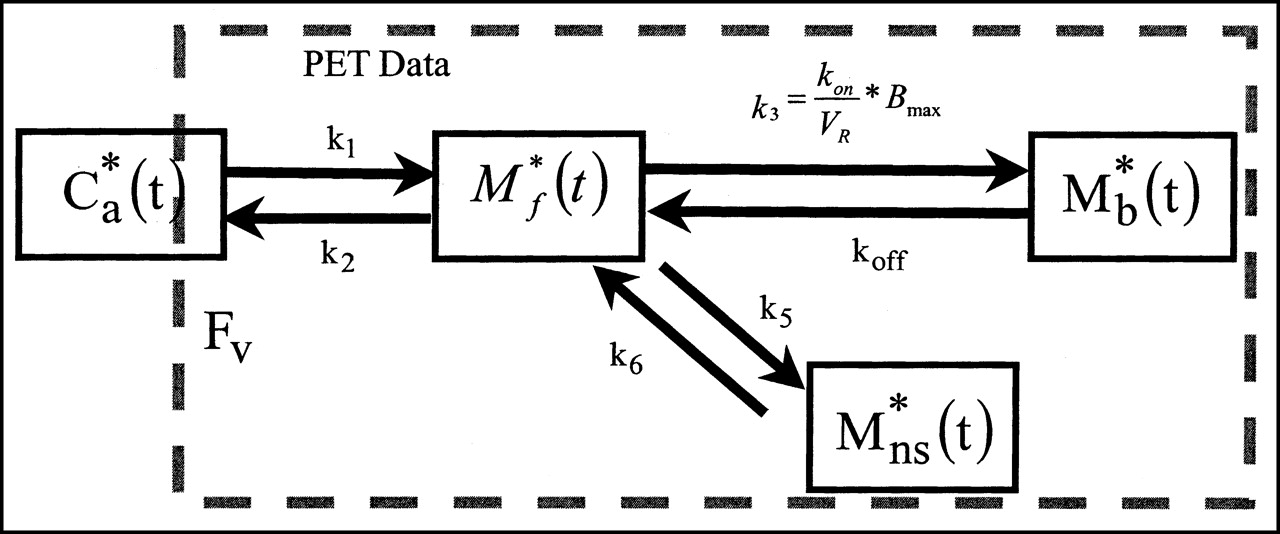
The compartmental model used in this study is based on the nonequilibrium nonlinear model (17,18). It includes 3 compartments (and a fourth compartment for nonspecific binding) and 7 parameters (Fig. 1).

Four-compartment ligand-receptor model used in analysis of S12968 time-concentration curves obtained with PET. All transfer probabilities of ligand between compartments are linear, except binding probability, which depends on local association rate constant (kon), local free ligand concentration (M*f(t)/VR), and local concentration of receptor sites (Bmax − M*b(t)). PET experimental data correspond to sum of labeled ligand in 3 tissue compartments and in fraction FV of blood concentration. M*ns(t) = nonspecifically bound radioligand.
The flux of nonmetabolized free ligand from the plasma compartment to the free ligand compartment is given by K1 C*a(t) (as pmol·min−1·mL−1 of tissue), where C*a(t) is the plasma concentration of nonmetabolized 11C-S12968.
The quantity of free labeled ligand present in 1 mL of the tissue volume delineated by the PET region of interest is denoted by M*f(t). However, because of the obvious heterogeneity of the tissue, this concentration can be heterogeneous in the region of interest. For example, the local concentration of the free ligand in the vicinity of the binding sites (which is the concentration to take into account in the ligand-receptor interactions) may be different from M*f(t) (which, by definition, represents the mean concentration in the unit volume measured by PET). To take into account this heterogeneity, the concept of the reaction volume (VR unit = mL·mL−1 of tissue) was previously introduced (19). The value of VR is such that M*(t)/VR is equal to the local free ligand concentration in the vicinity of the binding sites. The free ligand can bind directly to a specific binding site (or to a nonspecific site) or escape back to the blood with a rate constant k2. VR depends on the lipophilicity of the ligand. For S12968, this physical parameter was previously determined as estimated by the partition coefficient octanol/buffer and found to be low (log partition octanol/water = 1.54) in comparison with other DHPs (20).
The specific binding is a saturable reaction that depends on a bimolecular association rate constant kon, the free ligand concentration in the vicinity of the receptor sites M*f(t)/VR, and the quantity of binding sites in 1 mL of tissue. This last quantity is equal to Bmax, which is the total binding site concentration. The rate constant for the dissociation of the specifically bound ligand is denoted by koff. The in vivo equilibrium dissociation rate constant is denoted by KdVR, where Kd is the ratio koff/kon.
The multiinjection protocols include injections of ligand with decreasing specific radioactivity. Bmax, K1, k2, Kon/VR, and koff (and eventually k5, and k6 for the nonspecifically bound ligand) are the model parameters to be identified. Units are given in Tables 2 and 3. The 2 parameters kon and VR cannot be separately estimated because they always appear together in model equations. In PET studies, the experimental data (denoted by M*T(ti)) acquired between 2 times (denoted by ti − 1 and ti) are given by the following integral relationship:
 , where C*B(t) is the whole-blood time-concentration curve and FV represents the vascular volume that is the fraction of blood present in the tissue volume. In this study, FV was fitted because it represented a large percentage of the myocardial tissue (usually about 0.4 mL·mL−1 of tissue (21)).
Numeric Estimates of Myocardial Blood Flow for the 5 Experiments
Model Parameters Identified from Experimental Data Obtained with Protocols Described in Table 1
The model parameters are identified through a minimization of the usual weighted least squares cost function, and the estimation of the SEs relies on a sensitivity analysis and on the covariance matrix (17). Comparisons between model structures are based on the use of the Akaike information criterion (22) and of the F distribution (17,23).
For the estimation of changes in myocardial blood flow, the PET data were processed using the same software but the model was simplified to 2 compartments (unchanged radioligand in plasma and radioligand in tissue). K1 and k2 were calculated for each injection, denoted as K1′ and k2′ for the second injection and K1′′ and k2′′ for the third injection.
RESULTS
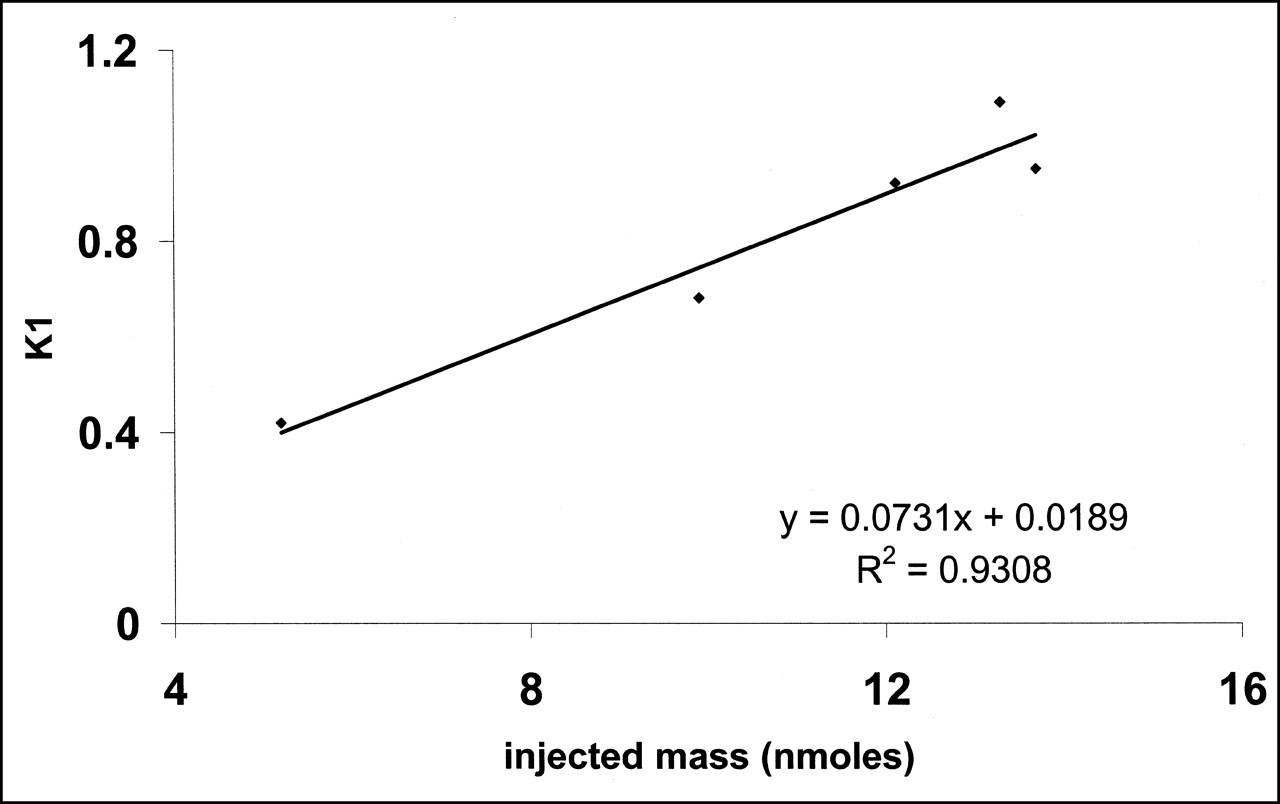
No significant change in heart rate or blood pressure was observed during the PET experiments. Left ventricular distribution of 11C-S12968 was homogeneous in all dogs. Myocardial uptake was higher than observed with other compounds (at 10 min after injection, 3.64% ± 0.3% injected dose per 100 g of tissue for 11C-S12968 and 2.1% ± 0.26% injected dose per 100 g of tissue for 11C-CGP12177; n = 5 beagle dogs [H. Valette, unpublished data, 1994]). Therefore, left ventricular time-activity curves were characterized by a low noise contribution (Fig. 2). Furthermore, because of the slow myocardial kinetics of S12968, the PET protocol included images of somewhat long duration when compared with other cardiac studies (21,24). After the first injection of a low amount (5.2 nmol, experiment 2) of 11C-S12968, myocardial radioactivity concentration increased rapidly and then reached a plateau. When a higher dose of the radiotracer was injected (all 4 other experiments, 9.9–13.7 nmol), the myocardial time-activity curve presented a different pattern: a higher uptake followed by a washout (Fig. 2). The corresponding estimations of myocardial blood flow (K1 and k2) after the first injection of 11C-S12968 are presented in Table 2. The second and the third parts of the myocardial time-activity curves after the subsequent injections of a larger amount (8.8–12.4 nmol) of 11C-S12968 had the same aspect (Fig. 2). In experiment 2, the values of K1′ and k2′ increased with the mass of 11C-S12968 injected. The variation of parameter K1 is assumed to reflect a myocardial blood flow variation. There was a statistically significant linear relationship between K1 or k2 and the mass of injected S12968 (r = 0.93 [P < 0.01] and r = 0.82 [P < 0.05], respectively) (Figs. 3 and 4). These changes in K1 and k2 precluded the use of a coinjection of 11C-S12968 and of a large amount of unlabeled S12968 or the performance of a displacement experiment using a large amount of unlabeled S12968. Therefore, the myocardial time-activity curves were poor in information and hampered the identification of some parameters with accuracy (especially kon/VR, KdVR, and koff).
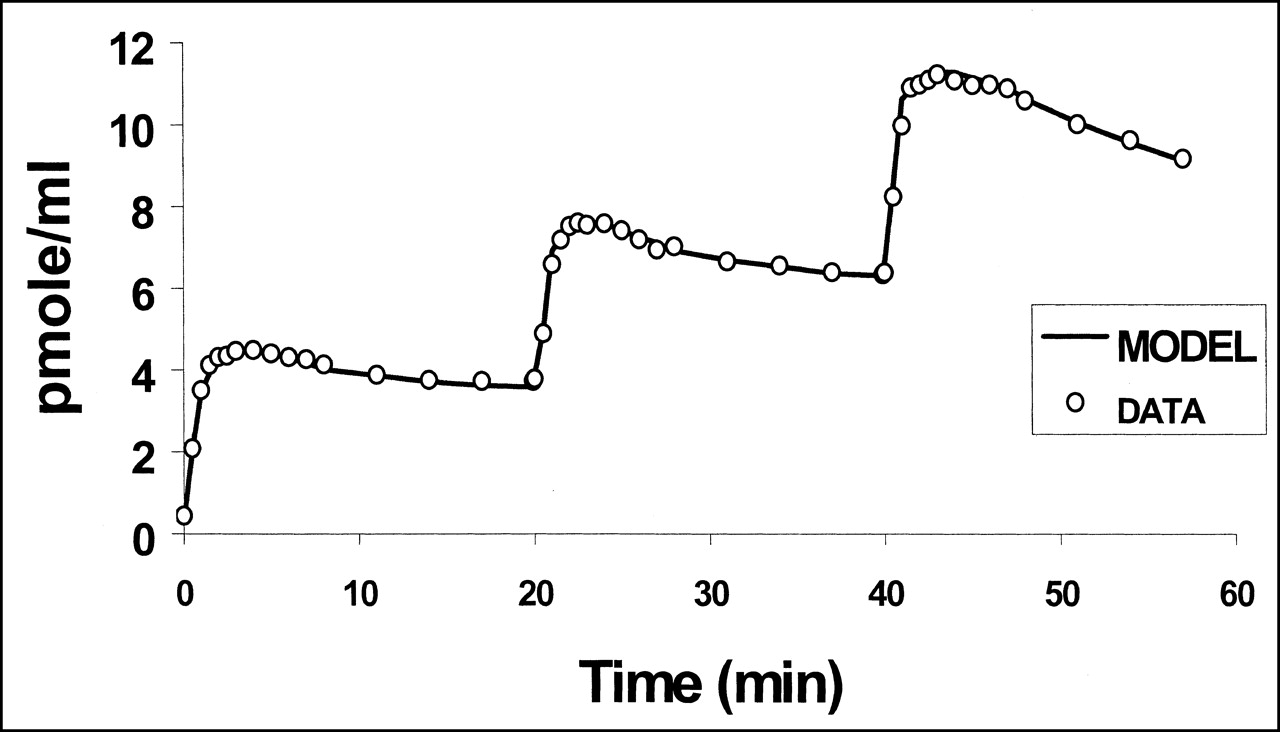
PET left ventricular time-activity curve after injection of 9.9-nmol dose of 11C-S12968, followed 20 min later by injection of 8.8 nmol, followed 20 min later by injection of 10.1 nmol. Time-activity curve is characterized by low noise contribution. Quality of fit of experimental data to 3-compartment mathematic model is satisfactory. DATA = data from experiment 3; MODEL = 3-compartment mathematic model.

Relationship between injected mass of S12968 and left ventricular uptake, estimated by K1. Correlation was clearly linear.
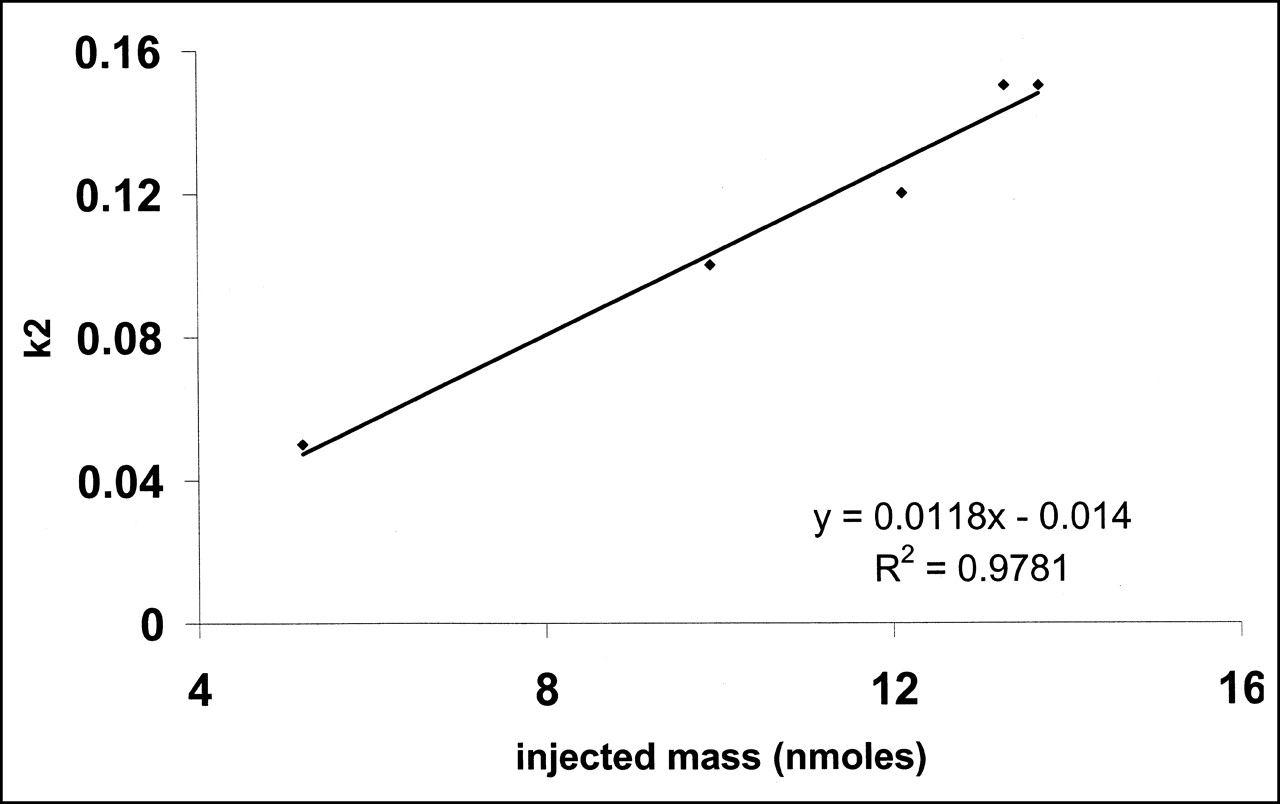
Relationship between injected mass of S12968 and left ventricular washout, estimated by k2. Correlation was clearly linear.
The results of high-pressure liquid chromatography showed that unchanged 11C-S12968 represented 70% ± 14%, 20 min after injection. This proportion remained similar whatever the dose of 11C-S12968 injected (Fig. 5).
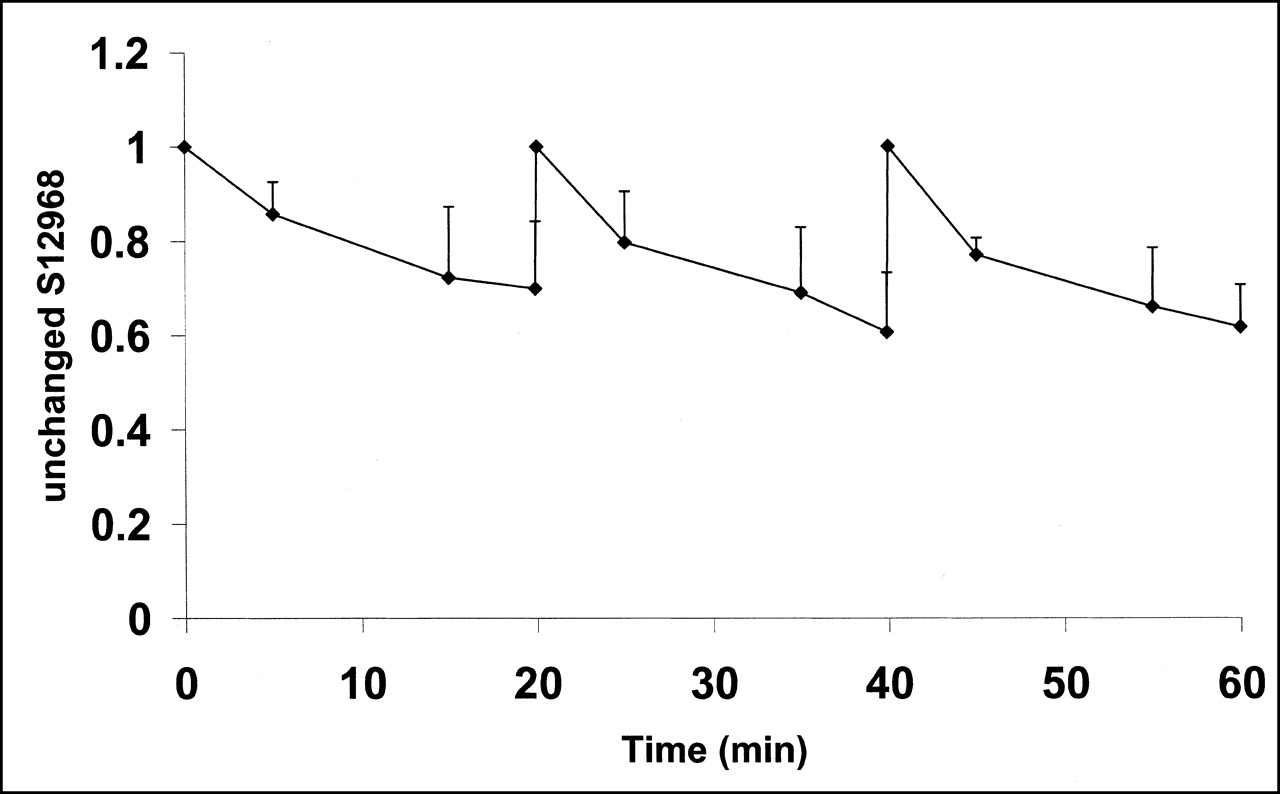
Mean (experiments 3–5) and SD of unchanged 11C-S12968 in plasma, as function of time. Shape of curve remained coarsely unchanged after each of the 3 injections.
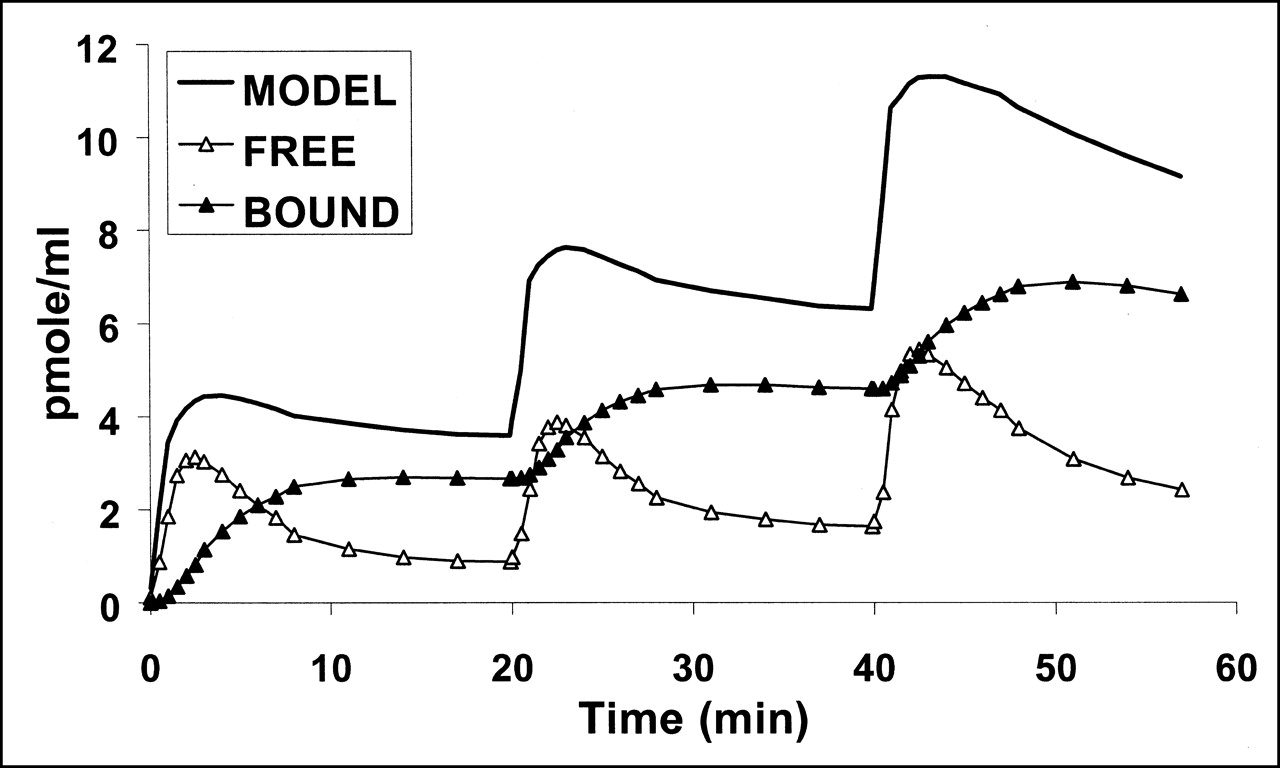
Fitting the complete mathematic model to experimental data provided values for kinetic rate constant and binding site density. The numeric values are shown in Table 3. The quality of the fits was satisfactory, as can be seen in Figure 2. For experiment 2, the fit was satisfactory only if 2 different values of myocardial blood flow (estimated by K1 and k2 and K1′ and k2′, Table 2) corresponding to the first injection (5.2 nmol) and second injection (21.3 nmol) were used. The relative SEs were small for all parameters except konVR, KdVR, and koff (Table 3). Average binding site density, calculated with the 2- or 3-injection protocol, was 19.2 ± 3.3 pmol·mL−1 of tissue. Introduction of a compartment with nonspecifically bound ligand into the model did not improve the quality of the fits (data not shown). Myocardial time-activity curves for free and bound ligand were calculated for the 5 experiments using the parameter values shown in Table 3. Figure 6 shows the result of simulation obtained with the parameters estimated from experiment 3. The estimated concentration of bound ligand showed a slow kinetic reaching a plateau 10 min after each injection, whereas the estimated concentration of free ligand decreased slowly.

Computer simulation of S12968 kinetics during multiinjection experiment (PET data from experiment 3, as in Fig. 2). Figure shows S12968 concentration in all compartments simulated using model parameters given in Table 3: specifically bound ligand concentration and free ligand. Solid line is simulation of PET-measured S12968 concentration.
Computer simulations of myocardial blood flow and binding site concentration variations were performed. The variation of Bmax after a simulated 50% increase in myocardial blood flow (increase in both K1 and k2 after each injection) was less than 5% in the 5 experiments. These simulations showed that a change in myocardial blood flow did not affect the value of Bmax if and only if K1 and k2 remained unchanged after each injection.
DISCUSSION
This study presents the application of 11C-S12968 as a new PET tracer for the noninvasive quantification of myocardial L-type Ca2+ channels. The tracer did not show any pharmacologic effects on heart rate or blood pressure at the used doses. On the other hand, myocardial uptake was sensitive to changes in myocardial blood flow, which were closely related to the injected mass of S12968. The quantity of myocardial binding sites was found to be 19.2 ± 3.3 pmol·mL−1 of tissue (average value calculated from the data of the 3 injection experiments, Table 3). The Bmax value calculated from the 2-injection protocol (Table 3) led to a smaller value and a larger SD of the estimated value than did the value calculated from the 3-injection protocol. This could be due to the lesser information contained in the time-activity curve of the 2-injection protocol (especially in experiment 2). The present Bmax value is in accordance with the values obtained in vitro in rats using 3H-PN 200 110 (18 pmol·g−1 of tissue) or 3H-nitrendipine (22 pmol·g−1 of tissue) (25). Similar values were obtained in rabbits using 3H-PN 200 110 (18 pmol·g−1 of tissue) on intact myocytes (26). In dog cardiac membrane preparations, measurement of Bmax led to a value of 6 pmol·g−1 of tissue using 3H-PN 200 110 (27). The difference between the in vivo and the in vitro values is likely due to loss of proteins during the cardiac membrane preparation, as suggested by the difference from the values obtained in dogs (membranes) and in rabbits (intact myocytes).
The average KdVR value estimated by the model was 4.2 ± 2.2 nmol·mL−1 of tissue. The in vitro Kd value of S12968 is unknown because 3H-S12968 was not available for its measurement. If the value of Kd measured with 3H-PN 200 110 (1.15 nmol on intact myocyte preparation (25)) is taken for calculation, the estimated value of VR should be 3.6 for S12968. This value is in accordance with the data from Delforge, which included cardiac and several more lipophilic PET ligands used for receptor brain imaging (19). This value is much greater than that estimated with 11C-methyl-quinuclidinyl benzylate (MQNB) (21). MQNB is a hydrophilic ligand (log partition coefficient octanol/water = −0.5), whereas S12968 is more lipophilic (log partition coefficient octanol/water = 1.5) (20,21).
The Koff value estimated from the model is small (0.028 ± 0.01 min−1) when compared with that of MQNB (0.27 ± 0.03 min−1) (21). With S12968, this low value of Koff demonstrated that a rapid displacement after injection of a large amount of unlabeled compound cannot be observed (14). Furthermore, this injection of unlabelled S12968 would have led to a large increase in myocardial blood flow, which would have complicated the estimation of the parameters (especially of K1, k2, and koff). The introduction of nonspecifically bound ligand in the model did not improve the quality of the fits. This is not surprising because, in dedicated experiments, 80% of 11C-S12968 myocardial radioactivity could be displaced by the injection of unlabeled ligand (14). For experiment 2, the effect of the nonspecific binding could not be assessed because the number of parameters (9, including the 2 different values of myocardial blood flow) to estimate would have been too large because the time-activity curve is poor in information. These characteristics demonstrated that a simplified PET protocol and a graphic method such as that used with CGP 12177 (24) is not possible with S12968.
CONCLUSION
The present data obtained in dogs suggest that it is possible to measure myocardial DHP binding site density in humans with a simple acquisition protocol avoiding the injection of a large amount of S12968. The present protocol is not time consuming (75 min for the total PET examination, including both transmission and emission scans). Although the radioligand does not explore the activity of the L-type Ca2+ channel, this methodology can be useful to investigate human cardiac disease in vivo.
Footnotes
Received Nov. 12, 2001; revision accepted Apr. 25, 2002.
For correspondence or reprints contact: Héric Valette, MD, Service Hospitalier Frédéric Joliot, DSV-DRM-CEA, 4 Place du Général Leclerc, 91401 Orsay, France.
E-mail: valette{at}shfj.cea.fr
REFERENCES
In this issue


Jump to section
Related Articles
Cited By...
- No citing articles found.