


Abstract
Attenuation, photon scatter, and distance-dependent collimator-detector response are major degrading factors in myocardial SPECT images. The current study investigated whether compensation for these factors improves perfusion defect detectability, and compared the results for human observers with a previous study using a mathematical observer. Methods: Four methods were investigated: attenuation compensation (AC); attenuation and detector response compensation; attenuation and scatter compensation; and attenuation, detector response, and scatter compensation (ADSC). For ADSC, 4 three-dimensional postreconstruction Butterworth filter cutoff frequencies were investigated for a pixel size of 0.62 cm: 0.12, 0.14, 0.16, and 0.22 pixel−1. Five observers read images reconstructed using the 4 compensation methods. Receiver operating characteristics (ROC) analysis was used to determine the area under the ROC curve in each treatment studied. Results: Reconstruction methods that incorporated scatter and detector response compensation had higher indices of detectability than AC alone. Over the range studied, a filter cutoff frequency of 0.14 pixel−1 was optimal. A comparison of human observer results with an earlier channelized Hotelling observer study performed with the same images showed excellent agreement in trend and ranking of defect detectability. Conclusion: Compensation for detector response and scatter improves defect detectability compared with AC alone, although detectability may depend on phantom population choice and noise level. An optimal filter cutoff was found that is lower than what is typically used in a clinical setting. The channelized Hotelling observer is a good predictor of human observer performance and may reduce the need for tedious, time-consuming studies with human observers.
In SPECT myocardial perfusion imaging, images are degraded by photon attenuation, the distance-dependent collimator-detector response, and photon scatter. These factors are exacerbated in patients with large subdiaphragmatic uptake and in patients with large breasts (1,2). Noise also degrades the images, and image texture is affected by filter parameters (3,4), iteration number, reconstruction algorithm, and compensation method (5).
Reconstruction method can impact detectability of perfusion defects in myocardial SPECT images. Filtered backprojection (6,7) is the most widespread clinical reconstruction method. Iterative algorithms, such as maximum-likelihood expectation maximization (8,9) and ordered subset expectation maximization (10), allow compensation for degrading factors but require a substantial increase in processing time.
Nonuniform attenuation compensation (AC) with iterative algorithms improves detectability of myocardial perfusion defects compared with filtered backprojection in patient (3), physical phantom (11), and simulated phantom (12) observer studies. Recent observer studies have shown that iterative detector response compensation improved defect detectability in Ga67 lymphoma imaging compared with filtered backprojection and noncompensated iterative methods (13,14).
SPECT myocardial perfusion imaging has shown relatively high sensitivity but low specificity for coronary artery disease (15,16), partially due to image degrading factors. Thus, different compensation methods and filter parameters may improve overall detectability. For example, Gilland et al. (17) have shown that observer performance was significantly affected by choice of filter and filter parameters.
A common method to assess image quality with respect to a detection task is the use of observer studies and receiver operating characteristics (ROC) analyses. In such studies, observers rate images based on their confidence that a defect exists in a large set of images. Curve-fitting methods are used to fit the rating data to ROC curves (18,19,20). The estimated area under the ROC curve (AUC) provides an index of image quality.
The channelized Hotelling observer (CHO) was developed to model human observer performance and to provide an alternative to human observer studies (21,22). Studies comparing CHO and human observers have generally shown good agreement (23,24). Moreover, CHO studies have the advantage of not requiring extensive human observer training and testing time.
A CHO study investigating the effects of different compensation methods and filter cutoffs on defect detectability showed statistically significant improvement when AC was combined with either detector response or scatter compensation, compared with AC alone (data not shown). However, the greatest improvement was observed for combined attenuation, detector response, and scatter compensation (ADSC). Detectability was relatively sensitive to cutoff frequency of a 3-dimensional Butterworth filter.
In the current study, a human observer study was conducted to verify the results of the CHO study. Five observers read simulated short-axis cardiac SPECT images with different reconstruction methods and different filter cutoff values for one of these methods. Human and CHO results were compared to confirm whether CHO is a useful predictor of human performance in myocardial SPECT defect detection. Since CHO results were obtained before conducting the human observer study, no bias existed with regard to CHO parameter choice.
Materials and Methods
Phantoms
Using the data generation and reconstruction methods of LaCroix et al. (25), myocardial perfusion activity and attenuation distributions were generated for the MCAT phantom (26). Three anatomical types were simulated to provide a sampling of the large patient variations that occur clinically: a male torso with a flat diaphragm, a male torso with a raised diaphragm, and a female torso with large breasts. Within each anatomical type, 8 different anatomies were simulated. These anatomies had different sizes and shapes, but had the same heart size and shape. There were thus a total of 24 defect-free phantoms.
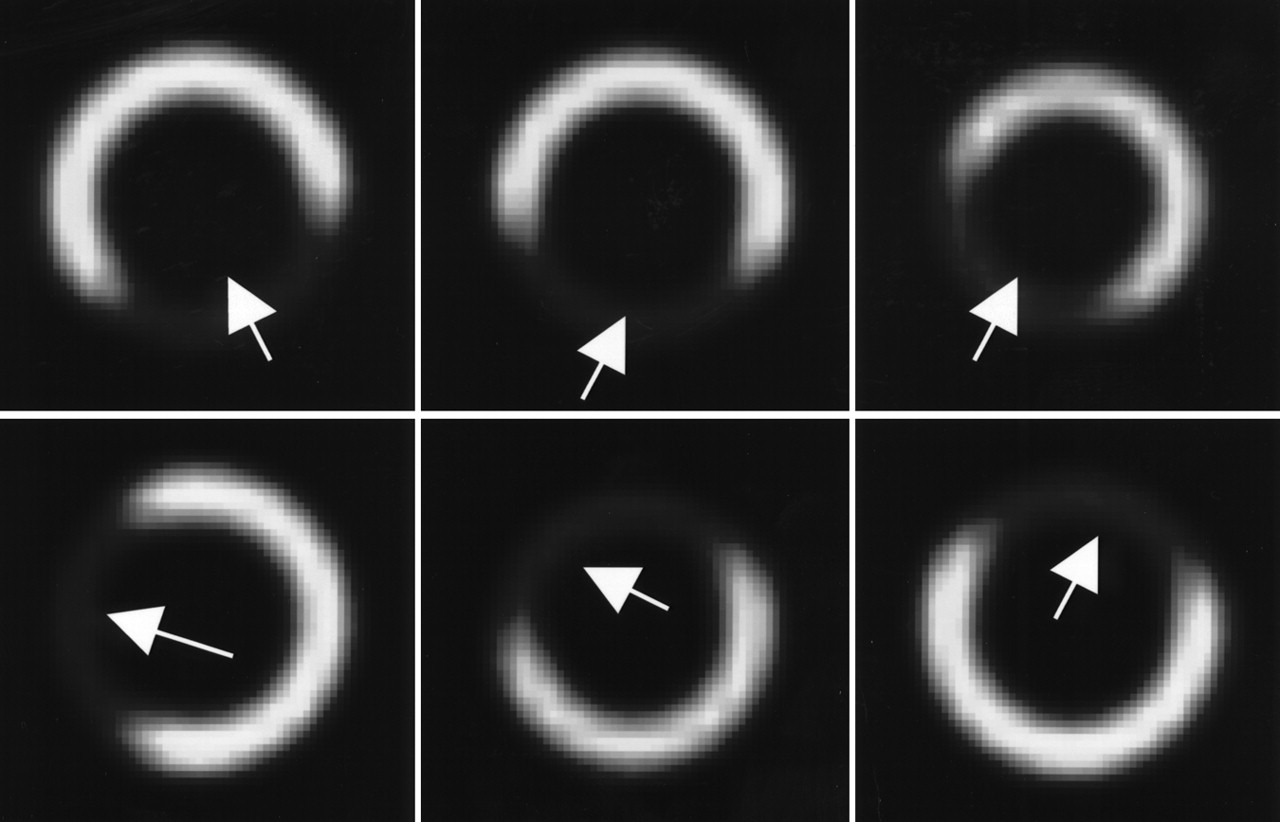
Six different defect locations were generated for each defect-free phantom, totaling 144 defect-containing phantoms. The 6 defects were located at various positions in the left ventricular wall, and these positions are shown in Figure 1. The defects were transmural, 2.5–3.1 cm long, and had an angular extent of 120°–150° around the ventricular wall. Defects were simulated at 12.5% less activity than the surrounding myocardium.

Location and size of 6 defects used in this study. Images are short-axis slices containing centroid of defect. Arrows indicate approximate center of defect. Contrast of defects has been enhanced for clarity.
Generation of Projection Data
Noise-free projection data were generated for a 99mTc-MIBI stress model using an analytic projection code (27). The uptake values were based on clinical stress studies (28). We used the average organ uptakes determined in Gilland et al. (28) with the exception of liver activity, which was double the average value reported in that study, and thus more comparable to liver uptake seen under pharmacological stress. The data were simulated for a low-energy high-resolution collimator with 64 projection views over 180° extending from 45° right anterior oblique to 45° left posterior oblique. The simulation was performed using voxels and projection bins of 0.31 cm. The resulting projection images were collapsed into a projection bin size of 0.62 cm. The slab-derived scatter estimation method (27) was used to estimate the scatter component of the projection data. Noisy projection data were generated by simulating Poisson noise using scaled noise-free projection data. The count level used was approximately one eighth to one tenth of clinical levels to maintain AUC values in the range that provides good statistical power. Equal numbers of defect-present and defect-absent sets of noisy projection data were simulated.
Reconstruction and Postprocessing
Images were reconstructed using ordered-subset expectation maximization (OS-EM) with 4 angles per subset (16 subsets per iteration) (10). AC was performed using blurred but noise-free attenuation maps for each anatomy. The maps were blurred with a Gaussian function to simulate the resolution loss in a scanning line, source-based transmission CT system. In addition, collimator-detector response compensation and scatter compensation were implemented on all images. Scatter compensation used the effective scatter source estimation model (29). To increase the realism, different models were used for scatter simulation and compensation, and a smaller pixel size was used during data simulation than in reconstruction. Based on the 3 compensations mentioned above, 4 “methods” were investigated: AC alone; attenuation and detector response compensation (ADC); attenuation and scatter compensation (ASC); and ADSC.
Images were reconstructed using 6 iterations of the OS-EM algorithm, which provided near-optimal performance in the CHO study. The reconstructed voxel size was 0.62 cm. An order-8, 3-dimensional postreconstruction Butterworth filter was then applied. Four filter cutoff values were tested: 0.12, 0.14, 0.16, and 0.22 pixel−1. These values bracketed the optimal value observed in the CHO study (data not shown). In this study, the filter cutoff was tested only for the ADSC images to limit the study size. Other methods were tested using a filter cutoff of 0.16 pixel−1, the optimal cutoff in the CHO study, resulting in 7 “treatments”: AC 0.16, ADC 0.16, ASC 0.16, ADSC 0.16, ADSC 0.12, ADSC 0.14, and ADSC 0.22. Since the filter cutoff study and the compensation method study were treated as 2 separate studies, observers read the ADSC 0.16 images twice, in random order. The compensation methods and filters used are summarized in Table 1.
Summary of the Methods and Filter Cutoffs Used
Observer Study
In the observer study, as in the previous CHO study, observers viewed only the short-axis slice containing the defect centroid. The short-axis images were generated from the reconstructed 3-dimensional transaxial images, using 2 rotation steps with bilinear interpolation. The resulting floating-point images were scaled to a 256-level grayscale. For all images, negative values were truncated to grayscale level 0, and the mean plus 2 SDs of the maximum values in the heart was mapped to 255. Values greater than this were set to 255.
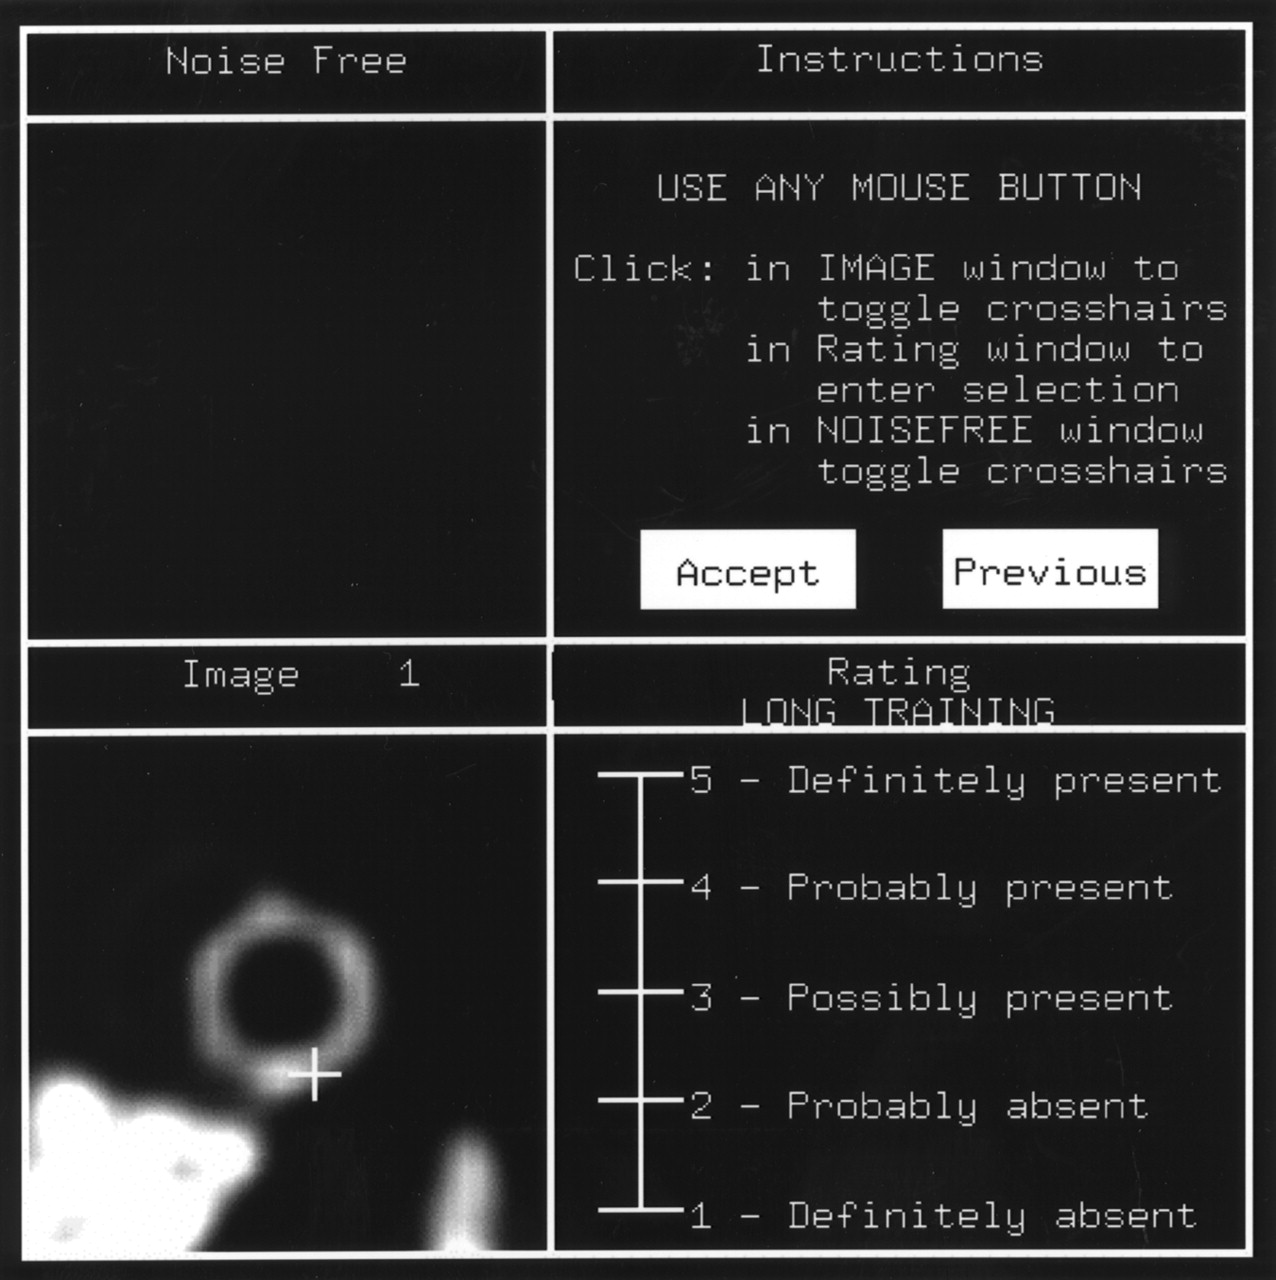
During display of an image, a cross-hair was initially displayed at the center of the possible defect to indicate the location under test (Fig. 2). After toggling the cross-hair, the observers rated their confidence that a defect was present on a continuous scale, with the highest number representing the greatest confidence that a defect was present.

Example of observer study display window. Image is displayed in bottom L corner; instructions are in top R corner; continuous rating scale is in bottom R corner. Cross-hair indicates possible center of defect to the observer. For training sessions, phantom image was displayed in upper L (noise-free) area after user rated the image.
The images were read by 5 observers: 4 graduate students and 1 postdoctoral fellow at the University of North Carolina Department of Biomedical Engineering. To familiarize themselves with the display program and the nature of the defect detection task, all observers commenced with an initial training session of 126 images.
The 288 images for each pair of treatments were divided into 4 blocks of 72 images for a total of 28 blocks, each preceded by a training sequence of 36 images. These blocks were presented to the observer in 4 sessions on 4 different days, with no more than 8 blocks per session to limit study time, as shown in Table 2. Each block contained an equal number of defect-present and defect-absent images. The blocks were arranged to eliminate reading-order effects.
Block Layout for Each Observer That Participated in the Study
ROC and Statistical Analysis
The rating data were analyzed using LABROC4 code (30). This code computes the true positive fraction (TPF) and false-positive fraction (FPF) for a series of operating points representing different confidence levels. Each resulting TPF/FPF pair for each observer was fitted with a binormal ROC curve, and the AUC was calculated. The AUC was used as a measure to compare the various methods and filter cutoffs.
For each observer, the differences in AUC values were computed for each pair of the 7 treatments under test, as shown in Tables 3 and 4. Since all observers read the same images, the AUC values were treated as paired measurements. For each pair of treatments compared, the resulting differences in AUC values were averaged across all 5 observers, and the population SD was computed. The null hypothesis was that this difference is zero, indicating no statistically significant difference between the pairs of the treatments. This null hypothesis was tested using the Student t test, and no multiple comparison corrections were performed.
Paired t Test of the Average AUC Over 5 Observers for the Different Compensation Methods
Paired t Test of the Average AUC Over 5 Observers for the Different Filter Cutoff Values
Results
Figure 3 shows that the average ROC curves for ADC, ASC, and ADSC lie above and to the left of the curve for AC, indicating greater overall detection accuracy for these 3 methods than for AC alone at all operating points. The ROC curve for AC does not cross the other 3 curves, indicating that for any operating point, the sensitivity and specificity for AC were lower than those of the other 3 methods. The ROC curves for ADC, ASC, and ADSC lie very close to one another, however, indicating that little difference existed among the 3 methods. A paired Student t test (Table 3), which was performed on the differences of average AUC values for all observers, indicated that ASC and ADSC had higher detectability than AC at a P < 0.1 level. Average AUC values for AC, ADC, ASC, and ADSC were 0.863, 0.882, 0.882, and 0.887, respectively.
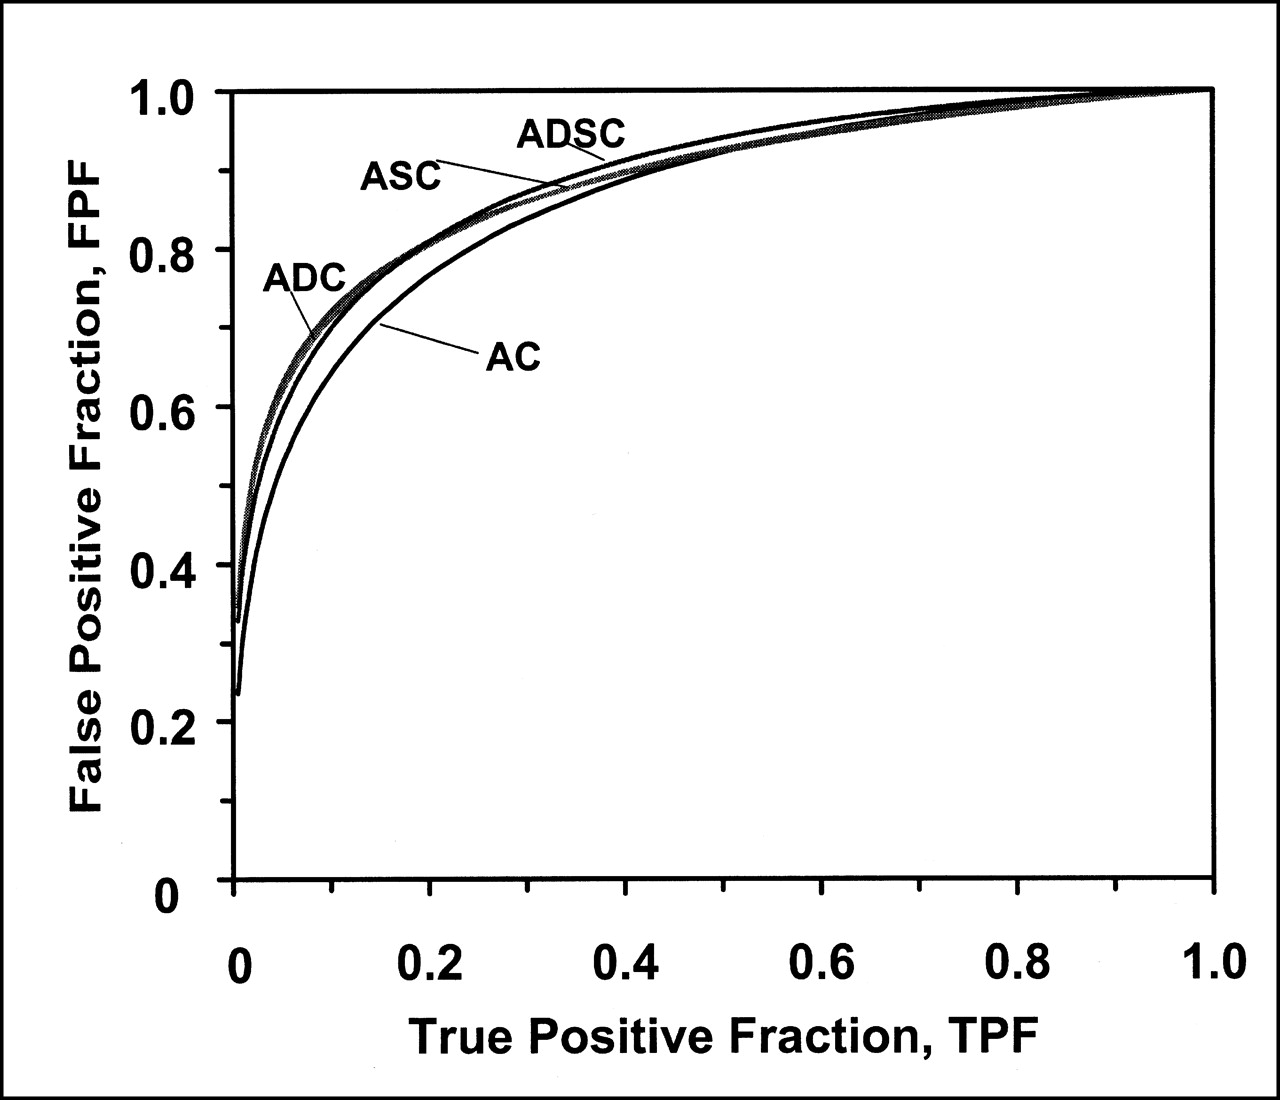
Average ROC curves for 4 compensation methods studied. Fitted ROC curves were averaged over 5 observers. For all methods, 6 iterations of OSEM with 16 subsets per iteration and an order 8 Butterworth postreconstruction filter were used with a cutoff value of 0.16 pixel−1.
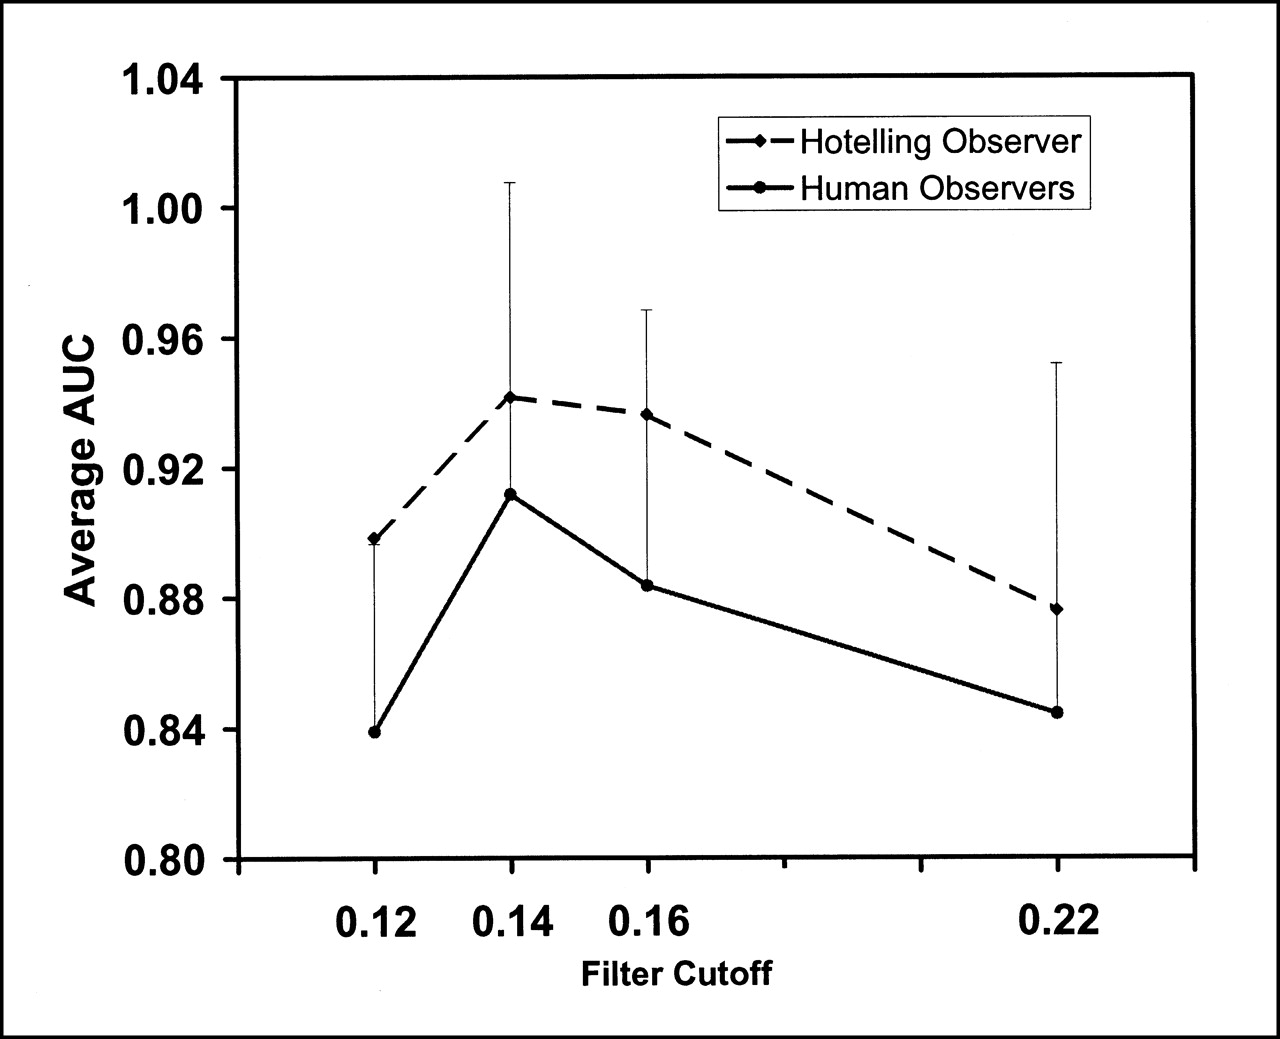
The results of the filter cutoff study are shown in Figure 4. The average ROC curve for a filter cutoff value of 0.14 pixel−1 is the highest and rightmost, indicating that this value gave the best performance of the cutoffs tested, followed by 0.16, 0.22, and 0.12 pixel−1. The upper 2 curves do not cross each other or the 2 lower curves, indicating that for any given operating point along the ROC curve, the sensitivity and specificity for a cutoff value of 0.14 pixel−1 were higher than those of 0.16 pixel−1, and in turn higher than 0.12 or 0.22 pixel−1. The Student t test showed that the 0.14 pixel−1 cutoff yielded higher performance than the other 3 methods (Table 4). Performance for a filter cutoff value of 0.14 pixel−1 was significantly higher than that for 0.22 or 0.12 pixel−1 (P < 0.02), but the difference between 0.14 and 0.16 pixel−1 was only marginally significant (P < 0.1). Performance for a filter cutoff value of 0.16 pixel−1 was significantly higher than that for 0.22 pixel−1 (P < 0.02). The average AUC values for filter cutoff values of 0.12, 0.14, 0.16, and 0.22 pixel−1 were 0.847, 0.977, 0.954, and 0.899, respectively.

Average ROC curves for 4 filter cutoff values studied. Fitted ROC curves were averaged over 5 observers. Six iterations of OSEM with 16 subsets per iteration and an order 8 Butterworth postreconstruction filter with cutoff values of 0.12, 0.16, 0.14, or 0.22 pixel−1 were used. Attenuation, detector response, and scatter compensation were performed on all images.
Discussion
The results of the present study raise several issues that need to be considered, foremost among them the limitations and clinical relevance of the study. The choice of phantom and noise levels in the simulated images may affect the outcome of both the compensation method study and the filter cutoff study. Patient anatomy, as well as defect size and extent, vary considerably in a clinical environment and affect detectability. However, a human observer study encompassing these variations would be prohibitively large. A CHO study can be performed on a much larger scale than a human observer study; but to reliably interpret CHO results, we need to demonstrate that CHO performance agrees with human observer performance.
The compensation method study showed that methods incorporating scatter and/or collimator-detector response compensation improved myocardial defect detectability compared with attenuation compensation alone, as measured by AUC. The amount of improvement, however, was small and not statistically significant. The separation in AUC observed among the treatments may be smaller than expected for some patient populations, since choices of phantom population and simulation parameters significantly influence observer performance in a detection task.
The set of images used in this study was originally designed to study the effects of attenuation compensation, and included anatomies that produce attenuation artifacts. Thus, anatomies that are prone to attenuation artifacts were heavily weighted. The set of images was not weighted toward anatomies in which the effects of scatter photons and detector response are likely to be most important, such as those with large amounts of subdiaphragmatic activity.
In addition, the level of statistical noise in this set of images was much higher than normally observed in clinical images. This high level was needed partly because the phantom population did not fully model the variability seen in patient populations. Thus, the improvement caused by the compensation methods may have been masked by the large amounts of statistical noise in this study. In real patient populations, patient variability plays a greater role in increasing the difficulty of the task, and scatter and detector response compensation may have a greater effect in improving image quality in these cases, as opposed to a case in which statistical noise is the limiting factor.
Recalling that a filter cutoff value of 0.14 pixel−1 was superior to 0.12, 0.16, or 0.22 pixel−1, detectability was higher for cutoff frequency values in the middle of the range studied. At lower cutoff frequency values, the images were smooth and blurry, making regions of higher or lower intensity more difficult to detect. At higher cutoff frequency values, the images were grainy and noisy, also making the detection task difficult.
A previous study (17) indicated that the optimal cutoff frequency was dependent on the size and extent of the defect. In a clinical setting, filter cutoff values are in the range of 0.25 pixel−1, significantly higher than the optimal value found by the current study. Since the noise level was high and the simulated defects were large, the question remains as to whether lower filter cutoff values provide greater detectability in a clinical situation. The answer requires clinical or phantom studies that include a range of defect sizes and clinically realistic noise levels.
To explore the correlation between CHO and human observers, the AUC values from this study were paired with those from a previous CHO study (data not shown). In that study, the CHO was used to evaluate the same 7 treatments applied to the same phantom population as in the current study. The rankings and Pearson correlation coefficients of the AUC values were computed for each of the 7 treatments. The correlation coefficients between the CHO and human observer AUC values and treatment rankings were 0.907 and 0.964 respectively, demonstrating good agreement between CHO and human observers, for both the filter cutoff and compensation method studies. This was true despite the fact that the noise textures for each treatment were very different.
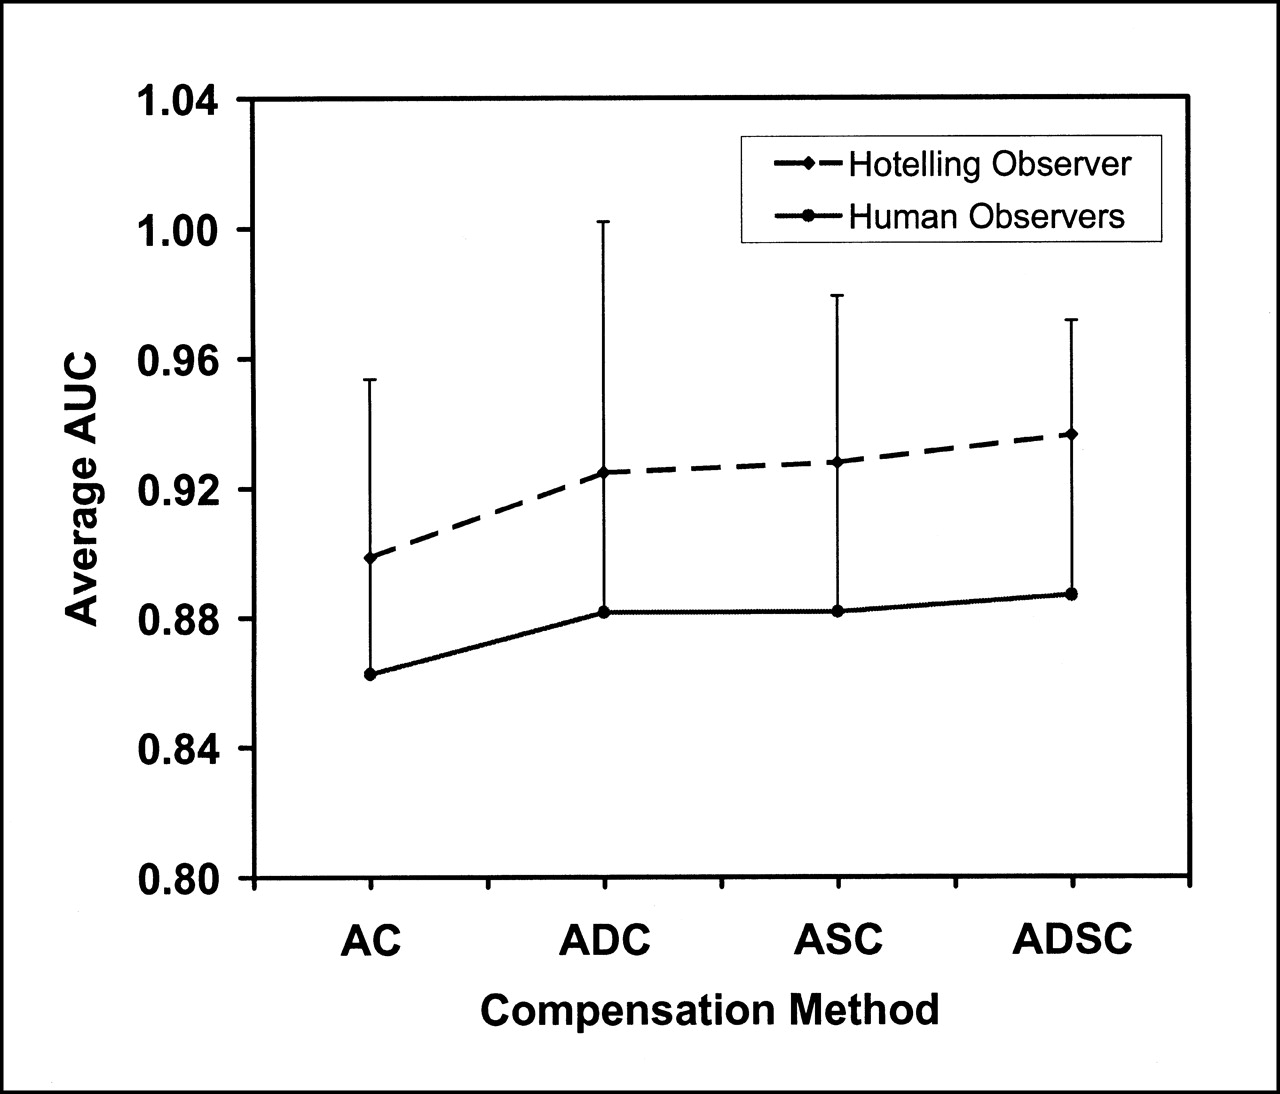
Although the CHO overestimated the actual AUC value, the correlation between the CHO and human observer AUC trends and treatment rankings was very strong (Figs. 5 and 6). In all cases but 1, the CHO exactly predicted trends and rankings of the human observers. A more sophisticated CHO model that includes observer internal noise (31) may provide a more accurate prediction of the actual AUC value of human observers.

Comparison of human and CHO results for 4 compensation methods studied. Error bars represent one SD.

Comparison of human and CHO results for 4 filter cutoff values studied: 0.12, 0.14, 0.16, and 0.22 pixel−1. Error bars represent one SD.
Although previous studies (23,24) have compared CHO and human observer results, in all of these cases the CHO study was conducted after obtaining the human results. The present CHO results were known before the observer study was conducted, thereby eliminating bias in the choice of CHO parameters. The observers had no knowledge of the CHO study or even of the different compensation methods and filter cutoffs that were used.
The results of this study indicate that with a relatively simple rectangular channel model, the CHO serves as a good predictor of human observer performance. This further validates the potential to use the CHO methodology to replace human observer studies for initial optimization and evaluation of reconstruction methods.
Conclusion
Compensation for scatter and detector response improved defect detectability compared with attenuation compensation alone, but the difference was relatively small and only marginally statistically significant. The phantom population and noise level may have affected these results, and certain patient populations may show a larger improvement with these compensation methods. An optimal filter cutoff frequency was found within the range of values studied, and this frequency was lower than the clinical norm. However, the optimal cutoff may depend on defect size, patient variability, and noise level.
Excellent agreement was achieved between the earlier CHO study and the human observer study. This agreement indicates that, even with the relatively simple channel model, CHO is a useful task-based measurement technique for optimizing and evaluating reconstruction algorithms and compensation methods in SPECT.
Acknowledgments
The authors thank the observers, Chiraporn Tocharoenchai, Stacia Sawyer, Sunita Sayeram, Xiyun Song, William Baird, and Paul Segars, for their time and effort. Sincere thanks are also due to Wen-Tung Wang for help with Perl scripts. Dr. Robert Kusy provided invaluable guidance and many motivational speeches during the preparation of this manuscript. This study was supported by the following grants from the National Institutes for Health (NIH): R01-HL61616 and R01-CA39463. Its contents are solely the responsibility of the authors and do not necessarily reflect the official views of the NIH or its various institutes.
Footnotes
Received Aug. 14, 2001; revision accepted Dec. 3, 2001.
For correspondence or reprints contact: Eric C. Frey, PhD, Department of Biomedical Engineering, CB # 7575, University of North Carolina, Chapel Hill, NC 27599.
E-mail: frey{at}bme.unc.edu
References
In this issue


Jump to section
Related Articles
Cited By...
- Influence of Reconstruction Parameters During Filtered Backprojection and Ordered-Subset Expectation Maximization in the Measurement of the Left-Ventricular Volumes and Function During Gated SPECT
- An Approach for Balancing Diagnostic Image Quality with Cancer Risk: Application to Pediatric Diagnostic Imaging of 99mTc-Dimercaptosuccinic Acid
- A Postprocessing Method for Compensation of Scatter and Collimator Blurring in SPECT: A Proof-of-Concept Study