


Abstract
The purpose of this study was to assess the diagnostic performance of quantitative SPECT of 99mTc-phytate colloid in detecting liver cirrhosis and to assess the correlation between the SPECT results and the severity of disease. Methods: Quantitative SPECT was performed on 60 patients (38 men, 22 women; mean age, 62.4 y) with liver cirrhosis and 36 control patients (21 men, 15 women; mean age, 58.7 y) without liver cirrhosis, and the results for the 2 groups were compared. Correlation with Child–Pugh classification and receiver operating characteristic methodology was used to analyze the results. Results: Cirrhotic livers had a lower total uptake than did control livers (35.6% ± 13.5% vs. 61.6% ± 10.2%, P < 0.0001). This reduced uptake was associated with a significantly reduced percentage injected dose per cubic centimeter (%ID/cm3) (0.024 ± 0.01 vs. 0.044 ± 0.01, P < 0.0001). The volume, 1,467 ± 348 cm3, was similar to that of control livers (1,487 ± 397 cm3, P = 0.80). Total uptake in the spleen was significantly greater in patients with cirrhosis than in control patients (24.9% ± 12% vs. 7.6% ± 3.2%, P < 0.0001) because of an increased volume (833 ± 460 cm3 vs. 239 ± 90 cm3, P < 0.0001). The %ID/cm3 of spleen tissue was 0.033 ± 0.01, which was similar to the value in control patients (0.032 ± 0.01, P = 0.88). Spleen volume showed the best performance in detecting liver cirrhosis, with a mean area under the curve of 0.97 (95% CI = 0.91–0.99). The severity of liver disease correlated better with total liver uptake (r = −0.68, 95% CI = −0.80 to −0.52, P < 0.0001). Conclusion: Individual SPECT quantitation of 99mTc-phytate colloid uptake in the liver and spleen could be used as a noninvasive method to separate normal from cirrhotic livers and to evaluate the severity of disease.
Quantitative determination of liver function is important for predicting outcome in patients with cirrhosis, particularly those undergoing hepatic resection or nonhepatic surgery or who are candidates for liver transplantation. Several conventional tests, including serum albumin, prothrombin time, serum choline esterase activity, and clearance of indocyanine green, have been used to evaluate hepatic function. Although these quantitative tests are valuable, they have their limitations and, in fact, none is a gold standard for assessing hepatic functional reserve. A simple, noninvasive, quantitative test that can show the severity of chronic liver disease is needed.
Since its introduction in 1973, 99mTc-phytate colloid has been used as an imaging agent for the liver and spleen (1). Subjective assessment of parameters such as the dimensions of the liver and spleen, colloid shift, and uptake of radiopharmaceutical in the bone marrow have been used for both diagnosis of liver cirrhosis and evaluation of its progression. However, subjective assessment of radiocolloid distribution has been shown to be unreliable, and quantitative techniques should be used to evaluate liver function (2). The distribution of radiocolloid uptake in the liver, spleen, and bone marrow has been shown to correlate well with the severity of chronic liver disease, the severity of histologic fibrosis, prognosis, and hepatic function (1,3–5). Thus, quantitation of liver and spleen uptake of 99mTc-phytate colloid provides a practical index of hepatic function.
The relative distribution of radiocolloid by the liver and spleen has been quantitated using planar and SPECT techniques (3–7). The ability to quantitate individual organ volumes and radiopharmaceutical concentrations with SPECT (8,9) led us to reassess 99mTc-phytate colloid scintigraphy of the liver and spleen as a quantitative test of hepatic function. In this study, quantitative SPECT methodology was used to determine liver and spleen volumes and individual 99mTc-phytate colloid uptakes by the liver and spleen in patients with liver cirrhosis and in control patients without chronic liver disease.
MATERIALS AND METHODS
Subjects
99mTc-phytate colloid quantitative SPECT of the liver and spleen was performed on 60 consecutive patients (38 men, 22 women; age range, 24–80 y; mean age, 62.4 y) with liver cirrhosis. The clinical evaluation included routine blood tests and determination of Child–Pugh classification (in the patients with cirrhosis) based on a scale of 1–3 for ascites (none, easily treated, refractory), bilirubin (<2, 2–2.9, ≥3 mg%), albumin (>3.5, 2.8–3.5, <2.8 g%), prothrombin time (>75%, 50%–75%, <50%), and hepatic encephalopathy (none, mild, difficult). According to this classification, 34 patients were in Child–Pugh class A (score of 5–7), 21 were in class B (score of 8–10), and 5 were in class C (score of 11–15). In 50 of the 60 cirrhosis patients, liver biopsy confirmed the diagnosis of cirrhosis. In the other 10 patients, biopsy was avoided because of significant coagulopathy, and the diagnosis of liver cirrhosis was based on clinical parameters. The etiology of cirrhosis was hepatitis C virus in 31 patients, hepatitis B virus in 8, alcoholic liver disease in 7, primary biliary cirrhosis in 6, autoimmune hepatitis in 4, and other causes in 4.
Thirty-six patients (21 men, 15 women; age range, 18–84 y; mean age, 58.7 y) without evidence of chronic liver disease served as a control group. 99mTc-phytate colloid scintigraphy was performed as part of the work-up of a liver space–occupying lesion. All had no history or clinical findings of liver or spleen diseases, normal liver and spleen scan findings as read by an expert in nuclear medicine, and a single focal defect of <2 cm present or suspected on another imaging study. All studies were clinically indicated, and our standardized routine liver and spleen planar scintigraphy protocol was performed with the addition of the quantitative SPECT. Informed consent was obtained before the study, which was approved by our institutional review board.
SPECT Technique
The patients received a 148- to 185-MBq (4–5 mCi) injection of 99mTc-phytate, and quantitative SPECT was performed 30 min later. The exact dose injected was determined by measuring the syringe in a dose calibrator before and after injection. The amount of radioactivity was corrected for decay. For data acquisition, a rotating gamma camera and an all-purpose, low-energy collimator were used. Data acquisition lasted 20 min and required 120 projections. Raw data were reconstructed by backprojection with a Hann filter with a cutoff point of 0.5 cycle per centimeter. After reconstruction, each image was sectioned at 1-pixel (0.68 cm) intervals in the transaxial, coronal, and sagittal planes using a 64 × 64 byte matrix. Volumes and radioactive concentrations were calculated on the coronal reconstruction data using the threshold method of Front et al. (8) and Iosilevsky et al. (9).
Threshold is the most used method for organ or tumor segmentation in SPECT studies (10–13). We use a simple, empiric method to measure volume and radiopharmaceutical concentration based on a fixed threshold to discern between background and target pixels (8,9). After performing a series of phantom measurements using volumes of 30–3,800 cm3 and concentrations of 0.37–133.20 kBq/cm3, we found that a threshold value of 43% was optimal for 99mTc (9). One should realize that when other equipment or other reconstruction algorithms are used, the threshold value and SPECT values of phantom concentration used for conversion of counts per voxel to kBq/cm3 should first be evaluated. Previous studies showed an excellent in vivo/in vitro correlation when using this method in human tumors and validated the method (9,14–18). This technique has been used with success in the evaluation of kidney function using 99mTc-dimercaptosuccinic acid (19), in the evaluation of 67Ga uptake in lymphomas (20), for prediction of pain relief in bone metastases treated with 186Re-etidronate (21), in the evaluation of bone turnover in various metabolic bone diseases (22), and for in vivo measurement of the tumor delivery of different drugs using 57Co-bleomycin and 195mPt-cisplatin (9,14,17,23).
The operator chose the slice to define the organ and drew a region of interest around it. For volume measurements (in cubic centimeters), the number of pixels containing activity greater than the threshold in all sections multiplied by the slice thickness was summed. For concentration measurements, the threshold value was subtracted from all pixels in the region of interest in all slices. All the nonzero pixels that had higher counts than the threshold value were used to calculate the concentration. Counts per voxel were converted into concentration units (kBq/cm3) using the regression line obtained previously by phantom measurements (9). The percentage of injected dose per cubic centimeter of liver and spleen tissue (%ID/cm3) was calculated using this value corrected for radioactivity decay. Liver and spleen uptake was then obtained by multiplying volume and %ID/cm3.
Statistical Analysis
Values are expressed as mean ± 1 SD (95% confidence interval for the mean). Groups were compared using the unpaired Student t test. Quantitative SPECT findings were correlated with severity of disease (Child–Pugh score) and expressed by the correlation coefficient (r) and its 95% confidence interval. P ≤ 0.05 was considered statistically significant. The results were analyzed using receiver operating characteristic methodology. Sensitivity, specificity, positive and negative predictive values, and accuracy (area under the curve) in detecting liver cirrhosis were calculated using the threshold value with the best cutoff for the presence of disease.
RESULTS
Control Group
Control livers had a volume of 1,487 ± 397 cm3 (1,350–1,585 cm3). The %ID/cm3 was 0.044 ± 0.01 (0.039–0.049), and the total liver uptake was 61.6% ± 10.2% (58%–65%). Control spleens had a volume of 239 ± 90 cm3 (208–269 cm3). The %ID/cm3 was 0.032 ± 0.01 (0.029–0.035), and the total spleen uptake was 7.6% ± 3.2% (6%–9%).
Cirrhosis Group
Cirrhotic livers had a lower total uptake (35.6% ± 13.5%, 32%–39%, P < 0.0001) than did control livers. This reduction was associated with a significantly reduced %ID/cm3 (0.024 ± 0.01, 0.022–0.027, P < 0.0001). The volume was 1,467 ± 348 cm3 (1,384–1,590 cm3), which was similar to the value in control patients (P = 0.80). Uptake in the spleen was significantly higher in patients with cirrhosis (24.9% ± 12%, 22%–28%, P < 0.0001) than in control patients because of an increased volume (833 ± 460 cm3, 714–952 cm3, P < 0.0001). The %ID/cm3 was 0.033 ± 0.01 (0.029–0.036), which was similar to the value in control patients (P = 0.88) (Table 1).
Quantitative SPECT Results for Liver and Spleen
Receiver Operating Curve Analysis
The threshold used for calculating the sensitivity, specificity, and positive and negative predictive values was the best cutoff found for the presence of liver cirrhosis. The threshold, sensitivity, specificity, positive and negative predictive values, and mean area under the receiver operating characteristic curve indicating successful detection of liver cirrhosis are shown in Table 2. Spleen volume, total liver uptake, and total spleen uptake performed best in detecting liver cirrhosis, with mean areas under the curve of 0.97 (0.91–0.99), 0.94 (0.87–0.94), and 0.93 (0.86–0.97), respectively (Fig. 1).

Receiver operating characteristic curves for volume, %ID/cm3, and total uptake for liver and spleen.
Results of ROC Curve Analysis for Detecting Liver Cirrhosis
Correlation with Severity of Disease
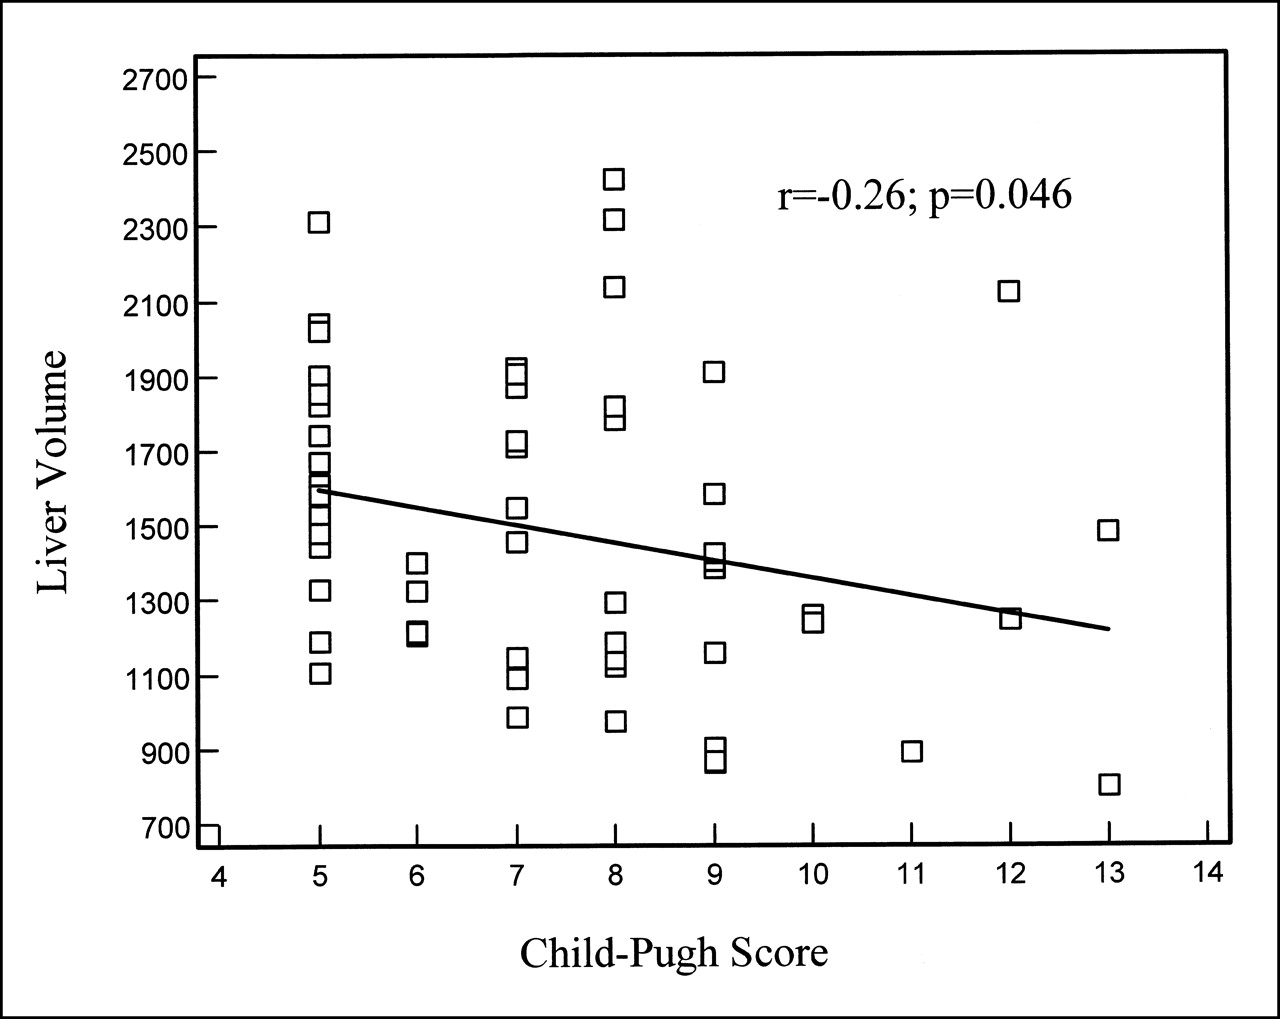
A significant correlation was found between the Child–Pugh score of chronic liver disease and all quantitative SPECT parameters except %ID/cm3 of spleen tissue (Table 3). A good inverse correlation was found between liver uptake and severity of disease (Fig. 2). A poor correlation was found between liver volume and severity of disease (Fig. 3).
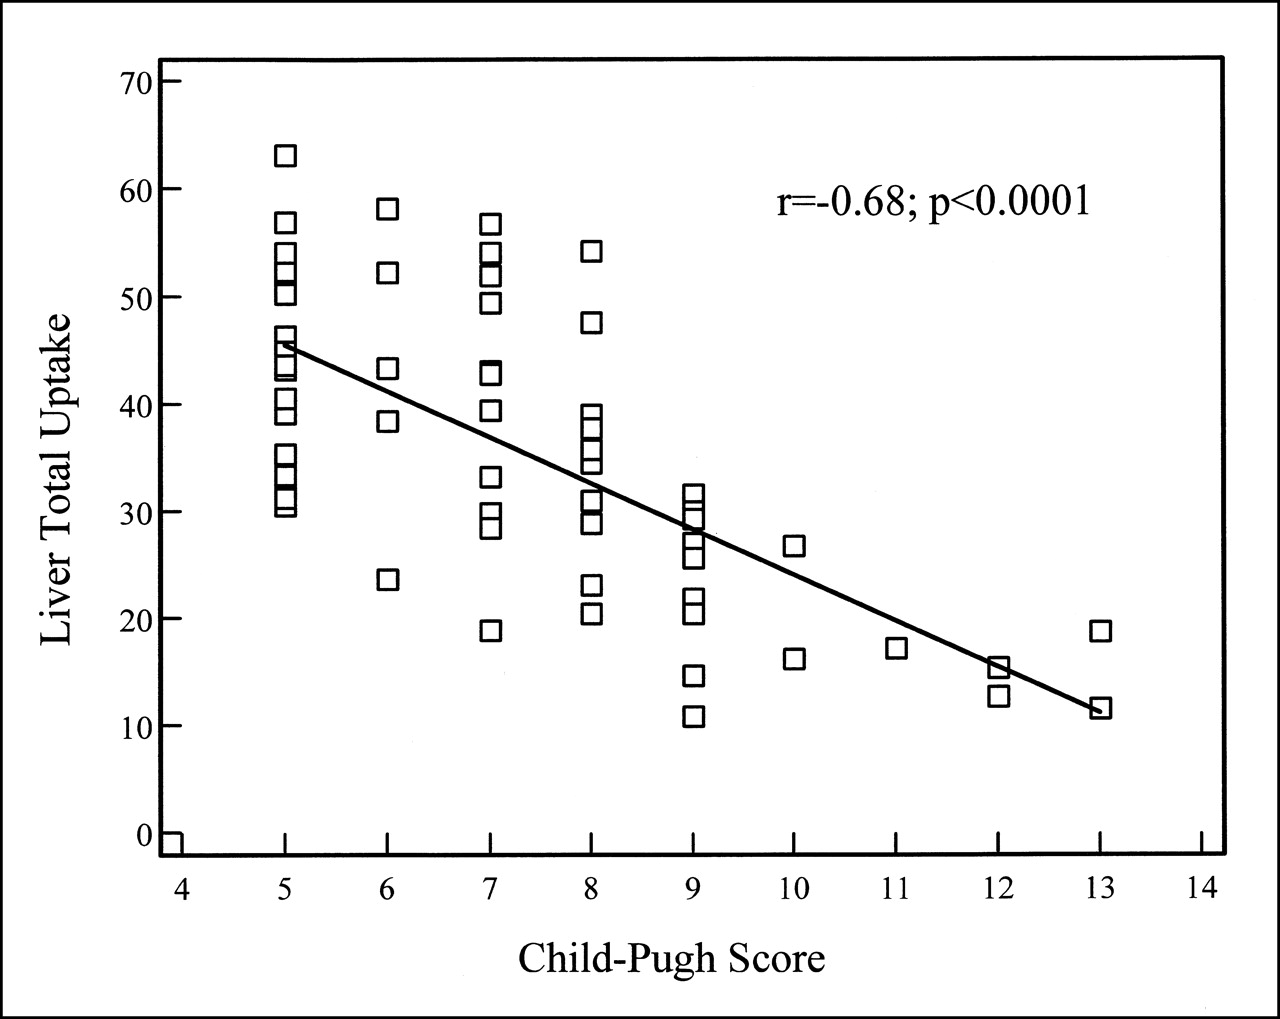
Relationship between total liver uptake and Child–Pugh chronic liver disease classification. These parameters correlate inversely and are statistically significant.

Relationship between liver volumes and Child–Pugh chronic liver disease classification. These parameters correlate poorly and are statistically significant.
Correlation Between Quantitative SPECT and Child–Pugh Score (n = 60)
DISCUSSION
In liver cirrhosis, hepatocytes and Kupffer cells are equally affected by the fibrotic process (3–5). A 99mTc-colloid liver and spleen scan shows the distribution of the perfused Kupffer cell mass, which is proportional to the perfused hepatocyte mass. Hoefs et al. (3–5) studied the relative distribution of radioactive colloid in cirrhotic livers using planar and SPECT techniques. They showed that the Kupffer cell mass determined by the degree of relative hepatic and splenic uptake of colloid particles by the cells of the reticuloendothelial system correlates with disease severity and hepatic function in liver cirrhosis. They also implied that radioactive colloid distribution is a better estimate of disease severity than are our best invasive tests (3). Thus, the separate uptake of radioactive colloid by the liver could be used as an index of perfused hepatic mass to evaluate the severity of chronic liver disease, prognosis, and hepatic function. Spleen volume undergoes modifications during the course of chronic liver disease. Measurement of spleen volume and individual uptake of radiocolloid by the spleen could be useful in evaluating portal hypertension and spleen hyperfunction in patients with cirrhosis.
Estimates of organ volume and uptake by planar scintigraphy are not reliable (5,9,11,24). Quantitation of volumes and radiopharmaceutical uptake in a target organ or tumor by the technique of Front et al. (18) has been shown to be clinically reliable and useful (18–22). Quantitative SPECT provides information on the %ID/cm3 of liver and spleen tissue and on liver and spleen volumes. By multiplying these 2 parameters, one can obtain the individual liver and spleen uptakes, which may provide a practical index for evaluation of liver and spleen function.
In this study, quantitative SPECT was performed on 60 patients with liver cirrhosis and on 36 patients without liver cirrhosis. Cirrhosis patients showed a significant decrease in total liver uptake and a significant increase in total spleen uptake of 99mTc-phytate compared with control patients. The decrease in liver uptake was caused by a significant decrease in the %ID/cm3 of liver tissue with no significant change in liver volume. This may represent liver dysfunction caused by depletion of Kupffer cells. In the spleen, however, the increased total uptake was caused by a significant increase in spleen volume with no change in the %ID/cm3 of spleen tissue. A large spleen with normal uptake of 99mTc-phytate colloid per cubic centimeter of spleen tissue may represent spleen hyperfunction caused by portal hypertension.
In alcoholic cirrhosis, the 2 liver lobes are affected differently, with the left lobe being preserved and sometimes even hypertrophied during the course of the disease. Because our population included few individuals with alcoholic cirrhosis, and because of technical factors such as lack of anatomic markers for an accurate determination of right and left liver lobes, this study could not distinguish between the various types of cirrhosis or evaluate whether the liver volumes were maintained by left lobe hypertrophy. There are, hypothetically, several advantages to performing individual quantitation rather than the more simple relative quantitation that merely determines the fractional distribution of radiocolloid between the liver and spleen (liver-to-spleen ratio). The liver-to-spleen ratio is dependent on spleen volume (12). Some patients may have no spleen, and the method could be used to evaluate the individual liver uptake of radiocolloid. Individual quantitation may also be useful in the follow-up of patients when relative uptake remains unchanged but the disease progresses or improves.
Individual quantitation provides a criterion for normality and abnormality for hepatic cirrhosis. A spleen volume > 389 cm3 showed the largest area under the curve, with a sensitivity of 90% and specificity of 100%, in separating patients with liver cirrhosis from patients without liver cirrhosis. Only 6 of 60 patients with cirrhosis had a spleen volume < 389 cm3. Supplemental liver uptake < 47.6% improved sensitivity to 95% (57/60), and the combination of spleen volume > 389 cm3, liver uptake < 47.6%, and spleen uptake > 14.9% had a sensitivity of 96.7% (95% CI = 88.5%–99.6%, 58/60) in separating patients with liver cirrhosis from patients without liver cirrhosis.
Although spleen volume performed best in detecting liver cirrhosis, total liver uptake correlated better with severity of chronic liver disease. Total hepatic uptake represents the perfused hepatic mass and correlated inversely with clinical parameters that reflect the severity of liver fibrosis.
CONCLUSION
Quantitative SPECT of liver and spleen uptake of 99mTc-phytate colloid is a noninvasive method that can separate normal from cirrhotic livers and be used to evaluate the severity of chronic liver disease. Further longitudinal studies on more patients with different disease etiologies and stages are warranted to assess the significance of this technique in the diagnosis and assessment of disease progression in patients with liver cirrhosis.
Footnotes
Received Jun. 5, 2001; revision accepted Nov. 12, 2001.
For correspondence or reprints contact: David Groshar, MD, Department of Nuclear Medicine, Bnai Zion Medical Center, 47 Golomb St., P.O. Box 4940, Haifa, Israel, 31048.
E-mail: d.groshar{at}b-zion.org.il
REFERENCES
In this issue


Jump to section
Related Articles
Cited By...
- No citing articles found.