


Abstract
Diagnosis of pulmonary embolism (PE) by visual interpretation of ventilation/perfusion (V/Q) scans is limited by the high percentages of patients classified in the intermediate- and low-probability categories. This study proposes a quantitative analysis of the distribution of V/Q ratios to better identify patients with PE. Methods: We studied 99 consecutive patients who underwent dual-isotope 81mKr/99mTc-macroaggregate V/Q scanning and arterial blood gas analysis within 48 h. The 8-view V/Q scans were visually analyzed by 2 observers according to the revised criteria of the Prospective Investigation of Pulmonary Embolism Diagnosis (PIOPED) (normal scan or low, intermediate, or high probability of PE). Quantitative analysis of the posterior-view distribution histogram of V/Q ratios was performed using dedicated software. Briefly, regions of interest were drawn around the lungs on the matched V/Q images, smooth filtering was applied, normalized regional V/Q ratios were calculated within each pixel, and a distribution histogram was built. Results: Patients with normal scans (n = 16) had a predominance of V/Q ratios (63.3% ± 13.0%) between 0.8 and 1.2. They had only 9.8% ± 5.8% of ratios > 1.2, and the remaining 26.9% ± 7.5% of ratios were <0.8. By contrast, patients with PE (n = 34) were characterized by a significant increase (15.5 ± 10.0%, P = 0.04) in high V/Q ratios (>1.2) and a significant increase (34.5% ± 8.2%, P = 0.003) in low V/Q ratios (<0.8). Interestingly, a similar pattern was found in patients with a high PIOPED probability of PE, 21.3% ± 11.0% and 37.5% ± 9.2%, respectively. Within the nondiagnostic group (intermediate- + low-probability scans, n = 58), 17 patients were finally diagnosed with PE. Analysis of the distribution histogram in this group allowed the identification of 5 patients with PE (specificity, 78%). Conclusion: A quantitative approach to lung scan interpretation, based on the distribution histogram of V/Q ratios, may be helpful for categorizing patients with suspected PE.
Intermediate- and low-probability ventilation/perfusion (V/Q) scans are the stumbling blocks of pulmonary embolism (PE) diagnosis by lung scintigraphy. In the original Prospective Investigation of Pulmonary Embolism Diagnosis (PIOPED), intermediate- and low-probability scans represented, respectively, 39% and 33% of the total for 931 patients (1). However, the actual occurrence of PE in 30% of patients diagnosed with intermediate-probability scans and in 14% of patients diagnosed with low-probability scans has led the investigators to point out the risk of excluding the diagnosis of PE under these conditions and to advocate that these 2 categories be combined to form a nondiagnostic category (2,3). Therefore, various strategy algorithms for the diagnosis of PE, associating lung scan to other noninvasive techniques, have been proposed to overcome these difficulties and to reduce the number of patients for whom pulmonary angiography remained necessary (3–5).
Converging toward the same objectives, reanalysis of the PIOPED data has led to revision of the PIOPED criteria and, later, to introduction of even more refined criteria for V/Q scan interpretation, which partly succeeded in reducing the number of intermediate- or low-probability scans, further increasing the accuracy of lung scanning (6,7). Nonscintigraphic studies, using multiple perfusions of inert gases, have demonstrated an abnormal distribution of lung V/Q ratios in PE, associating alveolar units with high V/Q ratios to alveolar units with low V/Q ratios, and have helped explain the abnormalities of blood gas exchange (8,9). In addition, quantitative analysis of lung scans, featuring regional V/Q measurements, have demonstrated that these high V/Q units, typically because of a reduction in perfusion with conserved ventilation, were observed in the areas of PE, that is, in mismatched defects (10–13). However, up to now, the V/Q distribution observed in the various probabilistic lung scan categories defined for the diagnosis of PE has not been reported.
In the present study, the patterns of V/Q distribution in scans showing normal findings and scans showing a low, intermediate, or high probability of PE were investigated in 99 patients with suspected PE. An attempt was made to identify a distribution histogram that may guide the identification of patients with PE among those having intermediate- and low-probability scans.
MATERIALS AND METHODS
Population Characteristics
We studied 314 consecutive patients who were hospitalized in our institution and who had undergone V/Q lung scanning for clinically suspected PE during the 17-mo period from January 1999 to May 2000. Of these patients, we selected 99 who underwent both dual-isotope 81mKr/99mTc-macroaggregate (MAA) V/Q scanning and arterial blood gas analysis within the previous or next 48 h. We excluded the remaining patients, who underwent either 99mTc-aerosol scanning, no ventilation scanning, or blood gas analysis more than 48 h before or after scintigraphy. The age range was 19–93 y; patient characteristics are summarized in Table 1.
Patient Characteristics
The average delay between V/Q scanning and arterial blood gas analysis was less than 1 d. Partial oxygen (PaO2) and carbon dioxide (PaCO2) arterial blood pressures were measured in ambient air for all patients. In addition, the alveolar-arterial oxygen pressure differences (A-aDO2), in millimeters of mercury, were computed using the formula A-aDO2 = 150 − PaCO2/0.8.
Diagnosis of PE
The presence or absence of PE was determined from the final diagnosis written in the medical record. The pretest clinical probability of PE was determined by the referring physician according to risk factors for venous thromboembolism; physical symptoms; and the results of arterial blood gas analysis, electrocardiography, and chest radiography. The diagnostic criteria for the presence of PE were a helical CT scan showing PE, a high-probability lung scan, or deep venous thrombosis shown by lower-limb venous compression ultrasonography, associated with a high clinical probability of PE. By contrast, a diagnosis of PE was eliminated in the presence of normal pulmonary angiography findings, normal or near-normal lung scan findings, or a low clinical probability of PE, with nondiagnostic results from lung scanning and the absence of deep venous thrombosis on lower-limb ultrasonograms.
Imaging Protocol
All patients underwent the same 81mKr/99mTc-MAA imaging protocol. Perfusion scans were obtained on a supine patient immediately after intravenous injection of 185 MBq 99mTc-MAA. At the same time, ventilation scans were obtained while the patient continuously breathed 81mKr gas using a mouth mask. The 81mKr was eluted from the generator (Kryptoscan; Mallinckrodt, Les Ulis, France) using humidified air at 3 L/min. A set of 8 planar projections was obtained for each patient (in anterior, posterior, right lateral, left lateral, and 4 oblique views) using double-peak energy windowing (140 keV ± 10% and 190 keV ± 10%). Images were acquired in 128 × 128 matrices, during 5 min for each (or 750 kilocounts) and using a dual-head gamma camera at 180° (Helix; Elgems, Haifa, Israel) equipped with low-energy, all-purpose collimators. Down-scatter of 81mKr was measured for 10 patients with the same camera and collimator settings, and 24% of the 81mKr counts were found to be present in the 99mTc window during ventilation, accounting for only 5% of the 99mTc activity during 185-MBq perfusion imaging. The total acquisition time was approximately 20 min.
Visual Analysis.
Lung scans were interpreted visually by a consensus of 2 observers. Perfusion defects were scored as small (<25% of a segment), moderate (25%–75% of a segment), or large (>75% of a segment), according to the revised PIOPED criteria (6). Patients were subsequently separated into 4 groups: normal, low-probability, intermediate-probability, and high-probability scans (6).
Calculation of Regional V/Q Ratios.
On the posterior views, regions of interest were manually drawn around the lungs, guided by an isocount of 20% of the maximum, so as to delineate the largest external lung contour of either the ventilation images or the perfusion images and allow subtraction of background noise without loss of lung information. Ventilation and perfusion images were then smoothed using median filtering, followed by low-pass filtering with a 9-point kernel, to avoid local noise. Within each pixel and as previously described (14), regional (R) V/Q ratios were calculated by normalization to the total lung counts (T) using the formula V/Q = (VR/VT)/(QR/QT). Calculation was performed using a custom program on our Xpert 3.3 workstation (Elgems, Haifa, Israel).
Distribution Histogram.
For each patient, we obtained an average of 869 ± 185 normalized V/Q ratios (pixels) within the 2 lungs. These ratios were ranked and gathered by intervals of 0.4 (starting at <0.4 and ending at >2.0). For each interval, the number of pixels having a value within this range was plotted on the y-axis to build a histogram of the V/Q distribution. Because lung size varied from one patient to another, the number of V/Q ratios was preferentially expressed as a percentage of the total number of pixels within the 2 lungs. The first 2 moments (mean and SD) of the histogram were computed. These histograms were analyzed in the normal-scan patients and PE patients, as well as within the different PIOPED categories, to define characteristic patterns of distribution. Moreover, within the nondiagnostic group, defined by the revised PIOPED classification as including low- and intermediate-probability scans, we attempted to identify patients with PE using different combinations of V/Q abnormalities and receiver operating characteristic curves.
Statistical Analysis
The variables that issued from the histogram analysis were expressed as mean ± SD. First, their correlation with the presence or absence of PE, as defined by the medical record diagnostic criteria, was determined using unpaired t testing. These variables were then compared within the 4 PIOPED subgroups using ANOVA. Within each subgroup, PaO2 and A-aDO2 were compared with the histogram variables using regression analysis. Statistics were performed with StatView 5.0 software (SAS Institute Inc., Cary, NC), and a P value lower than 0.05 expressed a significant difference.
RESULTS
Visual Analysis of Lung Scans
The prevalence of PE in our population was 34%. This prevalence did not differ according to whether the patients had a history of cardiopulmonary disease. Patients with PE had an average of 2.2 ± 2.6 large mismatches, 0.5 ± 0.9 moderate mismatches, and 0.2 ± 0.8 small mismatches. By contrast, patients without PE had an average of only 0.5 ± 1.5 large mismatches (P < 0.0001) and a similar number of moderate (0.3 ± 0.6) or small (0.1 ± 0.2) mismatches (P = not statistically significant).
In the studied population, more than half the patients had intermediate-probability or low-probability scans: 45% and 13%, respectively (Table 2). Only 16% of patients had normal scans, and 25% had high-probability scans. The frequencies of PE within each scan category are given in Table 2; sensitivity and specificity are reported in Table 3. Given the absence of PE in patients with normal V/Q scans, this group was considered the reference of normality for the analysis of V/Q ratio distribution.
Prevalence of PE Within the 4 Revised PIOPED Categories
Comparison of Scan Categories with Final Diagnosis of PE
Distribution Histograms of V/Q Ratios According to Clinical Diagnosis
Distribution histograms of V/Q ratios in patients with normal scans, in patients without PE, and in patients with confirmed PE are summarized in Table 4. Patients with normal scans showed a predominance of V/Q ratios (63.3%) between 0.8 and 1.2, the distribution being centered on a mean value of 0.87 and having an SD of 0.33. Only 9.8% of ratios were >1.2, and the remaining 26.9% of ratios were <0.8. By contrast, patients with PE were characterized by a significant increase (15.5%) in high V/Q ratios (>1.2) and a significant increase (34.5%) in low V/Q ratios (<0.8). The appearance of 2 “peaks” at both extremities of the histogram was responsible for a subsequent reduction (50.0%) in the middle values (0.8 to 1.2) and for a widening of the SD (0.44), without modification of the mean (0.89). The high proportion of V/Q ratios > 1.2 in patients with PE correlated with the number of mismatches, with r = 0.87 (P < 0.0001). Typical histogram shapes in a patient with a normal scan and in a PE patient are presented in Figure 1.

Examples of V/Q distribution in patient with normal scan (A) and in patient with confirmed PE (B). Histogram shapes characteristically demonstrate single peak in 0.8–1.2 range in patient with normal scan and bimodal distribution in low (<0.8) and high (>1.2) ranges in PE patient.
Distribution Histograms of V/Q Ratios Depending on Scan Normality and Absence or Presence of PE
Distribution Histograms of V/Q Ratios in PIOPED Classes
Distribution histograms of V/Q ratios in the 4 PIOPED categories are summarized in Table 5. The high-probability group was characterized by a distribution close to that observed in PE patients, with a significantly higher proportion of V/Q ratios > 1.2, a higher proportion of V/Q ratios < 0.8, and lower middle values. In addition, the high-probability and intermediate-probability groups differed significantly from the normal group by a significantly higher percentage of extremely low V/Q ratios (<0.4).
Distribution Histograms of V/Q Ratios Within the 4 PIOPED Categories
V/Q Distribution and Arterial Blood Gases
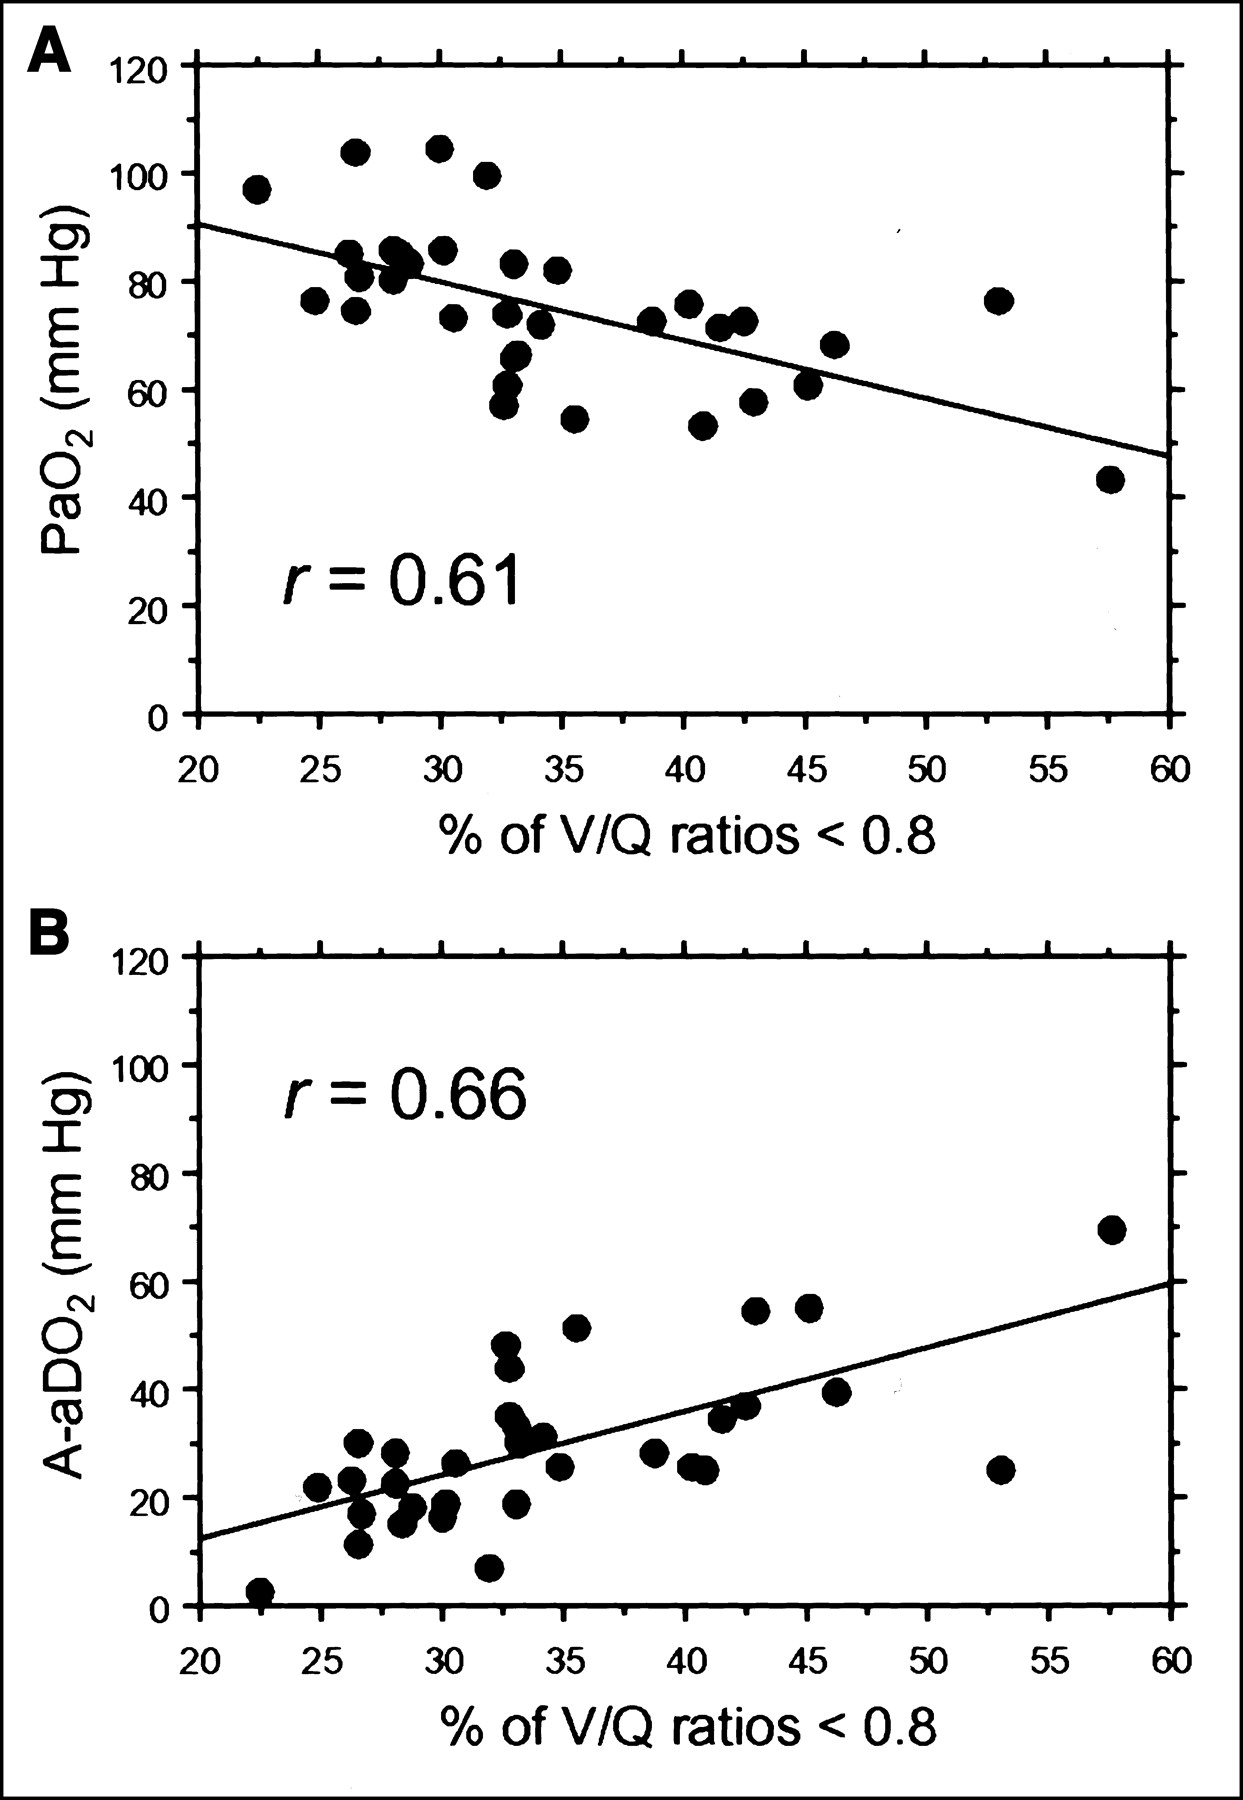
In the PE patients, PaO2 measured within 48 h of lung scanning averaged 75 ± 14 mm Hg. This value was slightly higher, 82 ± 15 mm Hg, in patients with normal scans. In addition, we found a significant inverse relationship between PaO2 and the proportion of V/Q ratios < 0.8 (r = 0.61, P = 0.0001, Fig. 2A) and, to a lesser extent, between PaO2 and the SD (second moment) of the distribution (r = 0.40, P = 0.02). Furthermore, when considering A-aDO2, we found a significant positive relationship between it and the proportion of V/Q ratios < 0.8 (r = 0.66, P < 0.0001, Fig. 2B) and, to a lesser extent, between it and the SD of the distribution (r = 0.48, P = 0.005).

Correlation between distribution histogram and arterial blood gases in patients with confirmed PE. (A) Inverse relationship exists between percentage of low V/Q ratios and PaO2 (regression equation: y = −1.09x + 112.7). (B) Relationship is positive between percentage of low V/Q ratios and A-aDO2 (regression equation: y = +1.17x − 11.2).
Reclassification of Nondiagnostic Group
Within the nondiagnostic group as defined by the revised PIOPED classification (n = 58), PE was finally diagnosed in 17 patients (Tables 2 and 5). The distribution histogram of V/Q ratios in these patients did not differ significantly from that of the non-PE patients. However, when considering the patients of this nondiagnostic group who had both more than 30% of V/Q ratios > 1.2 and more than 13% of V/Q ratios < 0.8, we could identify a subgroup of 14 patients of whom 5 had PE. For this subgroup, the sensitivity for PE was 29% (5/17) and the specificity was 78% (32/41). Thresholds of 13% and 30% were determined on receiver operating characteristic curves and were thought to characterize, within the nondiagnostic group, a high-probability V/Q pattern for the diagnosis of PE. Furthermore, among these 5 patients, 3 were noticed to have at least 1 large segmental defect equivalent. When this information was integrated as an additional criterion of selection, the specificity for detection of PE within the nondiagnostic group increased to 98% (40/41), whereas the sensitivity dropped to 18% (3/17).
DISCUSSION
Quantitative analysis of V/Q lung scans was able to individualize, in patients with PE and in patients with high-probability scans, a characteristic pattern of V/Q ratio distribution with a bimodal histogram emphasizing a greater proportion of high and low V/Q ratios. This pattern is consistent with that reported for other techniques in PE and with the pathophysiology of blood gas exchange in this disease (8,9). Moreover, using this pattern as a diagnostic criterion demonstrates a potential for increasing the specificity of V/Q scans in patients suspected of having PE, thus reducing the percentage of nondiagnostic scans.
In the normal group, quantitative analysis of V/Q distribution confirmed that more than 60% of V/Q ratios fall between 0.8 and 1.2, which is consistent with the normal distribution already described in supine subjects with nuclear techniques (11,15). By contrast, V/Q distribution in the PE patients was characterized by a simultaneous higher proportion of V/Q ratios at both extremities of the histogram (V/Q > 1.2 and < 0.8), with subsequent widening of the second moment of the distribution (SD) and flattening of the middle peak. Such a pattern has already been described in PE using 81mKr/81mKr or 81mKr/99mTc-MAA V/Q scans, through either planar or SPECT studies (10–12). The high proportion of V/Q ratios > 1.2 is explained by the preferential reduction in perfusion observed within the regions of emboli: It is responsible for a dead-space effect, qualitatively assessed on the lung scan by the mismatched appearance (8,9). The low V/Q values are mainly due to a shifting of blood flow away from the regions of emboli toward regions with normal ventilated units, as has been described in man using the multiple inert gas elimination technique (MIGET) (8,9). Consequently, V/Q inequality and low V/Q ratios can explain the hypoxemia observed in most cases of PE, as has been shown (9). The inverse relationships observed in this study between PaO2 and the SD of the distribution, as well as between PaO2 and the percentage of low V/Q in patients with PE, strongly agree with the observation made using MIGET and strengthen the value of quantitative lung scan analysis in this setting, as previously observed in patients with chronic obstructive pulmonary disease (16). Furthermore, one might hypothesize that the regression analysis would have been better if the arterial blood gases had been analyzed at the moment of lung scanning.
Besides the fact that diagnosis of PE was not based on pulmonary angiograms and the fact that we used 81mKr, instead of 133Xe, for ventilation, the studied population is consistent with that of the original PIOPED study, with a 34% prevalence of PE, versus 33% in PIOPED (1). Using the revised criteria (6), we also demonstrated that lung scanning could establish the diagnosis or exclude PE in a minority of patients. Only 16% of patients had a normal lung scan, allowing PE to be excluded with an overall sensitivity of 100%. In addition, the proportion of PE in the high-probability group (presence of at least 2 segmental mismatched equivalents) was 68%. Consequently, patients with high-probability scans had the greatest V/Q distribution inequality. These patients had the highest proportion of both high V/Q ratios (8.5% of ratios > 1.6) and low V/Q ratios (37.5% of ratios < 0.8); their V/Q distribution pattern was significantly different from the patterns of the 3 other groups.
To improve the accuracy of lung scan interpretation for the diagnosis of PE, new scan-reading criteria have been developed that have increased the number of patients whose scan can be considered of high probability (7,17). Using planar scintigraphy, computation of regional V/Q ratios in regions of perfusion defects has permitted the identification of high V/Q ratios related to PE, even though the defects were small or associated with decreased regional ventilation (11). Furthermore, SPECT studies have recently been conducted (12,13,18,19). In particular, Palmer et al., using aerosolization of 99mTc-DTPA, has proposed an interesting approach to V/Q scan quantification that computes a parametric V/Q quotient image and was shown to optimize the visualization of mismatched regions (13). However, the accuracy of these quantitative methods for the identification of PE patients within the nondiagnostic group has not yet been evaluated.
In the present study, we hypothesized that PE patients within the nondiagnostic group could possibly be identified on the basis of a distribution histogram closely resembling that observed for confirmed PE. Using a selection criterion requiring both that more than 30% of V/Q ratios be <0.8 and that more than 13% of V/Q ratios be >1.2, we demonstrated that 5 of 17 patients within the nondiagnostic group could correctly be reclassified as having PE, with a specificity of 78%. When we added the requirement that at least 1 segmental mismatched equivalent be present, specificity increased to 98%. To our knowledge, this study was the first to describe such an analysis within the revised PIOPED categories. We emphasize that histogram-based quantification may have an incremental diagnostic value over qualitative analysis alone and can be a helpful approach.
Some technical considerations deserve additional discussion. First, histogram analysis of V/Q ratios took advantage of the natural superimposition of ventilation and perfusion images due to simultaneous dual-isotope acquisition. Accurate quantification would have been more challenging if 133Xe- or 99mTc-based molecules had been used for ventilation. Second, a question may arise about the fact that we compared a qualitative analysis (PIOPED) of 8-view scans with a quantitative analysis of only 1 view. The correlation between the histogram distribution of V/Q ratios and the visual analysis would probably have been best determined by our taking advantage of the 8 views. However, the posterior view represents the global distribution of perfusion and ventilation, as stated by most studies. We intentionally did not combine information from the other views because computation of the geometric means of the pixels would have been necessary, and the physiologic validity of this approach to computing V/Q ratios has not been demonstrated. Even though the histogram analysis was of the posterior view only, our findings were consistent with pathophysiology since we demonstrated the expected relationships between V/Q distribution and arterial blood gases (Fig. 2).
The superimposition of regions of low perfusion on regions of normal perfusion for the posterior view can explain why we did not obtain high V/Q ratios in patients with PE. In addition, compared with the methods relying on inert gases (MIGET), the histogram analysis performed in the present study may be considered low resolution because it is limited by the pixel size, with 1 pixel containing thousands of alveolar units (partial-volume effect). However, our approach has the advantage of furnishing information on regional spatial distribution, which cannot be obtained without imaging.
Most of these limitations would probably be solved by using SPECT instead of planar imaging. In addition, qualitative and quantitative analyses would take into account hidden pulmonary segments that cannot be reliably assessed using planar imaging, such as the medial basal segment.
CONCLUSION
The present study emphasizes that a quantitative approach to lung scan interpretation, based on the pathophysiologic concept of a distribution histogram of V/Q ratios, may be helpful for the categorization of patients with suspected PE. Indeed, even after the revision of PIOPED criteria (6), qualitative interpretation of lung scans still needs refinement (20,21). The proposed method is in keeping with this process but remains limited by the planar mode of acquisition. It will certainly be improved by the use of the tomographic mode, and further research is needed in this direction.
Acknowledgments
The authors address special thanks to Emmanuelle Beaufour, computer engineer at GE Medical Systems (Buc, France), for her assistance in writing the software used for the calculation of V/Q ratios. This study was presented in part at the 48th annual meeting of the Society of Nuclear Medicine; Toronto, Ontario, Canada; June 2001.
Footnotes
Received Apr. 4, 2002; revision accepted Jul. 9, 2002.
For correspondence or reprints contact: Emmanuel Itti, MD, Service de Médecine Nucléaire, CHU Henri Mondor, 51 avenue du Maréchal de Lattre de Tassigny, 94010 Créteil, France.
E-mail: eitti{at}wanadoo.fr


