


Abstract
Location of the sentinel lymph node in malignant melanoma and early breast cancer patients requires separate injections of radiocolloid and blue dye. These agents are administered at alternative times because of their different rates of transit. This study has elucidated why particular dyes are absorbed by the lymphatic system from an investigation of dye molecular structure as a function of protein binding ability. Methods: A dye-protein binding assay was developed using size-exclusion chromatography and ultraviolet spectrophotometry and applied to a series of 20 sulfonic acid group-containing dyes. Radiochemical analyses were also used with 3 99mTc-labeled dyes to rationalize which functional groups are involved in the protein binding reaction. Results: Methylene blue resulted in no protein affinity at 37°C, whereas disulfonate dyes separated by 1 atom such as Patent blue or Indigo carmine gave <30% binding. Optimum protein binding (84%–100%) was achieved with those dyes containing at least 2 sulfonic acid groups separated by 2–6 atoms in their chemical structure. Seven symmetric tetrasulfonic acid azo dyes were examined, including Evans blue, to result in 59%–71% binding. Conclusion: Ionizable groups (sulfonic acids) that are present in the structure of dyes are directly involved in dye-protein binding. At the molecular level, there is a sulfonation reaction between sulfonic acid dyes and amino groups on the protein surface to form sulfonamide complexes. This reaction shows how the soluble dyes Evans blue and Patent blue are trapped in lymph after subdermal injection during the sentinel node biopsy procedure.
Sentinel lymph node biopsy is a new and valuable technique to assess the nodal status of patients with malignant melanoma and early breast cancer (1). It provides accurate staging information with less morbidity than the previous gold standard technique of formal surgical dissection of the draining lymph node basin (2). The sentinel lymph node is identified before surgery by a peritumoral injection of a radiotracer (such as 99mTc-antimony trisulfide or 99mTc-sulfur colloid) and lymphoscintigraphic images are obtained. During surgery, a handheld γ-probe is used to help guide the dissection. In addition, the accuracy of the procedure is improved by injection of a vital blue dye around the tumor immediately before the operation to aid visual identification of the afferent lymphatic channel and sentinel lymph node by the surgeon (3).
The radiocolloid and blue dye are administered at alternative times because these agents each have different rates of transit through the lymphatic channels. An attempt to produce a single-dose agent combining both radioactivity and blue staining ability was successful with a series of naphthol-azo dyes (4), including Evans blue (5). 99mTc-Labeled liposomes encapsulating Patent blue dye is another novel tracer with potential for this application (6). The blue dye most commonly used for mapping the lymphatic system is Patent blue (also known as Isosulfan blue), identified to have optimum lymph node coloration characteristics over Methylene blue and Cyalume after subdermal injection in a feline model (7). Evans blue was used in conjunction with Patent blue to aid in the localization of lymph nodes for sentinel node biopsy in patients with breast cancers and no palpable nodes (8). Evans blue has found extensive use as a diagnostic pharmaceutical for determination of blood and plasma volumes (9), a dye known to bind firmly with plasma albumin (10). Patent blue may be weakly bound to albumin (7), where the mechanism of binding is unclear. The aim of this study was to discern why particular dyes are taken up by the lymphatic system by investigating the relationship between the protein binding ability and molecular structure of 20 chosen dyes.
MATERIALS AND METHODS
Evans blue, Trypan blue, and Chicago sky blue cold kits were reconstituted with 99mTc-pertechnetate (99mTcO4−), and 99mTc-labeled chemical species were identified by instant thin-layer chromatography (ITLC) as outlined (4). Only 99mTc-labeled products (5–20 MBq) with >95% radiochemical purity were used. All nonradioactive dyes were purchased from Sigma-Aldrich (Milwaukee, WI). Rat blood plasma (ex heparin anticoagulant) was used undiluted and stored frozen until immediately before use. Physiologic saline (0.9%) was used as the size-exclusion chromatography (SEC) eluent. Ultraviolet (UV) spectra of dyes were obtained using a UV spectrophotometer (DU 640i; Beckman Instruments; San Diego, CA) with an absorption range of 190–750 nm. All experiments were performed in triplicate unless specified otherwise.
Standards
UV Standard Curve (Plasma).
Evans blue in saline (0.54 mg/mL; 0.20 mL) was added to rat blood plasma (0.5 mL) at room temperature, and then small aliquots (0.2 mL) were diluted in saline (0, 7, 10, and 20 mL) to give 4 standards. UV spectra were obtained and the maximum wavelength absorbance (λmax) of 610 nm was used to generate a standard curve.
UV Standard Curve (Saline).
Evans blue in saline (0.54 mg/mL; 0.20 mL) was diluted in saline (0, 7, 10, and 20 mL) at room temperature and a standard curve was generated from the UV spectra using the 4 standards.
Column Validation
Protein Fraction.
Rat plasma (0.5 mL) was diluted with saline (0.1 mL) and a small aliquot (0.2 mL) was loaded onto a size-exclusion column (Sephadex G-25M PD-10; Amersham Pharmacia Biotech AB, Uppsala, Sweden) diluted in saline (0, 7, 10, and 20 mL) to give 4 standards. Four fractions were collected in graduated (1 mL) polyethylene tubes in a sequence of 2.5, 2.0, 2.0, and 10 mL, and then each was assayed for protein content by UV absorption at λmax = 278 nm.
Molecular Weight.
Cibacron blue 3GA-dextran (0.51 mg/mL; 0.2 mL) with molecular weight 40,000 was eluted down a size-exclusion column and 4 fractions were collected in a sequence of 2.0, 0.5, 0.5, and 10 mL. Evans blue (1.07 μg/mL; 0.2 mL) with molecular weight 960 was eluted down another column and 4 fractions were collected in a sequence of 2.5, 2.0, 2.0, and 16 mL.
Dye-Protein Binding Assay
Evans blue (0.54 mg/mL; 0.20 mL) was added to rat plasma (0.5 mL) in a sealed polypropylene tube (5 mL), and the solution was incubated at 37.0°C ± 0.5°C in a temperature-regulated water bath for 10 min with swirling (90 rpm) using an OM6 Platform Mixer (Ratek Instruments, Boronia, Victoria, Australia). A small volume (0.2 mL) was eluted down the size-exclusion column using saline, and 4 fractions were collected (3 × 2.0 mL, 12–16 mL). Each fraction (0.2 mL) was diluted separately in saline (4.0 mL) and assayed for absorbance at λmax = 610 nm according to the standard curve. The percentage of dye bound to protein was calculated by dividing the mass of dye bound to protein determined in the fraction by that amount loaded onto the column, multiplied by 100.
The assay was repeated for each of the following multicolored dyes using the same volume (0.2 mL) but with specific concentrations to achieve constant mole ratios of dye to protein. These dyes are listed with the characteristic number of sulfonic acid groups [0–4] in their structure, concentration, and λmax: Methylene blue [0], 0.21 mg/mL, 665 nm; Phenol red [1], 0.30 mg/mL, 559 nm; Patent blue VF [2], 0.32 mg/mL, 639 nm; Sulforhodamine 101 [2], 0.34 mg/mL, 587 nm; Orange G [2], 0.25 mg/mL, 483 nm; Acid yellow 42 [2], 0.42 mg/mL, 409 nm; Naphthol blue black [2], 0.34 mg/mL, 628 nm; Nitrazine yellow [2], 0.30 mg/mL, 616 nm; Chrysophenine [2], 0.38 mg/mL, 396 nm; Direct yellow 27 [2], 0.36 mg/mL, 382 nm; Reactive blue 4 [2], 0.36 mg/mL, 606 nm; Indigo carmine [2], 0.26 mg/mL, 607 nm; Potassium indigotetrasulfonate [4], 0.41 mg/mL, 588 nm; 99mTc-Evans blue [4], 610 nm; 99mTc-Chicago sky blue and Chicago sky blue [4], 0.54 mg/mL, 622 nm; 99mTc-Trypan blue and Trypan blue [4], 0.54 mg/mL, 597 nm; and Direct yellow 50 [4], 0.53 mg/mL, 395 nm.
Radiochemical Analyses
99mTc-Evans blue (∼10 MBq; 0.1 mL) was added to rat plasma (0.5 mL) in a sealed tube and the solution was incubated at 37°C for 10 min with swirling (90 rpm). After this time, the mixture was analyzed by instant thin-layer paper chromatography to determine the levels of 99mTc-pertechnetate, 99mTc-Evans blue, and 99mTc-Evans blue-bound protein (11) and then subjected to the size-exclusion column as above. The 4 collected fractions and the column were each counted in a validated counting unit (Atomlab 100+ Dose Calibrator; Biodex Medical Systems, Shirley, NY) where the percentages of 99mTc-Evans blue-bound protein, 99mTc-Evans blue, and 99mTcO2 were calculated as 100 multiplied by the activity per respective fraction, divided by the total activity used. This procedure was repeated with 99mTc-Chicago sky blue and 99mTc-Trypan blue in separate experiments. The solvent used to elute 99mTc-Trypan blue (fraction 4) was 70% aqueous methanol. All values were corrected for background. Fractions 2 for all 99mTc-labeled dyes were analyzed by ITLC.
Statistical Analysis
Statistical analysis was performed with ANOVA (single factor) to obtain a correlation coefficient of the same results between 2 different measurement techniques. Paired sample t tests yielded probability values from a comparison of (a) the percentage of cold dyes (SEC; fractions 2) versus 99mTc-dyes (SEC; fractions 2) and (b) the percentage of cold dyes (SEC; fractions 2) versus 99mTc-dyes (ITLC). Statistical significance was defined as P < 0.05. Results are reported as mean ± SD.
RESULTS
Standards and Column Validation
For all dyes used in this study, plasma and saline standard curves gave the same final values of the percentage of dye bound to proteins (12). This result also confirmed that there was an insignificant extent of binding at room temperature between protein and dye over the analysis period (10 min). With the size-exclusion column, protein eluted in fraction 2 at ∼2.7 mL as a clear pale-brown solution visible by eye, which was confirmed by UV spectroscopy (100% present). The large-molecular-weight blue dextran eluted sharply at 2.5 mL, where all of the color was in the second fraction and at a similar elution volume as the proteinaceous material (2.7 mL), indicating that the molecular weight of proteins in rat plasma are slightly smaller than 40,000. The smaller Evans blue molecule was rapidly retained by the gel pores, to slowly elute blue color at ∼12–16 mL (fraction 4).
Dye-Protein Binding Assay
By SEC the percentage binding of dye to plasma proteins was determined and correlated with dye molecular structure (Table 1). Methylene blue, with no sulfonate (SO3H) groups in its structure (Fig. 1), resulted in no protein binding as evident from the pure blue color eluting in later fractions. The single sulfonate dye Phenol red resulted in a low binding affinity, as did molecules with 2 sulfonic acid groups separated by 1 atom (Patent blue, Sulforhodamine 101, and Orange G). The best protein binding (84%–100%) was achieved with the 6 dyes comprising a structural configuration of 2 sulfonic acid groups separated by 2–6 atoms (Acid yellow 42, Naphthol blue black, Nitrazine yellow, Chrysophenine, Direct yellow 27, and Reactive blue 4). The pH indicator dye Nitrazine yellow turned blue immediately on addition to plasma. Of these 6 dyes, Naphthol blue black, Nitrazine yellow, and Reactive blue 4 show the most potential for mapping the lymphatic system because they also meet the color requirements (4). Indigo carmine (8-atom spacer) resulted in low protein affinity. Of the symmetric tetrasulfonates, the smaller molecule Potassium indigotetrasulfonate gave the lowest binding (13%) in this series, and 60%–70% protein binding was achieved with Evans blue, Chicago sky blue, Trypan blue, and Direct yellow 50.
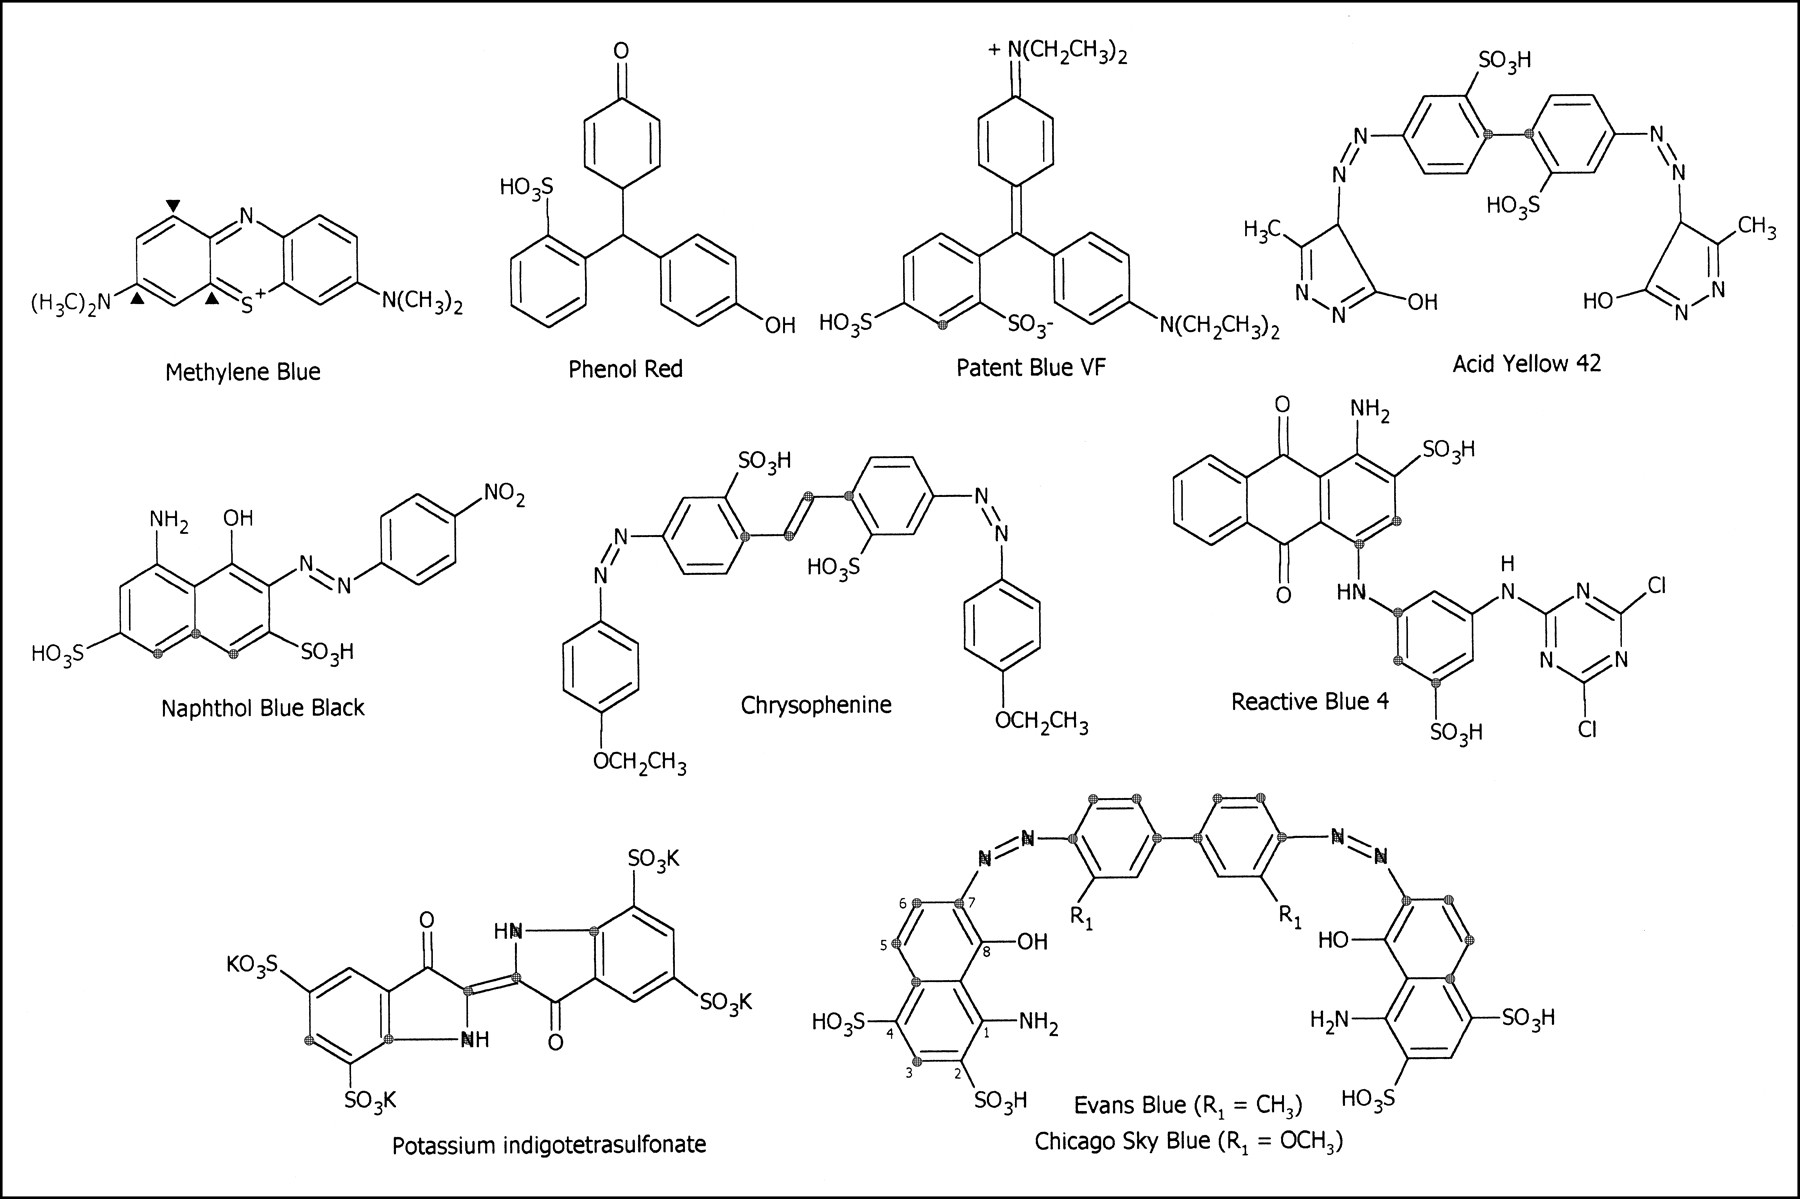
Molecular structures of 10 dyes used. Methylene blue with ▴ nucleophile reactive sites; Phenol red, monosulfonic acid dye; disulfonic acid dyes with
 atom spacers: Patent blue; Acid yellow 42; Naphthol blue black; Chrysophenine; Reactive blue 4; tetrasulfonic acid dyes: Potassium indigotetrasulfonate; Evans blue and Chicago sky blue, which both contain a 1-amino-8-hydroxynaphthalene ring system.
Binding Affinity of Sulfonic Acid Dyes with Plasma Proteins
Radiochemical Analyses
Reconstituted cold kits of Evans blue comprised 95.9% 99mTc-Evans blue, 0.7% 99mTcO4−, 3.4% 99mTcO2; Chicago sky blue, 97.8% 99mTc-Chicago sky blue, 0.1% 99mTcO4−, 2.1% 99mTcO2; and Trypan blue, 96.3% 99mTc-Trypan blue, 1.0% 99mTcO4−, 2.7% 99mTcO2. Results of the radiochemical analyses of dye-plasma mixtures before and after SEC are shown in Table 2. 99mTc-Evans blue and 99mTc-Chicago sky blue had the highest affinity for plasma proteins (∼70%) over the other 99mTc-naphthol-azo dyes by this technique. The first fractions collected from the column contained no radioactivity (0.0% ± 0.0%) for all 3 99mTc-dyes used. The percentages of 99mTc-dye-protein determined by ITLC of the dye-plasma incubation mixtures were slightly higher than the corresponding values obtained by SEC (fractions 2), although they were not statistically significant (Evans blue, P = 0.074; Chicago sky blue, P = 0.088; Trypan blue, P = 0.093), indicating that both assays were equally effective (ANOVA; r = 0.951). For all 99mTc-dyes, pure samples of 99mTc-dye-protein complex (>95%) in fraction 2 comprised the highest radioactivity as well as a strong blue coloration. Fraction 3 obtained from the column contained a mixture of low levels of 99mTc-dye-protein and 99mTc-dye. After completing the final saline elution, the remaining column activity was attributed to 99mTcO2, an amount that did not differ from that in the 99mTc kit for all dyes. 99mTcO2 is known to adsorb strongly to ITLC paper as well as to column matrices, which are anion-exchange (13) or octadecyl-carbon based (14). The percentages of 99mTc-dye-protein (ITLC) in Table 2 also agree with the percentages of dye-protein in Table 1 for Evans blue (P = 0.341), Chicago sky blue (P = 0.165), and Trypan blue (P = 0.225).
Before and After SEC Radiochemical Analyses of Percentage of Components
DISCUSSION
Lymphatic mapping in the sentinel node biopsy procedure requires that the blue dye be injected immediately before surgery because the staining agent rapidly transits lymphatic channels. Certain dyes have succeeded for this application, whereas other blue dyes have failed (7). The lymphatic migration of Evans blue (11) and Patent blue (15) has been investigated and, although these sulfonic acid-bearing molecules are known to bind with albumin, the reaction mechanism has never been clarified. This study has identified a molecular link among 20 dyes with the extent of protein binding, measured by an assay using rat blood plasma as the fluid representing lymph. Although the concentration of protein in lymph varies according to location in the body, lymph is generally known to have a lower concentration of proteins than plasma, containing a higher level of those with lower molecular weight (16).
The optimum protein binding criteria of these molecules requires the dye to possess at least 1 sulfonic acid group; if 2 of these are present, they ought to be separated by 2–6 atoms within the intramolecular framework. Successful dyes were Acid yellow 42, Naphthol blue black, Nitrazine yellow, Chrysophenine, Direct yellow 27, and the nonazo dye, Reactive blue 4, all yielding high and rapid binding with proteins in the short incubation period. Methylene blue, having no sulfonic acid groups in this structure, clearly was not bound to plasma proteins, consistent with the literature that this dye is not taken up by lymph (7), and that follows the expected course of inert soluble compounds by diffusing directly into blood capillaries after subdermal injection (Fig. 2). The monosulfonate compound Phenol red gave low (<20%) uptake, as did the disulfonates containing a 1-atom spacer, such as Patent blue, Sulforhodamine 101, and Orange G. An 8-atom separation of sulfonic acid groups in Indigo carmine was sufficient to result in a substantially decreased protein binding of 28%.
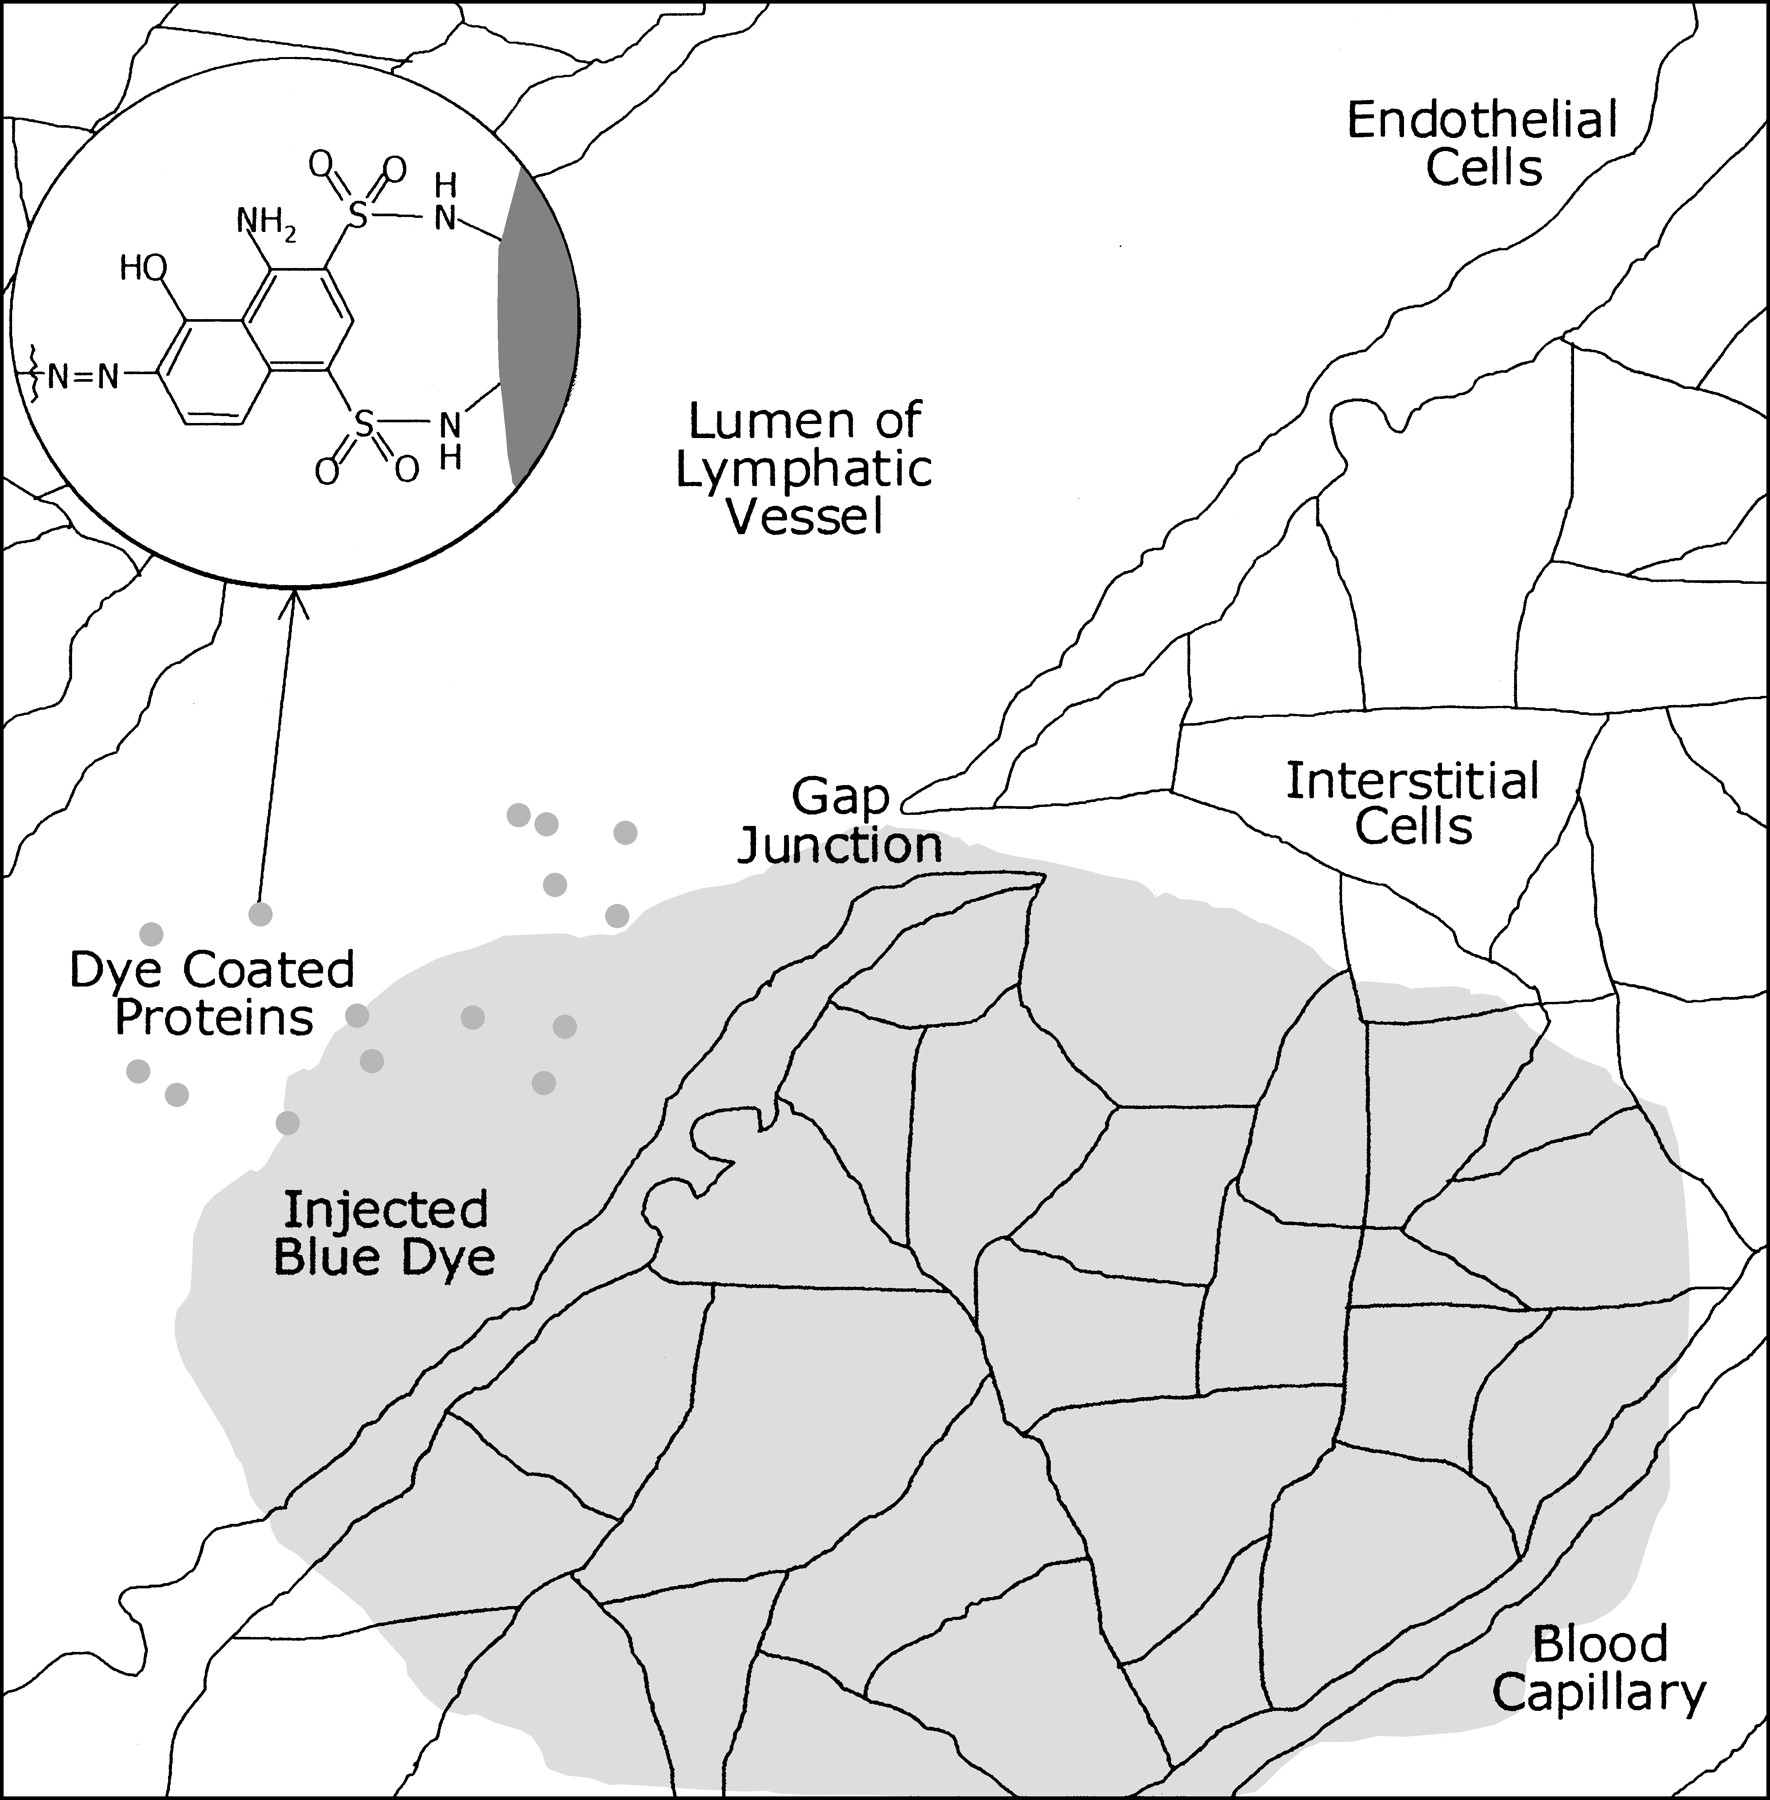
After subdermal injection of soluble blue dye such as Evans blue, there is diffusion from interstitial cells to lymphatic vessels as well as blood capillaries. Dye binds to surface of endogenous proteins by sulfonation reaction, remaining trapped inside lymphatic lumen and transported along with lymphatic flow. Dyes such as Methylene blue, which do not have sulfonic acid groups in their structure, do not bind to endogenous lymph proteins and continue migration into blood capillaries.
The low protein binding affinity of Patent blue, in conjunction with its slow rate of renal excretion (10% unchanged over 20 h (15)), explains why patients’ urine is blue to green colored 18 h after surgery (17). Of the Patent blue dose (1–2 mL of 2.5 mg/mL (18)) administered to patients, it is estimated that approximately 5% of dye diffused from the injection site is retained by the lymphatics, whereas the remainder enters the bloodstream. On the basis of its extensive clinical use, a low level of Patent blue is obviously suitable for visualization of afferent lymphatic channels and sentinel nodes.
The best agents in the tetrasulfonic acid group were Evans blue and Chicago sky blue, yielding 70% protein binding affinities, lower than the disulfonates separated by 2–6 atoms but considerably higher than Patent blue (5%). This suggests that a lower dose (>13 times) of Evans blue could be used for the sentinel node biopsy technique because of the higher extraction of this dye by endogenous lymph proteins. Furthermore, Evans blue has a higher staining content over Patent blue (85% vs. 50%, respectively), potentially requiring 59% less Evans blue per dose to achieve the same visual identification as Patent blue. Metabolism of this particular dye in the liver also has the advantage of avoiding coloration of urine (11).
In an attempt to rationalize the protein-dye interaction at the molecular level, a selection of aromatic functional groups common to the dye series used was considered: azo, α-amino-γ-hydroxy, and sulfonic acid. It has been reported that azo compounds such as alkyl phenyldiazenecarboxylates can reduce glutathione sulfhydryl groups to the disulfide form through cyclic or nitrogen-sulfur bonded intermediates in a nucleophilic addition mechanism (19). Although Methylene blue has no sulfonic acid groups, it does present nucleophilic addition sites as conjugated to dimethyl ammonium groups or cationic sulfur (Fig. 1). No protein binding resulted with this molecule at 37°C, suggesting that the reaction mechanism does not involve protein sulfhydryl groups. This is further exemplified with the nonazo dye Reactive blue 4, which contains no sulfhydryl reactive groups and yet yielded quantitative binding. The azo functional group is not implicated in the dye-protein reaction.
The 1-amino-8-hydroxynaphthalene groups chelate with reduced 99mTc in ligands such as Naphthol blue black, Evans blue, Chicago sky blue, and Trypan blue (4,5). The affinities of 99mTc-Evans blue (70%), 99mTc-Chicago sky blue (69%), and 99mTc-Trypan blue (62%) for plasma proteins were not significantly different (P > 0.05) from that of their corresponding nonradioactive dyes (68%, 71%, and 61%, respectively). Also, 99mTc-pertechnetate or 99mTcO2 levels were essentially unchanged before and after plasma incubation at 37°C for all 99mTc-dyes, suggesting that 99mTc-coordinate bonds have remained intact during the protein binding reaction and that other functional groups are responsible.
The most likely chemical reaction of these dyes occurs between sulfonic acid groups and exposed nucleophilic groups at the protein surface, such as the amino groups of lysines or arginines, or possibly even hydroxy groups from other amino acids. Akin to the organic chemistry reaction, sulfonation requires the loss of water from the sulfonic acid group in the dye to form a sulfonamide or sulfonate ester linkage with protein (Fig. 3).
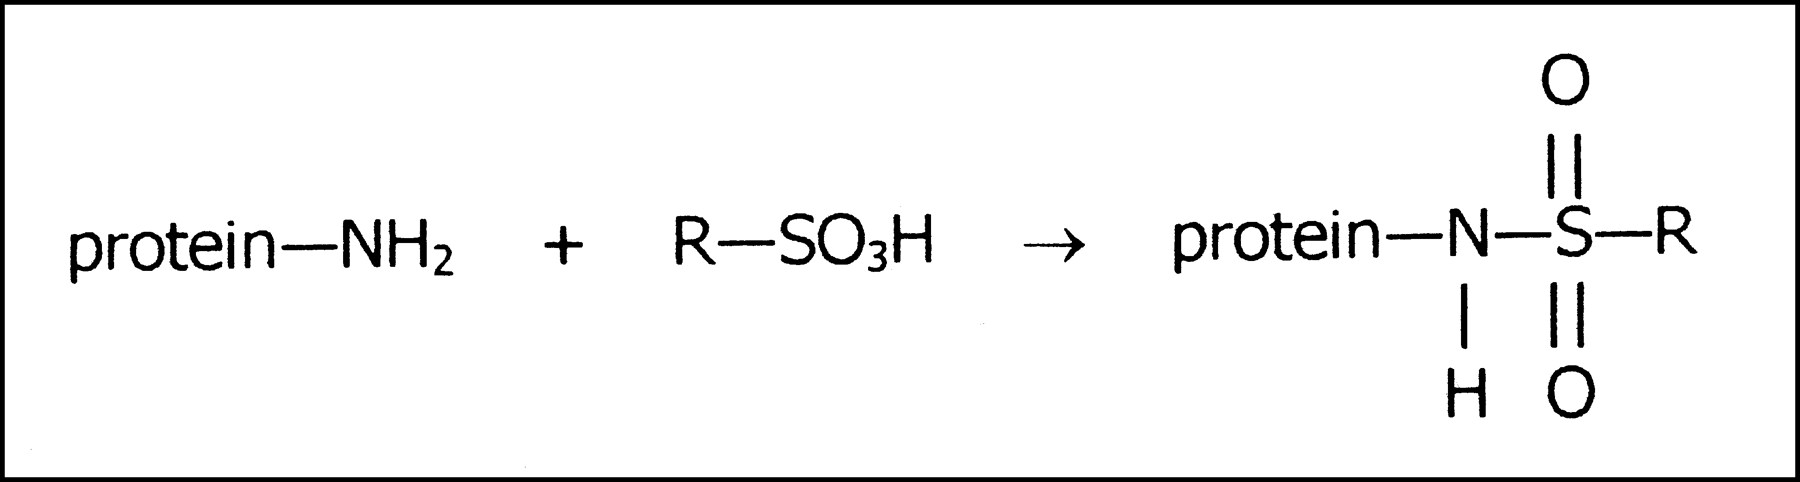
Dye—protein complex formed by chemical reaction of amino group on protein surface with sulfonic acid group of dye (R).
It is this key interaction between the sulfonate groups of Congo red and arginine or lysine residues in the β-pleated protein sheets of amyloid plaques that makes this dye a gold standard technique in the histopathology of amyloidosis tissue samples (20). Likewise, the sulfonic acid groups in Evans blue that are located away from the metal chelating site of 99mTc-Evans blue are the common protein binding site that explains why these different molecules migrate simultaneously in rabbit lymph (11).
The symmetric tetrasulfonate dyes all resulted in lower binding affinities for protein and a less apparent trend in comparison with the disulfonic acid series. In particular, the smaller, rigid molecule Potassium indigotetrasulfonate resulted in a lower yield (13%) compared with the longer, more flexible azo dyes. This finding may be attributed to the specific 3-dimensional conformations adopted by the azo dye molecules, where a successful sulfonation reaction with groups on the protein surface depends on their proximity and structural orientation. Theoretically derived molecular orbital calculations have found Evans blue to be essentially planar except for torsion at the 4,4′-biphenyl bond, and Trypan blue has additional nonplanarity at both diazo bonds because of steric interaction of the sulfonic acid groups (21). Furthermore, these and other tetrasulfonate dyes have been reported to form ribbon-like (22) supramolecular structures with altered chemical reactivity relative to their monomers (23). A combination of these properties most likely distinguishes the protein binding affinity of Potassium indigotetrasulfonate from that of Direct yellow 50, Trypan blue, Chicago sky blue, and Evans blue.
CONCLUSION
This study has investigated the binding reaction of plasma proteins with a series of 20 sulfonic acid dyes using chromatographic and UV spectrophotometric techniques. Those dyes containing 1 or no sulfonic acid group resulted in little or no protein affinity, respectively. The dyes containing 2 sulfonic acid groups separated by 1 atom such as Patent blue, or 8 atoms such as Indigo carmine, gave low (<30%) protein binding. A prerequisite is evident to achieve the best binding at 37°C, requiring dyes possessing 2 sulfonate groups in their structure to be 2–6 atoms apart. A less apparent structure-activity relationship was observed for a series of symmetric tetrasulfonic acid dyes. The similar structures of Evans blue and Chicago sky blue resulted in the highest protein affinities of this group, and it appears that a 3-dimensional structural conformation in the physiologic environment is important. At the molecular level, a sulfonation reaction occurs between disulfonic acid groups and amino acid nucleophilic groups at multiple sites over the protein surface. Thus, proteins are coated with these colored molecules in an opsonization-like process. The binding reaction by sulfonation of endogenous proteins explains why soluble blue dyes such as Evans blue and Patent blue are trapped within lymphatic capillaries after subdermal injection during the sentinel node biopsy procedure.
Acknowledgments
The authors thank Eric Smith (Department of Surgery, Adelaide University, Adelaide, South Australia, Australia) for supplying the rat blood plasma.
Footnotes
Received Feb. 1, 2001; revision accepted May 21, 2002.
For correspondence or reprints contact: Chris Tsopelas, PhD, Royal Adelaide Hospital, Nuclear Medicine Department, RAH Radiopharmacy, North Terrace, Adelaide SA 5000, South Australia, Australia.
E-mail: ctsopela{at}mail.rah.sa.gov.au
REFERENCES
In this issue


Jump to section
Related Articles
Cited By...
- Design of a Fibroblast Activation Protein-Targeted Radiopharmaceutical Therapy with High Tumor-to-Healthy-Tissue Ratios
- A Lymph Node Targeted Amphiphile Vaccine Induces Potent Cellular and Humoral Immunity to SARS-CoV-2
- Validating a semi-quantitative method to assess the degree of methylene blue staining in sentinel lymph nodes
- Enhancement of Peptide Vaccine Immunogenicity by Increasing Lymphatic Drainage and Boosting Serum Stability
- A Case of Severe Anaphylactic Reaction Secondary to Isosulfan Blue Dye Injection
- In vivo albumin labeling and lymphatic imaging
- Tumor cell entry into the lymph node is controlled by CCL1 chemokine expressed by lymph node lymphatic sinuses
- Methylene Blue Dye, an Accurate Dye for Sentinel Lymph Node Identification in Early Breast Cancer
- Formation of Sulfonamide Bonds Through Reaction of Dyes with Serum Proteins