


Abstract
Myocardial perfusion imaging with 99mTc-labeled agents immediately after reperfusion therapy can underestimate myocardial salvage. It is also conceivable that delayed imaging is useful for assessing the risk area. However, to our knowledge, very few studies have sequentially evaluated these image changes. We conducted 99mTc-tetrofosmin (TF) and 123I-β-methyl-p-iodophenylpentadecanoic acid (BMIPP) SPECT before and after reperfusion to treat acute myocardial infarction and quantified changes in TF myocardial accumulation and reverse redistribution. Methods: Seventeen patients with a first myocardial infarction underwent successful reperfusion. We examined SPECT images obtained at the onset (preimage), those acquired 30 min (early image) and 6 h (delayed image) after TF injection, and images acquired 1, 4, 7, and 20 d after reperfusion (post–1-d, post–4-d, post–7-d, and post–20-d image, respectively). We also examined BMIPP SPECT images after 7 ± 1.8 d (BMIPP image). Polar maps were divided into 48 segments to calculate percentage uptake, and time course changes in segment numbers below 60% were observed as abnormal area. Moreover, cardiac function was analyzed by gated TF SPECT on 1 and 20 d after reperfusion. Results: In reference to the abnormal area on the early images, the post–1-d image was significantly improved compared with the preimage (P < 0.01) as was the post–7-d image compared with the post–1-d and post–4-d images (P < 0.05, respectively). However, post–20-d and post–7-d images did not significantly differ. Therefore, the improvement in myocardial accumulation reached a plateau 7 d after reperfusion. On the other hand, the abnormal area on the delayed images was significantly greater (P < 0.01) compared with that on the early images from 4 to 20 d after reperfusion, as the value was essentially constant. The correlations of the abnormal area between the preimage and the post–7-d delayed image, the preimage and the BMIPP image, and the post–7-d delayed image and the BMIPP image were very close (r = 0.963, r = 0.981, and r = 0.975, respectively). Gated TF SPECT revealed that the left ventricular ejection fraction was not significantly different (P = not significant) between 1 and 20 d after reperfusion, but regional wall motion was significantly different after reperfusion (P < 0.05). Conclusion: These results suggest that the interval between reperfusion therapy and TF SPECT should be 7 d to evaluate the salvage effect and that TF delayed and BMIPP images are both useful in estimation of risk area.
- acute myocardial infarction
- 99mTc-tetrofosmin
- 123I-BMIPP
- reperfusion
- percutaneous transluminal coronary angioplasty
One agent that was originally developed for scintigraphy of myocardial blood flow is 99mTc-tetrofosmin (TF). Like 99mTc-sestamibi, TF is rapidly distributed in the myocardium after myocardial perfusion and then is taken up and retained by myocardial cells. Together, the distribution and retention of TF represent myocardial perfusion (1,2).
To evaluate risk areas, we often inject a patient who had an acute myocardial infarction (AMI) with TF before reperfusion and then acquire SPECT images (3–5). Although myocardial blood flow in the risk area of a patient with AMI recovers gradually after reperfusion, the process has not been clarified and assessment criteria for therapeutic effects have not been established.
Moreover, reverse redistribution has been observed on delayed images at sites exposed to ischemia by SPECT using 99mTc-myocardial blood flow tracers after reperfusion in patients with AMI. Such images resemble risk areas of the myocardium and may be useful in assessing the myocardial salvage effect (6,7). However, the extent to which such reverse redistribution resembles actual risk areas and how long such tendencies continue after reperfusion therapy remain unknown.
On the other hand, 123I-β-methyl-p-iodophenylpentadecanoic acid (BMIPP) reflects fatty acid metabolism in the myocardium. This information is also useful for evaluating risk areas and for estimating the recovery of cardiac function in the chronic stage on the basis of mismatches compared with myocardial perfusion images (8–11).
We obtained early and delayed TF images (before and 1–20 d after reperfusion therapy) from patients with AMI who underwent direct percutaneous transluminal coronary angioplasty (PTCA) and stent implantation. We also obtained BMIPP images 7 ± 1.8 d after the onset of AMI. We then examined the time course of the recovery of TF myocardial accumulation and the clinical usefulness of TF reverse redistribution.
MATERIALS AND METHODS
Subjects
The duration of the study was 1 y. During this period, 19 patients were brought to our hospital with an emergency AMI. Two of these patients suffered cardiogenic shock during PTCA and were excluded from the study. Therefore, 17 patients (5 women, 12 men; mean age, 66.7 ± 9.3 y; peak creatine phosphokinase activity, 2,602 ± 1,456 IU/L) were studied. All 17 patients were seen at the first onset of AMI. The infarcts were located in the left anterior descending branch of the coronary artery (n = 3), the left circumflex branch (n = 2), and the right coronary artery (n = 12).
Our study was conducted in compliance with institutional review board recommendations. Informed consent was obtained from all patients before the study. No subjects refused to participate in our study.
Study Protocol
Patients who were hospitalized within 24 h after the onset of AMI and whose subjective symptoms, electrocardiograms, and echocardiograms were abnormal underwent direct PTCA followed by insertion of a stent. The freeze method was used, whereby the image can be obtained before reperfusion therapy by administering 99mTc-labeled myocardial perfusion agent and performing SPECT after reperfusion therapy (3–5)—that is, the patients were injected with 740 MBq TF; on confirmation of the affected blood vessel by emergent coronary angiography (CAG), direct PTCA was performed, followed by SPECT (preimage). The process from TF injection to SPECT imaging by the freeze method was completed within 2 h. The average time required was 49.46 ± 19.33 min (range, 28–90 min). Moreover, on 1, 4, 7, and 20 d after PTCA, 740 MBq TF were injected at rest, and images were obtained 30 min (post–early image) and 6 h (post–delayed image) later. Patients also were injected with 148 MBq BMIPP at rest on 7 ± 1.8 d and SPECT images were collected 30 min later (BMIPP image). Electrocardiographically gated SPECT with TF was performed on 14 patients 1 and 20 d after PTCA (Fig. 1).
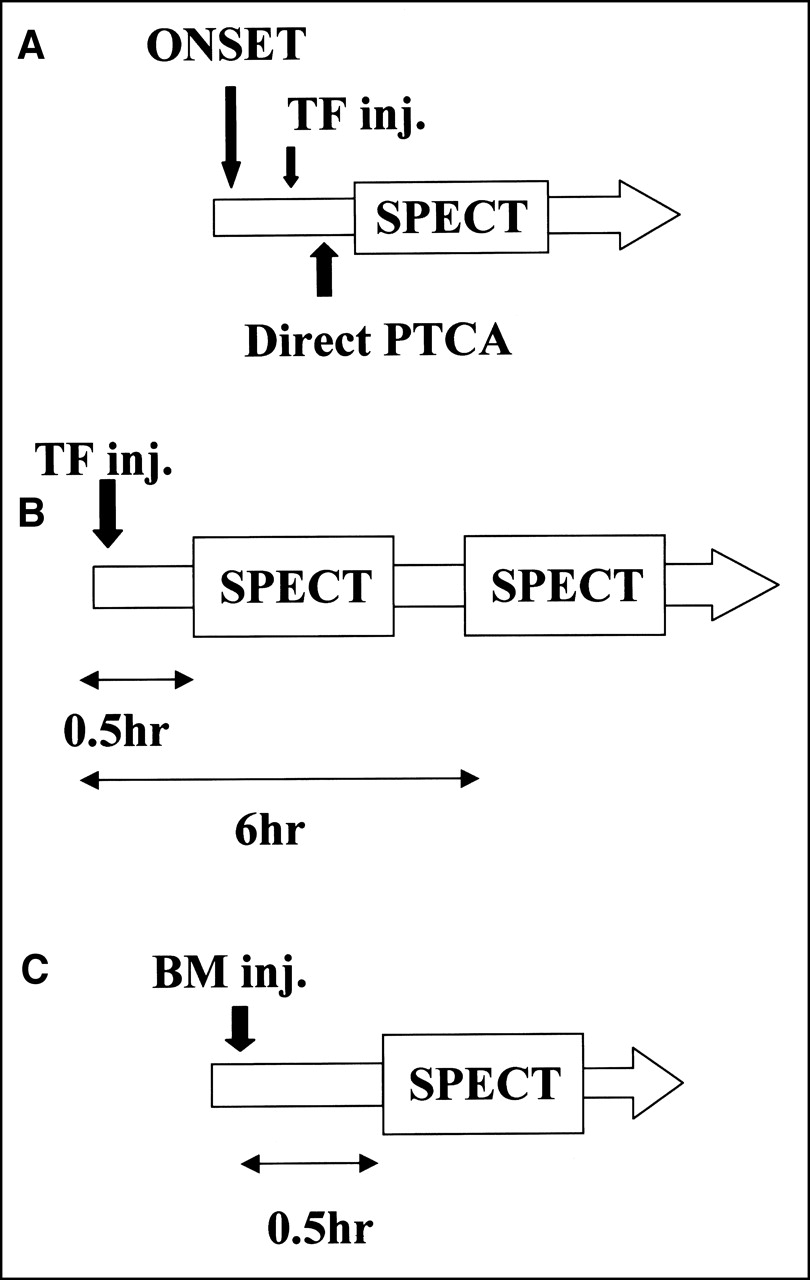
Schematic diagram of study protocol. (A) Pre-PTCA image (freeze image). (B) Post-PTCA image (1, 4, 7, and 20 d). (C) Post-PTCA (7 ± 1.8 d). BM = BMIPP; inj. = injection.
Data Acquisition
SPECT imaging data were acquired using a rotating digital gamma camera (7200DI; Toshiba, Tokyo, Japan). The TF images were obtained using a low-energy, high-resolution collimator with an energy window of 141 keV ± 10% and a 64 × 64 matrix. SPECT images were collected over 360°, at 4° every 8 s, and gated SPECT images were collected over 360° at 6° every 15 s. The R–R interval was divided into 8 flames. The BMIPP images were obtained using a low-energy, general-purpose collimator at 160 keV ± 10% and a matrix size of 64 × 64. Images were collected over 360°, at 6° every 13 s. Body axis section images were reconstituted by corrective reverse projection using a Hanning filter for pretreatment and Hanning and ramp filters at reverse projection. Scattering and absorption were not corrected.
Determination Parameters and Evaluation Methods
The polar map was divided into 16 sections toward the circumference and in 3 layers in the long axis from the apex to basal area to obtain a total of 48 areas. Regions with maximal counts were regarded as 100%, and the percentage uptake of each area was determined (Fig. 2). Abnormal area was defined as <60% uptake area on the basis of preceding reports (12,13). The number of abnormal areas (NAA) was calculated, and their time courses were evaluated. Cardiac function was determined by electrocardiographically gated TF SPECT using the QGS program (14), which calculated the left ventricular ejection fraction (LVEF [%]) and regional wall motion (mm).

Division of left ventricular myocardium into 48 segments. Percentage uptake was calculated in each segment, and that below 60% was defined as abnormal.
Statistical Analysis
All data are expressed as mean ± SD, and changes in NAA over time were compared using Wilcoxon’s rank sum test. Spearman’s correlation coefficient was applied and P < 0.05 was regarded as significant.
RESULTS
Time Course of TF Myocardial Accumulation
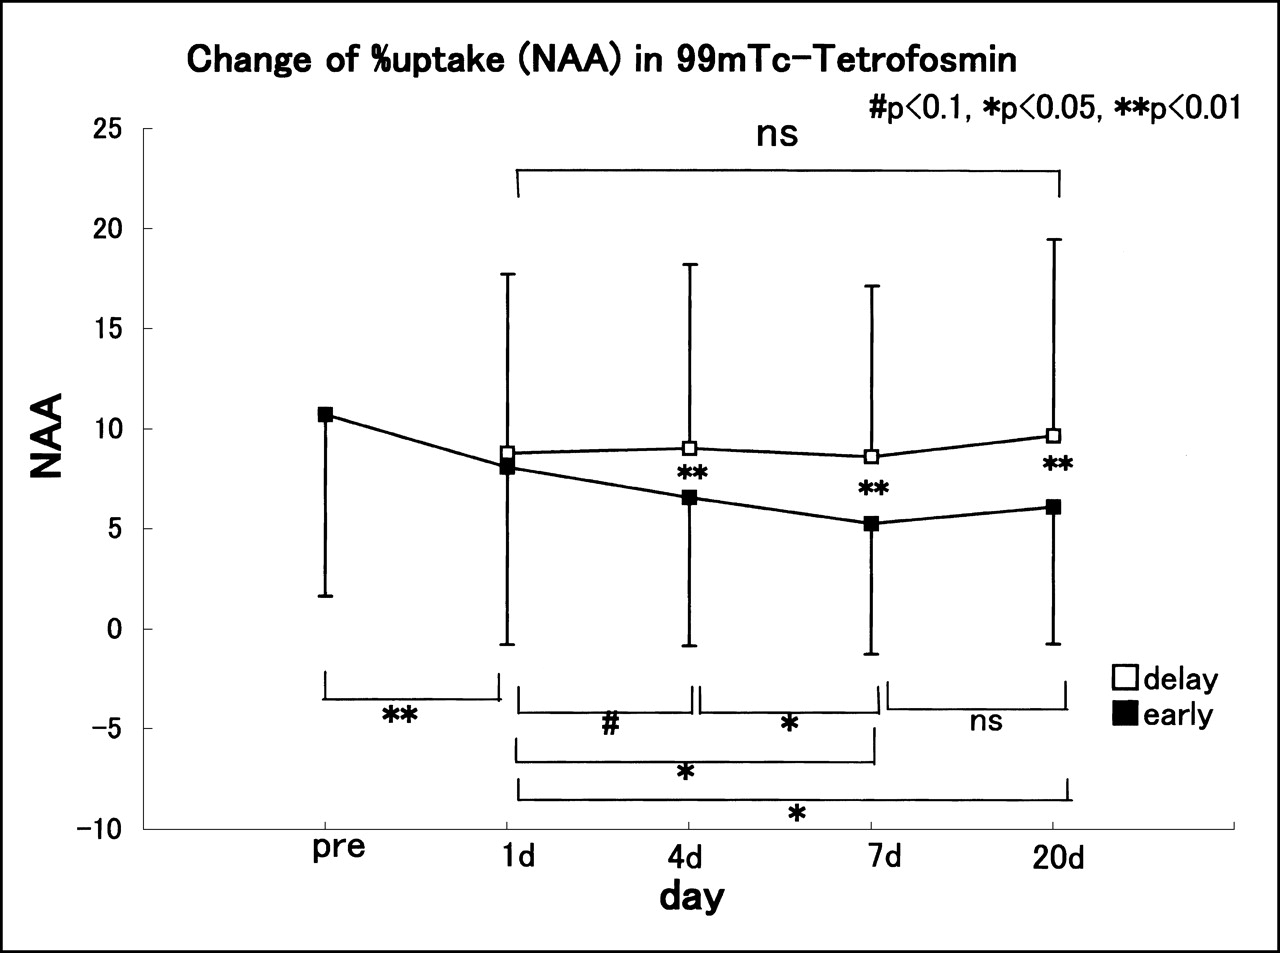
The time course of TF myocardial accumulation is shown in Figure 3. The time course of NAA on the early images varied as follows: preimage, 10.7 ± 9.1; post–1-d early image, 8.1 ± 8.8; post–4-d early image, 6.5 ± 7.4; post–7-d early image, 5.2 ± 6.5; and post–20-d early image, 6.0 ± 9.6. These findings indicated an improvement in myocardial accumulation over time. The difference between the preimage and post–1-d early image was particularly significant (P < 0.01), and the differences between the post–1-d and post–7-d early images and between the post–4-d and post–7-d images were also notable (P < 0.05). However, the post–7-d and post–20-d early images did not differ significantly.

Change in NAA on 99mTc-tetrofosmin SPECT early and delayed images. Data are expressed as mean ± SD. ns = not significant.
On the other hand, the time course values of NAA on the post–1 d, post–4-d, post–7-d, and post–20-d delayed images were 8.8 ± 8.9, 9.0 ± 9.2, 8.6 ± 8.5, 9.6 ± 9.8, respectively. The findings indicated that these values did not change significantly throughout the observation period.
A comparison of NAA between the early and delayed images revealed no obvious difference between the post–1-d early and post–1-d delayed images. However, differences were significant on the post–4-d, post–7-d, and post–20-d images between the early and delayed images (P < 0.01).
Comparison with Risk Area Obtained from Preimage
Comparative results of NAA in the preimage, post–7d-delayed image, and BMIPP image are shown in Figure 4. In comparison with the preimage, NAA values in the post–7-d delayed and BMIPP images were significantly smaller (P < 0.01 and P < 0.001, respectively), but the post–7-d delayed and BMIPP images did not differ significantly.

Comparison of NAA among preimage (Pre) and post–7-d delayed and BMIPP (BM) images. Data are expressed as mean ± SD. ns = not significant.
Correlations between the above 3 parameters are shown in Figure 5. The calculated respective regression equations and correlation coefficients were y = 0.965x + 2.758 (r = 0.963; P < 0.001) between the pre– and post–7-d delayed images, y = 0.989x + 2.852 (r = 0.981; P < 0.001) between the pre- and BMIPP images, and y = 0.982x + 0.439 (r = 0.975; P < 0.001) between the post–7-d delayed and BMIPP images.
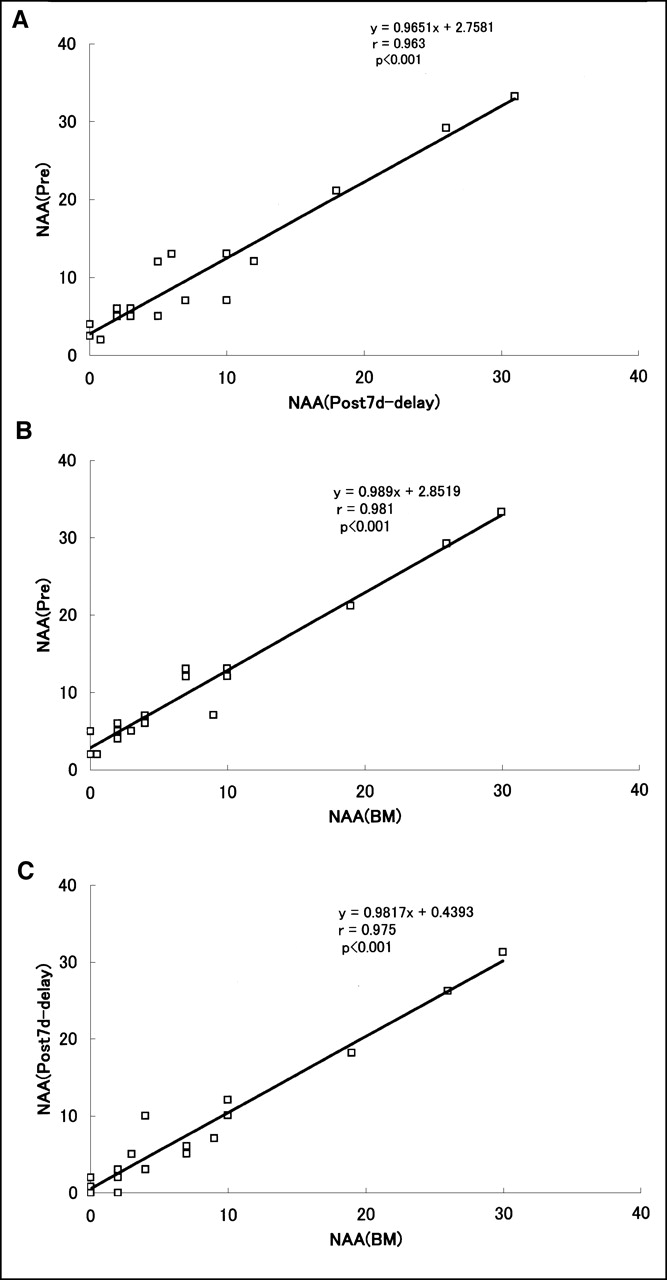
Correlations of NAA between preimage (Pre) and post–7-d delayed image (A), preimage and BMIPP (BM) image (B), and post–7-d delayed image and BMIPP image (C).
Changes in Cardiac Function and Wall Motion
LVEF was not significantly different between 1 and 20 d after reperfusion. However, regional wall motion in the risk area had improved significantly (P < 0.05) (Fig. 6).
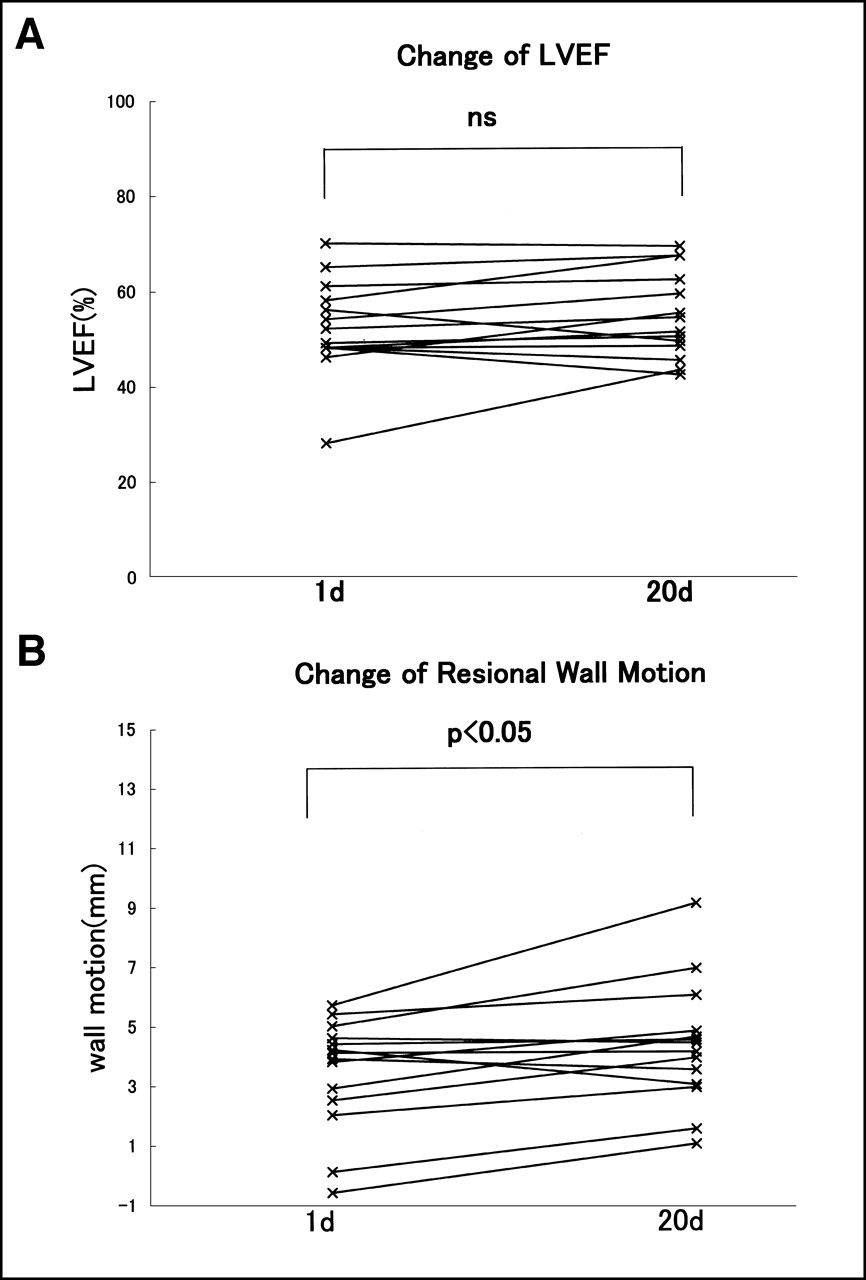
Comparison of cardiac functions between post–1-d and post–20 d images. (A) LVEF. (B) Regional wall motion. ns = not significant.
Case Report
A 64-y-old man (Fig. 7) was admitted to the emergency department because of chest pain. Electrocardiography showed a slightly elevated S–T and echocardiography showed abnormal contraction of the anterior wall, septum, and apex, indicating peak creatine phosphokinase activity of 584 IU/L. These findings indicated a diagnosis of AMI, and emergency CAG was performed. CAG showed 99% stenosis in the left anterior descending artery, so direct PTCA was performed and the patient received a stent, which improved the stenosis rate to 0%. One week later, CAG confirmed the absence of restenosis in the site implanted with the stent. TF SPECT images indicated decreased accumulation or defects in the anterior wall and septal and apical regions on the preimage. The calculated NAA value was 21. After PTCA, NAA was improved to 11 on day 1 and further improved to 0 after day 4. The recovery of accumulation was obvious visually, so the salvage effects were favorable.
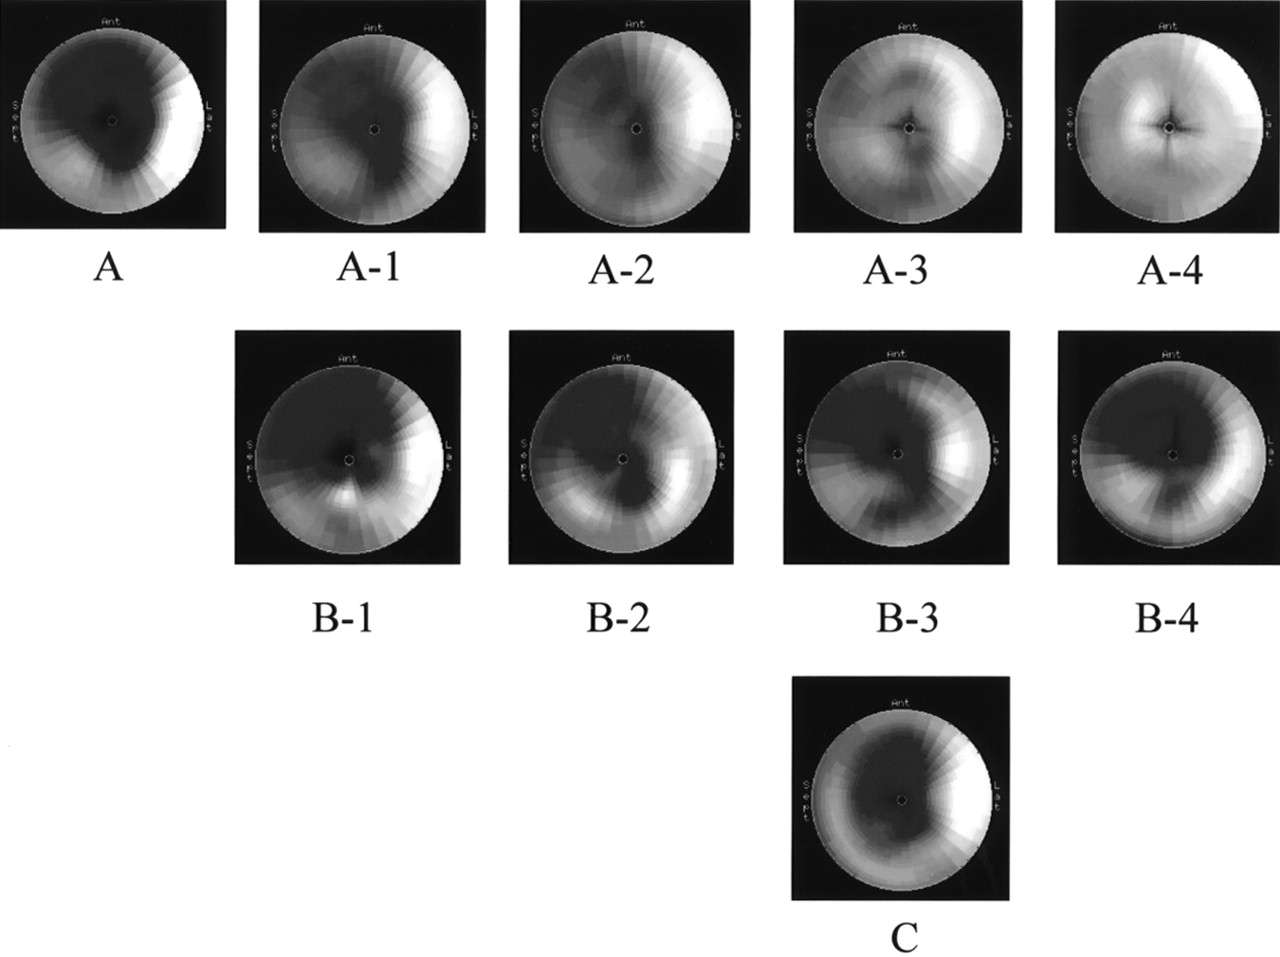
Serial SPECT images of 64-y-old man with acute myocardial infarction. (A) A indicates pre-PTCA. A-1, A-2, A-3, and A-4 are TF early images (each number indicates 1, 4, 7, and 20 d after reperfusion, respectively). (B) B-1, B-2, B-3, and B-4 are TF delayed images (each number indicates 1, 4, 7, and 20 d after reperfusion, respectively). (C) BM image obtained an average of 7 d later. Left anterior descending artery was observed to have 99% stenosis on day 7, which improved to 0% after reperfusion therapy; no stenosis was observed with CAG 1 wk later. Early SPECT images showed that myocardial perfusion of preimage-defective site improved over time, with good salvage effect obtained as indicated by SPECT image obtained 7 d later (A). Delayed images showed no serial changes and, like BMIPP images, were similar to preimages.
The delayed SPECT images after reperfusion revealed reverse redistribution from day 1 to day 20, but the time course changed little, and these images showed the ranges of abnormal accumulation on the preimage even though this might have been underestimated. Also, the BMIPP image (NAA, 19) obtained on day 7 resembled the post–7-d delayed image (NAA, 18) and the preimage (NAA, 21).
DISCUSSION
Direct PTCA has been used for about 20 y to treat coronary arterial diseases. The method has become a standard treatment strategy because it is less invasive than earlier procedures, it can be completed quickly, and it is effective. The restenosis rate has decreased since the advent of improved devices such as the stent. Such reperfusion techniques are aimed at recovering the pumping function of the heart, preventing myocardial necrosis, and the therapeutic effects may be enhanced by reperfusion as soon as possible after the onset of AMI. However, the period up to reperfusion and the subsequent recovery of cardiac function are not necessarily correlated (15), and reperfusion may inhibit left ventricular remodeling in addition to the recovery of cardiac function if it is performed within 24 h after the onset (16). Therefore, the assessment period and assessment methods for identifying therapeutic effects should be examined.
Therefore, this study estimated risk areas by TF SPECT before reperfusion in patients with AMI who underwent PTCA and indwelling stent procedures within 24 h after onset. We also performed subsequent serial TF SPECT to clarify the time course of improved myocardial perfusion and function after reperfusion.
Myocardial cells take up TF in proportion to blood flow, and TF is retained in cells with little washout. Thus, TF can be injected into patients before PTCA (stent implantation) to evaluate risk areas by obtaining SPECT images after reperfusion. Although salvaged areas of the myocardium can be determined from differences between risk and defective areas at the subacute stage after reperfusion, the size of the salvaged area in the myocardial perfusion image may differ depending on the test periods after reperfusion (17). To accurately evaluate the effect of the reperfusion therapy, it is essential to determine the appropriate therapy–SPECT imaging interval. However, follow-up of the recovery process of myocardial perfusion of patients with an identical condition in the subacute stage is rare. In this study, myocardial perfusion in the early image improved over time but reached a plateau by 7 d. Therefore, the salvage effect of reperfusion might be underestimated in images obtained 1–4 d after reperfusion, and the necessity of evaluating after 7 d was considered. However, Manyari et al. (18) reported improvement in myocardial perfusion on day 9 after reperfusion in a test using 201Tl and further improvement during the chronic period (3 mo later). In fact, a test at 3 mo has become established as a goal of coronary artery reperfusion using 201Tl myocardial scintigraphy (19). A test also seems desirable during the chronic stage using TF in addition to SPECT imaging for 7 d after reperfusion. All of our patients received a stent and, although restenosis was absent, abnormal accumulation continued to be present on myocardial scintigrams, indicating false-positive findings. Microangiopathy (no-reflow phenomenon) seems to be involved in this phenomenon (20,21) and this matter requires further investigation.
A high rate (75%) of reverse redistribution in 201Tl delayed images of myocardial scintigraphy at rest on 10 d after reperfusion for AMI was originally reported by Weiss et al. (22) in 1979. On the other hand, few reports describe reverse redistribution associated with TF, and its time course has not been examined. This study found that reverse redistribution was caused at the sites of infarction in all AMI patients after direct PTCA. No changes were significant for up to 20 d after onset, and we determined that continued washout was enhanced.
Takeishi et al. (23) observed reverse redistribution after 3 h in 68% of patients in whom reperfusion using 99mTc-sestamibi was successful. We examined delayed images using 99mTc-sestamibi in patients after reperfusion for AMI and found reverse redistribution in all of them. We also compared the 4- and 6-h images and found that the abnormal areas in the latter were significantly greater than those in the former (6). According to Platts et al. (24), the accumulation of TF does not decrease because of a positive ion channel inhibitor, but accumulation in the myocardial cells was decreased by inhibition of phosphorylation coupling with the electron transfer system associated with the addition of 2,4-dinitrophenol and by depolarization of the mitochondrial membrane potential caused by the addition of Ca2+. These results indicate that TF accumulation is not involved in transfer by a positive ion channel but, rather, the metabolic condition of the myocardial cells performs the essential role (25). This abnormality of the membrane potential of the mitochondria seems to contribute to a decrease in the capacity to retain TF, and reverse redistribution seems to continue for as long as the mitochondrial membrane potential abnormality persists. This study found reverse distribution from day 1 to day 20, the range and degree being almost equivalent. We considered that the mitochondrial abnormality persisted. The abnormal area on this delayed image closely correlated with the risk area assessed from the preimage, even when slightly underestimated. Moreover, the abnormal area underwent hardly any change over 20 d. Therefore, the delayed image is considered useful in estimation of the risk area.
On the other hand, myocardial uptake of BMIPP, a fatty acid analog, decreases under ischemic conditions because mitochondrial β-oxidation is inhibited (26–32). Ogata (33) administered adriamycin (which causes specific disturbances of the mitochondria) to rats and then examined the relationship between the functional disturbance of the mitochondria and the myocardial uptake of BMIPP. The myocardial accumulation of BMIPP was surmised to reflect disturbances in mitochondrial and cell membrane functions during ischemia and myocardial diseases. Kawai et al. (34) used TF and BMIPP in 65 patients with AMI before reperfusion and 7 d later. They found that the detectability of risk area using BMIPP on 7 d was equivalent to that of TF before reperfusion and that the metabolic disturbance persisted from BMIPP uptake for at least 7 d despite the recovery of myocardial perfusion. We compared BMIPP images at an average of 7 d with the TF preimage and post–7-d delayed image and found similar tendencies among them. The BMIPP and the TF post–7-d delayed images, in particular, coincided well. The accumulation decrease and the defect on both images appeared to be closely related to the functional decrease in the mitochondria; however, this requires further investigation. In addition, the relationship between myocardial dysfunction and the capacity of the mitochondria to retain TF also merits further study.
TF can be readily applied to electrocardiographically gated SPECT using the QGS program (14,35). We evaluated the LVEF and regional wall motion on 1 and 20 d. The LVEF did not change significantly, but regional wall motion improved significantly. One report (36) states that regional wall motion after reperfusion in patients with AMI improves later than does myocardial perfusion and that wall motion is more improved during the chronic period. On the other hand, the time course of recovered adenosine triphosphate production attributed to the mitochondria resembles that of the recovery of cardiac function (37). Improved metabolism of fatty acid may be associated with wall motion (38,39). The degree of wall motion improvement is closely correlated with the improvement in fatty acid metabolism reflected on the BMIPP image (40), but the decreased mitochondrial TF retention capacity might also be closely related to hypokinesis. Long-term studies should be implemented, and the ability of TF delayed images and BMIPP images to predict wall motion recovery as well as to estimate long-term prognosis must be defined. Because importance has recently been placed on cost-effectiveness, TF delayed images have the potential to play essential roles in estimating the prognosis of patients with AMI.
CONCLUSION
99mTc-TF and 123I-BMIPP SPECT was performed during the time course before and after the reperfusion treatment of AMI, and changes in myocardial perfusion and reverse redistribution were examined. Our results suggest that a 7-d interval should be placed between reperfusion therapy and 99mTc-TF SPECT to evaluate a salvage effect (i.e., SPECT imaging immediately after reperfusion therapy underestimates the salvaged area) and that TF delayed images and BMIPP images were both useful in estimating the risk area. Further studies are needed to elucidate the usefulness of both tracers in estimating the recovery of wall motion in a chronic period and the long-term prognosis.
Footnotes
Received Dec. 30, 2000; revision accepted May 2, 2001.
For correspondence and reprints contact: Ryo Tanaka, MD, Kushiroshi Ishikai Hospital, 4-30 Nusamai-Cyou, Kushiro-City, Hokkaido, 085-0836 Japan.


