


Abstract
Left ventricular ejection fraction (LVEF) and viability are essential variables for the prognosis of myocardial infarction and can be measured simultaneously by 201Tl gated SPECT; however, most algorithms tend to underestimate LVEF. This study aimed to evaluate a new myocardial tracking algorithm, MyoTrack (MTK), for automatic LVEF calculation. Methods: A rest/redistribution (20 min/4 h) 201Tl gated SPECT protocol followed immediately by a 99mTc equilibrium radionuclide angiography (ERNA) was performed in 75 patients with history of myocardial infarction. Quality of myocardial uptake was evaluated from count statistics and automatic quantification of defect sizes and severities (CardioMatch). LVEFs were calculated both with Germano’s quantitative gated SPECT (QGS) algorithm and with MTK. Briefly, the originality of this algorithm resides in the unique end-diastole segmentation, matching to a template and motion field tracking throughout the cardiac cycle. Results: ERNA LVEF averaged 33% ± 14%. QGS significantly underestimated this value at 20 min (30% ± 13%, P < 0.001) and at 4 h (30% ± 13%, P < 0.0001). By contrast, MTK did not miscalculate LVEF at 20 min (34% ± 14%, probability value was not significant) though a similar underestimation occurred at 4 h (31% ± 13%, P < 0.02). Individual differences between early and late gated SPECT values and differences between gated SPECT and ERNA values did not correlate with the extension of perfusion defects, count statistics, or heart rate. Conclusion: The MTK algorithm calculates LVEF on early/high-count images more accurately than ERNA, even in patients with severe perfusion defects, but tends to underestimate LVEF on delayed/low-contrast images, as other algorithms do.
Combined measurement of left ventricular ejection fraction (LVEF) and residual viability after a myocardial infarction (MI) has demonstrated incremental prognostic value of cardiac events (1,2). Particularly, it allows the detection of hibernating tissue and may lead to a revascularization procedure with subsequent functional gain (1,3). The possibility of measuring these critical variables of cardiac function during the same acquisition with 201Tl gated SPECT (gated SPECT) is very attractive (4).
Numerous algorithms have been proposed for extracting LVEF information from gated SPECT data (5–10). The most widely accepted algorithm, quantitative gated SPECT ([QGS] Cedars Sinai Medical Center, Los Angeles, CA), was developed by Germano et al. (7) and has largely contributed to the rapid growth of gated SPECT techniques (11). This algorithm has shown satisfying precision (intra- and interstudy reproducibility) with 99mTc-labeled agents (7,12–14) and, to a lesser extent, with 201Tl-labeled agents (14–16). However, QGS leads to a systematic underestimation of LVEF compared with planar equilibrium radionuclide angiography (ERNA); this underestimation is mainly attributed to a temporal undersampling of the left ventricular-volume–time curve (7–15). Although this relative inaccuracy may have little impact on the prognosis of patients with low likelihood of coronary artery disease, it may become critical in patients with a history of MI. In the latter case, severe perfusion alteration may further impair the detection of endocardial outlines by QGS (12,15,17) and further reduce the accuracy of LVEF measurement.
In this study, we present a new algorithm, MyoTrack ([MTK] HealthCenter Internet Services, Sophia-Antipolis, France), for the calculation of LVEF from gated SPECT acquisitions. For an optimal and rigorous testing, we evaluated both the precision of this method in a 201Tl rest/redistribution (20 min/4 h) protocol and its accuracy versus planar ERNA in patients with severe perfusion defects resulting from an MI.
MATERIALS AND METHODS
Population
We consecutively studied 75 patients (70 men, 5 women; age range, 35–79 y; mean age, 59 ± 11 y) referred for viability assessment after MI between June 1999 and June 2000. We excluded patients with acute MI (<15 d), unstable angina, or electrocardiographic arrhythmia. All patients weighed <100 kg. Necroses predominantly involved the anteroseptal wall in 48 patients, inferior wall in 23 patients, and lateral wall in 4 patients. All patients underwent the same 1-d imaging protocol, including rest/redistribution 201Tl gated SPECT, followed by planar ERNA.
Acquisition Protocol
Rest and redistribution gated image volumes were gathered 20 min and 4 h after a unique intravenous injection of 111 MBq 201Tl-chloride. Both acquisitions were performed after 10 min of rest using the same single-head APEX-SP6 gamma camera (Elgems, Haifa, Israel) equipped with a low-energy all-purpose collimator. Spectrometry was centered on both the 71 and 167 keV 201Tl photopeaks with 30% and 20% symmetric windows, respectively. Gated SPECT procedure consisted of a 180° circular orbit acquisition around a supine patient (n = 71) or prone patient (n = 4) with 30 40-s steps; total imaging duration was 20 min. Each projection included 8 frames per cardiac cycle in 64 × 64 matrices. Perfusion volumes were derived from the summation of the 8 projections per cycle whereas contraction images were obtained from the addition of the 30 projections every eighth of a cycle.
Planar ERNA was performed within several minutes after the 4-h redistribution scan, using an APEX-415 single-head gamma camera (Elgems) equipped with a low-energy all-purpose collimator. Equilibrium images were acquired in the left anterior oblique (with adapted angle for optimal septum visualization) after in vivo labeling of red blood cells by injection of 1 mL pyrophosphate and 740 MBq 99mTc. This projection included 16 frames per cardiac cycle, in a 64 × 64 matrix, and spectrometry was centered on the 140 keV photopeak with a 20% tolerance window. Total acquisition count was preset at 6.4 million.
Quality Control
For the determination of count statistics, a circular region of interest (ROI) was drawn around the epicardium on the 45° left anterior oblique projection, which corresponded to the 15th step for most acquisitions. Within each patient, we kept the same ROI size between early and late images. Additionally, an unvarying-sized pulmonary ROI was drawn at the middle third level of the right lung field on the anterior projection, which was usually the fifth step of tomograms. Within these ROIs, total count, absolute minimum, absolute maximum, and mean count-per-pixel were measured to quantify myocardial uptake and lung-to-heart ratio. Ultimately, an analysis of uptake heterogeneity was performed by calculating SD and skewness of the activity histogram within the myocardial ROI, and the 2-dimensional (2D) gradient of spatial distribution (average slope of the intensity profile between 2 neighboring pixels).
Perfusion Analysis
After the sinogram was checked, perfusion image volumes were reconstructed by filtered backprojection with a 2D Butterworth filter (order 4.0, cutoff 0.25 cycles per pixel) and manually reoriented. Perfusion defects were quantified by CardioMatch (HealthCenter Internet Services), an automated software package previously validated (18,19). Briefly, this interface automatically determined left myocardial edges and matched them to a reference template of normal perfusion distribution. Then, it compared the perfusion intensity within each voxel to the mean intensity of the corresponding voxel issued from a database of gender-matched and template-matched normal perfusion scans. In every matched myocardium, this technique provided an objective score for the MI extension (volume of significantly hypoperfused voxels divided by the entire myocardial volume), severity (average loss of intensity within the defect), and location. Reconstruction, reorientation, and automated analysis were performed by 2 operators who were blinded to the patients’ characteristics and interobserver reproducibility was determined.
LVEF Processing
LVEF was calculated from gated SPECT volumes using both the QGS and the MTK software packages (Fig. 1). Heart rate was noted for the early and late acquisitions.
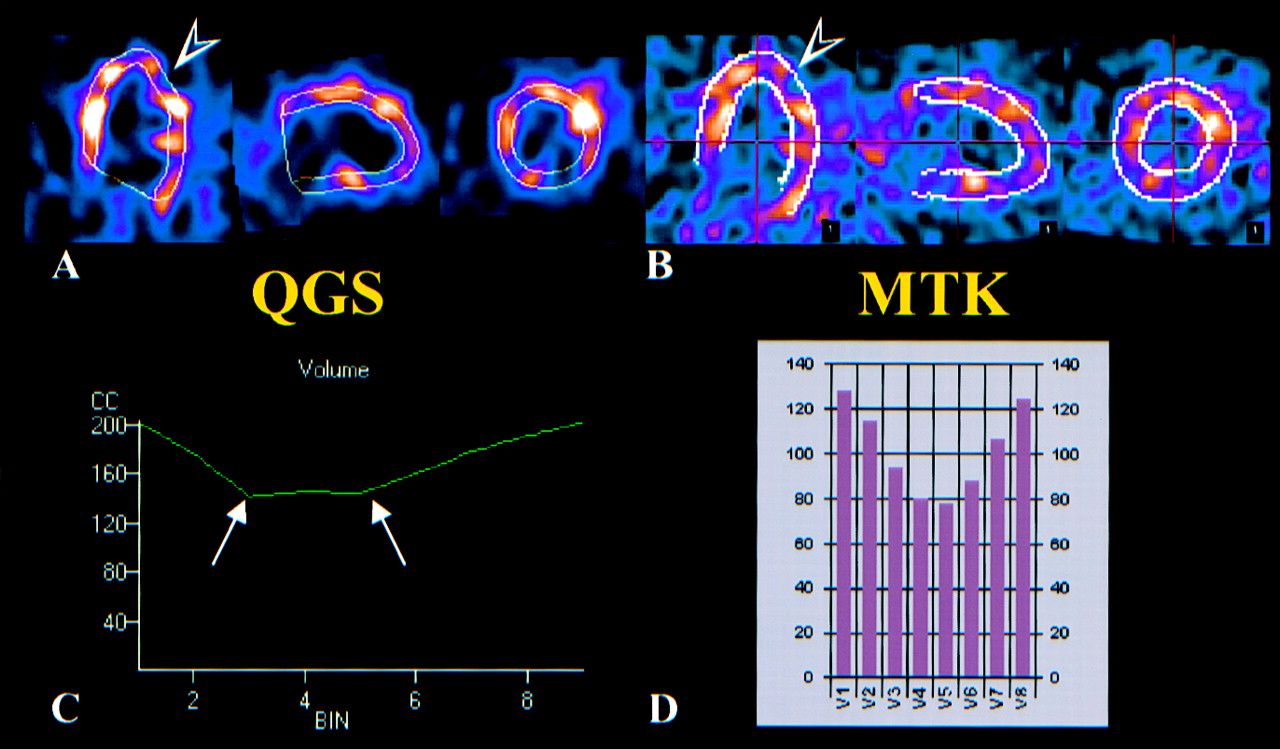
Example of LVEF processing within same patient with QGS (A) and MTK (B) methods. Note difference in myocardial edge detection (arrowheads), which may alter left-ventricular–time curve (arrows) between QGS (C) and MTK (D). Ejection fraction was measured at 45% using ERNA, 41% using MTK, and 30% using QGS.
QGS Method.
The interface implemented on our Xpert system 5.13 (Elgems) first reconstructed the gated volumes using a Butterworth filter (order 5.0; cutoff, 0.35 cycle per pixel), then detected the endocardial surfaces on short-axis slices for each of the 8 frames per cardiac cycle, and finally derived LVEF from end-diastolic and end-systolic ventricular volumes. No manual correction was allowed in our version; consequently, the automated edge detection was visually controlled by 2 observers for eventual withdrawing of failed patients but detection was judged successful in all cases.
MTK Method.
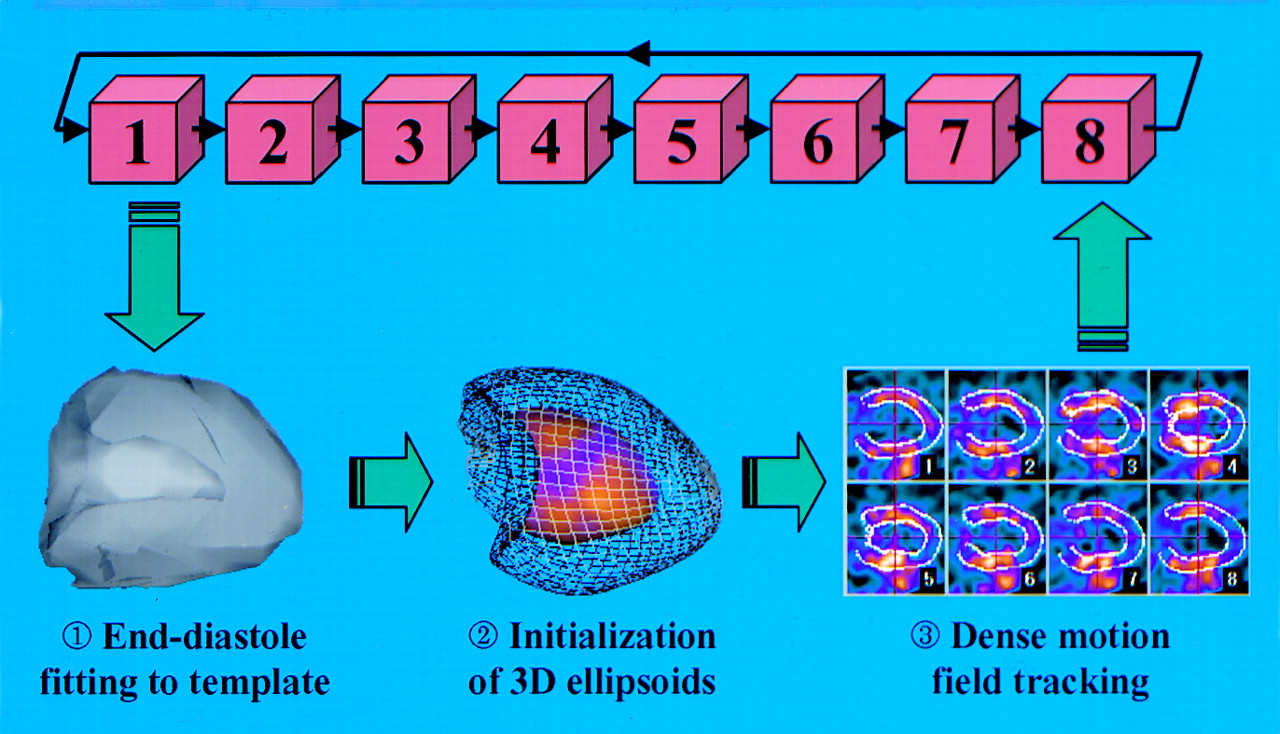
Because MTK processing has been described elsewhere (20–22), the steps are only summarized here (Fig. 2). After manual reconstruction using a Butterworth filter (order 6.0; cutoff, 0.50 cycle per pixel), the gated volumes underwent only 1 segmentation of the first time-frame (generally the end-diastole). This segmentation consisted of an affine matching between the end-diastole myocardium and a reference myocardial template (18), which provided morphological a priori knowledge of the perfusion distribution (e.g., for the determination of a nonflat valve plane) and allowed for the initialization of two 3-dimensional (3D) elastic ellipsoids (endocardial and epicardial). These surfaces were represented by a set of nodes (3D grid) regularly defined in polar coordinates. The nodes were then used to track ventricular motion in the 3D + T (time) sequence throughout the 8 phases of the cardiac cycle using a dense motion field computation with iterative constraints of intensity conservation and temporal cyclicity (20–22). Each deformation field (1 for each time-frame) was used to update the ellipsoid node positions during the sequence, leading to a 3D dynamic surface representation, out of which LVEF was calculated by volume computation. Reconstruction, reorientation, and LVEF calculation of all datasets were completed by 2 operators who were blinded to other results, and interobserver reproducibility was determined. Reconstruction was performed with an optimized zoom factor (>2.0) empirically determined in an unpublished substudy. Total processing time of 1 ejection fraction (including manual steps) took approximately 3 min on a 450-MHz workstation.

Description of MTK algorithm for calculation of ejection fraction. Unique myocardial segmentation is performed on first time-frame volume (1, end-diastole) with matching to reference template to obtain morphological constraints of perfusion distribution, particularly for determination of valve plane. This procedure generates two 3D elastic ellipsoids (2, endocardial surface is represented mapped with perfusion polar map and epicardial surface is represented as wire grid). Node positions of these ellipsoids are tracked throughout 8 frames of cardiac cycle (3).
LVEF was calculated from ERNA using the Xpert 5.13 planar processing, which automatically drew an ROI around the left ventricle cavity for each frame of the cardiac cycle and derived LVEF from end-diastolic and end-systolic counts inside the ROI. Cinema display and automated ROI drawing were checked by 2 observers; in cases of software failure, the defective ROI was redrawn. Heart rate was noted just as it was for the gated SPECT acquisitions.
Statistical Analysis
Interstudy repeatability between rest (20 min) and redistribution (4 h) gated SPECT ejection fractions was assessed by paired Student t test and regression analysis. Similarly, comparisons between QGS and MTK results were evaluated using paired t test and regression analysis. Accuracy of LVEF values calculated using gated SPECT compared with planar ERNA was assessed using the Bland–Altman plot (23). Furthermore, influence of acquisition parameters (counts, heterogeneity, heart rate) and perfusion alterations on eventual LVEF disagreements between both gated SPECT or between gated SPECT and ERNA was assessed using regression analysis. All analyses were performed with Statview 5.0 software (SAS Institute Inc., Cary, NC) and P < 0.05 expressed a significant difference.
RESULTS
Gated SPECT Versus Planar ERNA Ejection Fractions (Accuracy)
Reference LVEF calculated from semiautomated planar ERNA averaged 33% ± 14% (range, 9%–69%). Comparatively, ejection fractions obtained from gated SPECT with the QGS algorithm were significantly lower by −2.96 ± 7.39 units below ERNA values at 20 min (P < 0.001) and by −3.29 ± 6.36 units at 4 h (P < 0.0001) but linear regression showed correlation factors > 0.85 (Table 1). Bland–Altman analysis showed close agreement between QGS and ERNA, with ranges from mean ± 2 SDs calculated for early and late acquisitions at 29.56 and 25.44 units, respectively (Fig. 3).
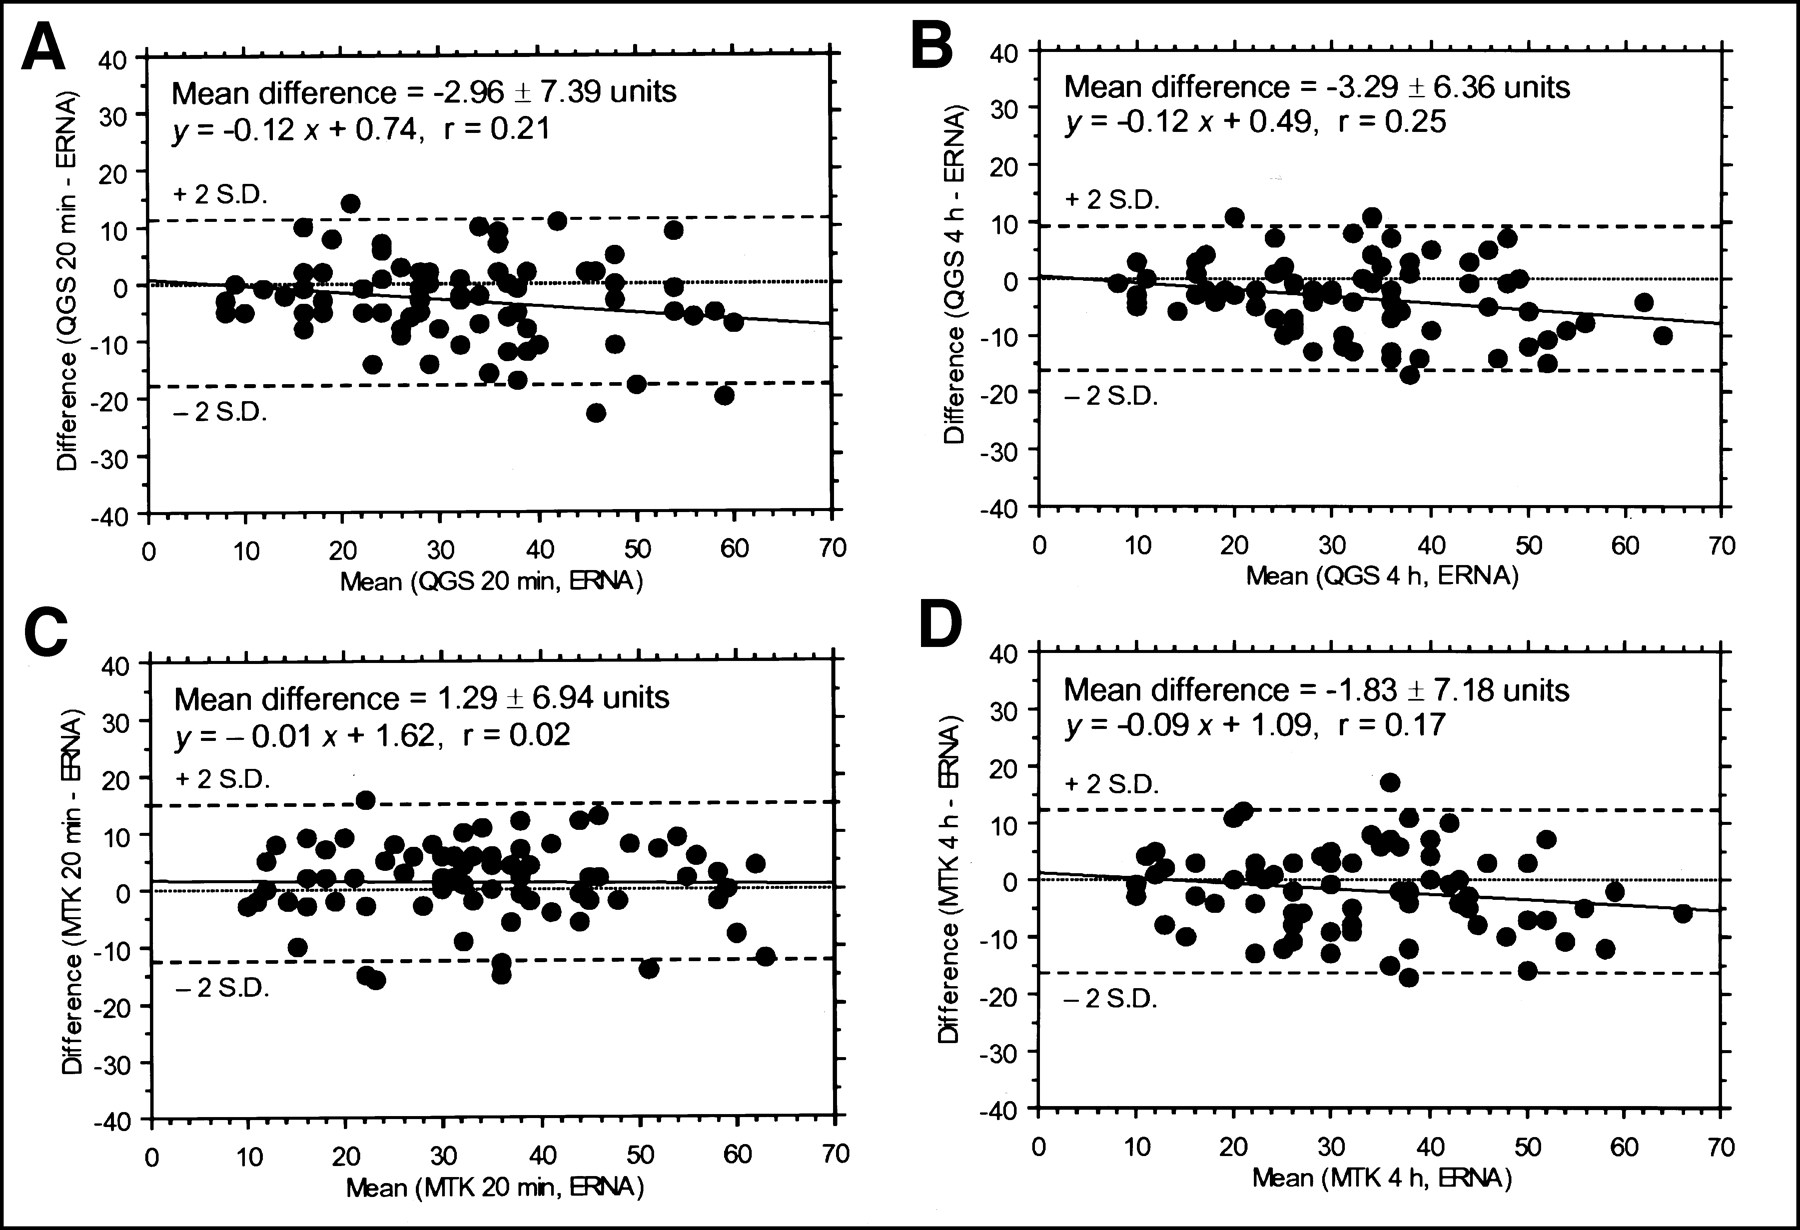
Bland–Altman representation of accuracy of gated SPECT ejection fractions compared with planar ERNA, calculated with QGS at 20 min (A) and at 4 h (B) and calculated with MTK at 20 min (C) and at 4 h (D). Except for MTK at 20 min, each process led to significant underestimation.
Correlation Between Planar ERNA and Two Gated SPECT Acquisitions Processed with QGS and MTK
Interestingly, LVEF values calculated with the MTK method at 20 min were not statistically different from those obtained with ERNA, whereas a −1.83 ± 7.18 unit underestimation was observed at 4 h, similar to the one reported with QGS (P < 0.02, Table 1). Linear regression showed correlation factors > 0.85 and Bland–Altman analysis of the agreement between MTK and ERNA found ranges from mean ± 2 SD calculated for early and late acquisitions at 27.76 and 28.72 units, respectively (Fig. 3).
Furthermore, we ranked our population into 5 subgroups in increasing range of reference LVEF (ERNA) and we noticed that the QGS underestimation progressively increased at the higher LVEF range (Fig. 4). Closer agreements were obtained in the lower range of LVEF (groups I and II, LVEF ≤ 29%) whereas significant differences were found in the higher range (groups III to V, LVEF ≥ 30%). The same phenomenon, although moderate, was observed with MTK at 4 h and for higher LVEF range (groups IV and V, LVEF ≥ 40%). By contrast, no significant difference between ERNA and MTK was observed at 20 min for all ranges of LVEF.

After dividing population into 5 subgroups according to ERNA range, we show that underestimation of LVEF by QGS at 20 min (A) and at 4 h (B) progressively increases when actual LVEF is high. Paired t tests are significant in groups with LVEF ≥ 30%. MTK at 20 min (C) accurately measures LVEF with no significant differences between gated SPECT and ERNA values in all subgroups. Results obtained with MTK at 4 h (D) show similar progressive underestimation of LVEF ≥ 40%, as with QGS. Boxes represent mean underestimations with associated error bars.
Rest Versus Redistribution Gated SPECT Ejection Fractions (Precision)
Reproducibility.
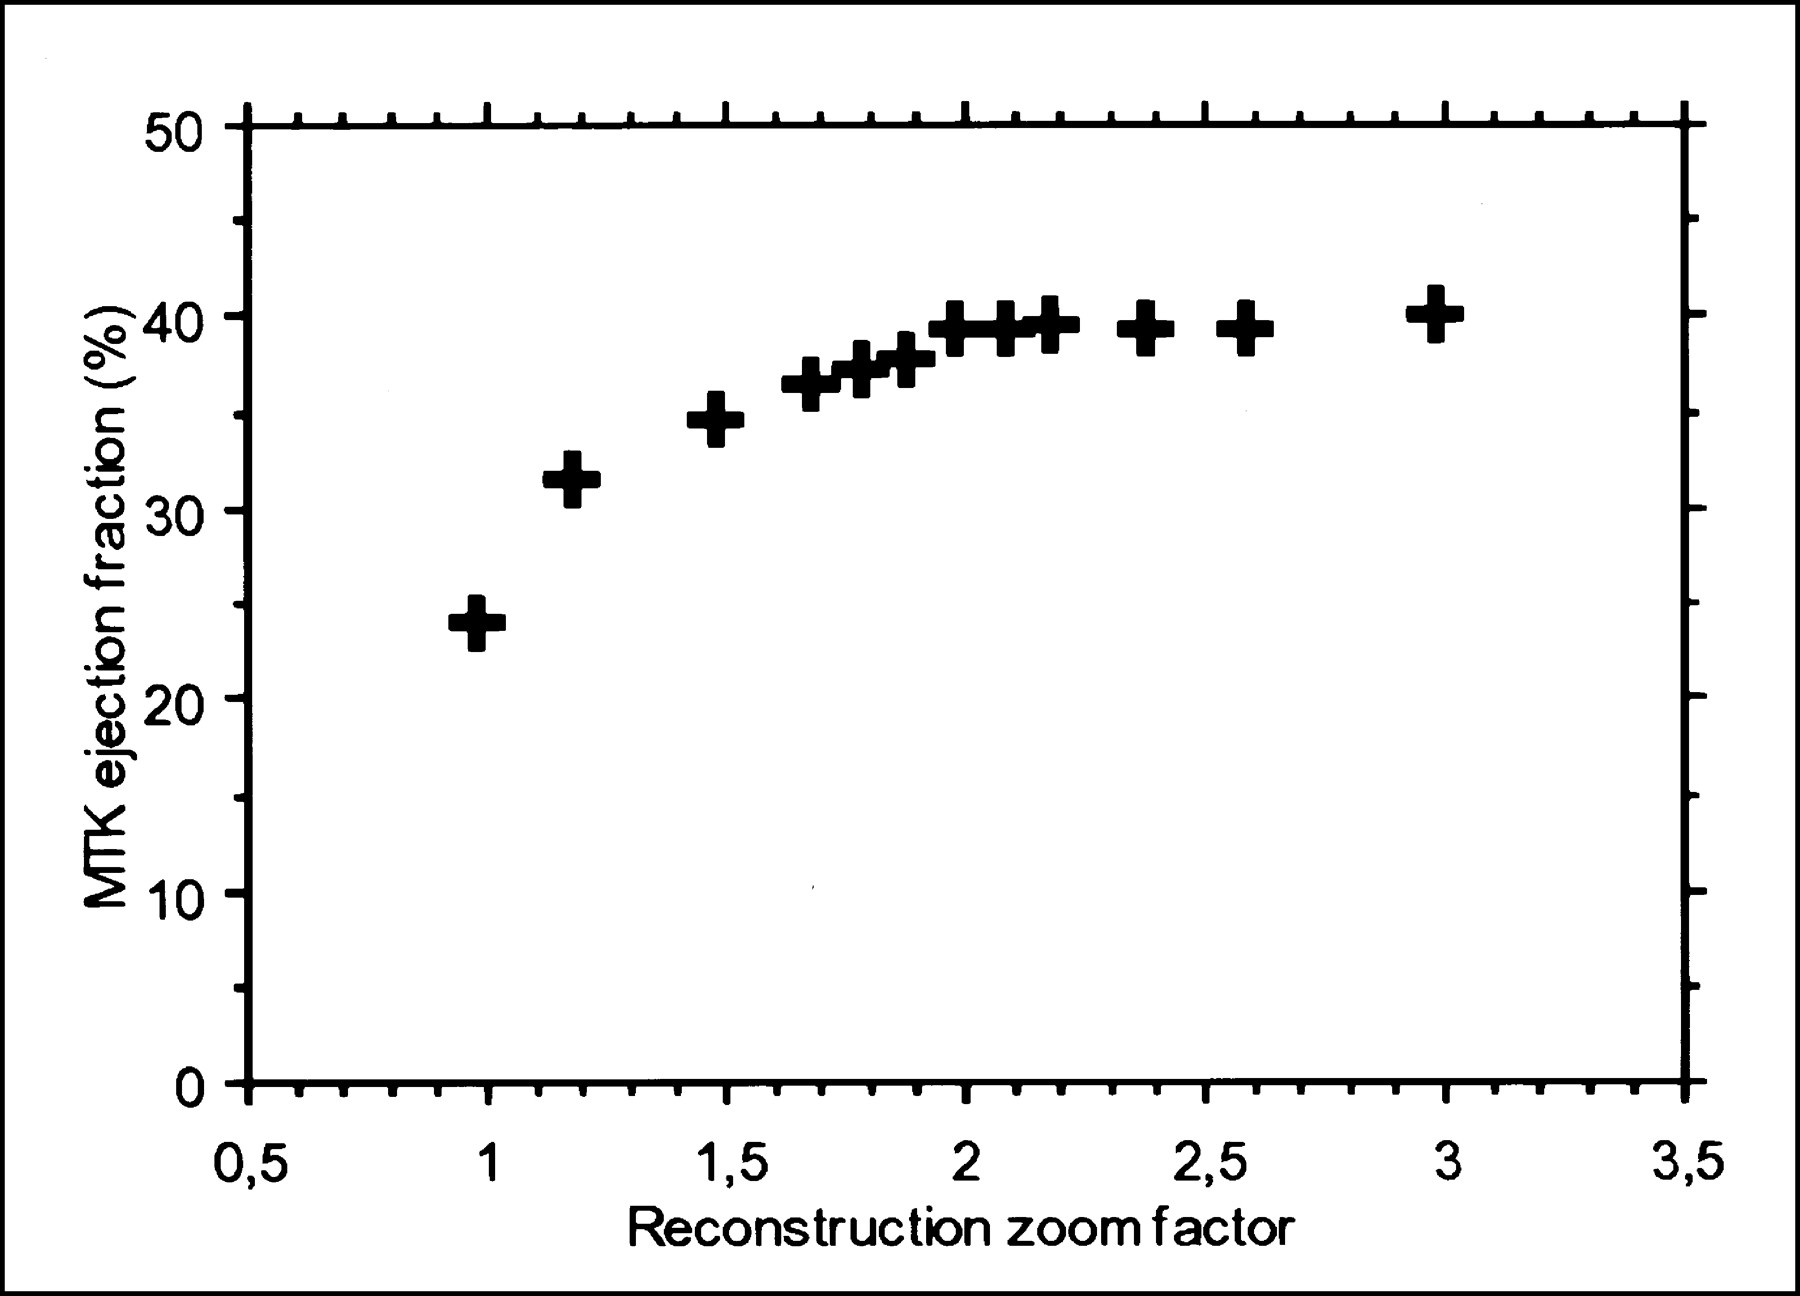
Interobserver reproducibility of the full MTK processing was excellent at 20 min (r = 0.979, SD = 2.96) and at 4 h (r = 0.975, SD = 3.03). However, we noticed that a reconstruction zoom of 2.0 or higher was mandatory to avoid systematic lowering of LVEF values (Fig. 5).

Low reconstruction zooms artificially underestimate LVEF calculated with MTK. This systematic error can be avoided by using zoom factor of 2.0 or higher.
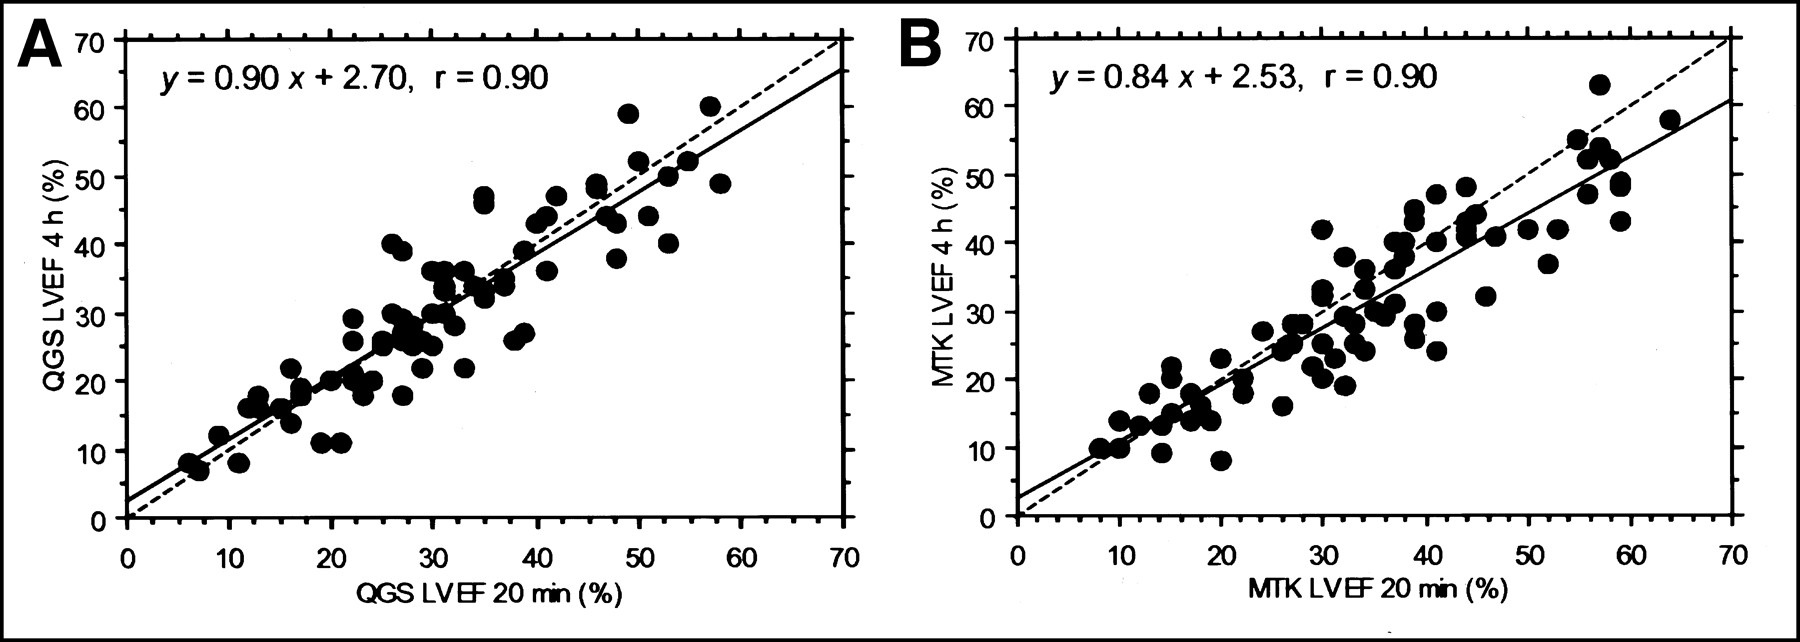
Repeatability.
There was no significant difference between LVEF values calculated at 20 min and at 4 h with QGS and correlation was very good with r = 0.90 (Fig. 6). Conversely, a significant drop was observed between 20 min and 4 h with MTK computation (mean difference = −3.12 ± 6.22 units, P < 0.0001). The correlation factor was identical, but the linear regression slope was slightly closer to 1.0 when measured with QGS than when measured with MTK. We observed that 56 patients (75%) had individual discrepancies ≤5 units between early and late LVEFs with QGS, whereas only 43 patients (57%) had these discrepancies with MTK. These discrepancies ranged 6–10 units in 11 patients (15%) with QGS and in 20 patients (27%) with MTK.

Regression analysis between LVEF calculated from repeated gated SPECT acquisitions (early and delayed) shows good reproducibility of Germano’s algorithm despite significant count decay. By contrast, LVEF values measured during delayed/low-count acquisitions with MTK are significantly lower than those measured during early/high-count acquisitions.
Influence of Count Statistics on LVEF Calculation
Variations of count statistics between early and late gated SPECT acquisitions are summarized in Table 2. As expected from the myocardial pharmacodynamics of 201Tl, we observed a significant −29% ± 12% decay of total counts within the ROI as well as a significant decay of the maximum, minimum, and mean counts (−29% ± 12%, −32% ± 16%, and −30% ± 12%, respectively). As a consequence of the relative homogenization of delayed myocardial uptake, we noticed a significant (−25% ± 16%) decrease of the pixel SD between 20 min and 4 h as well as a significant decrease of the 2D gradient, though no significant difference was found concerning the skewness of count histogram. Finally, we observed a significant (−3% ± 17%) decrease of lung-to-heart ratio between 20 min and 4 h.
Count Distribution and Heterogeneity of Myocardial Uptake for Both Gated SPECT Acquisitions
No correlation was found between individual LVEF variations from 20 min to 4 h and the corresponding variations of counts, homogeneity, or lung-to-heart ratio, with either QGS or MTK methods. In addition, no significant relationship was found between the LVEF underestimation observed with QGS (at 20 min and 4 h) or with MTK (at 4 h), compared with ERNA, and the corresponding values of count, homogeneity, or lung-to-heart variables summarized in Table 2. However, we noticed that QGS and MTK underestimation of LVEF at 4 h tends to be all the more severe when SD of the myocardial uptake was low and skewness was negative (asymmetric histogram tail on the low intensities).
Influence of Perfusion Defects on LVEF Calculation
Infarction sizes detected by CardioMatch at 20 min ranged from 2.1%–63.8% (mean, 27.1% ± 15.4%) of the entire myocardial volume. Interobserver reproducibility of this processing was excellent with r = 0.988 and SD = 2.3%. Severity of hypoperfusion within the MI defects averaged 44.3% ± 10.0% of intensity loss compared with the normal reference populations (range, 23.9%–69.2%). A significant 201Tl redistribution of perfusion was detectable in only 6 patients at 4 h. In those cases, volume of redistribution averaged 5.2% ± 5.0% of the initial defect and intensity recovery averaged 28.2% ± 11.7% of the initial loss, but, relative to the entire population, redistribution was considered negligible.
We did not observe any relationship between MI size or severity and the magnitude of LVEF underestimation by QGS (at 20 min and 4 h) or MTK (at 4 h). Similarly, individual LVEF variations from 20 min to 4 h were not correlated with MI size or severity, with either QGS or MTK.
Influence of Heart Rate on LVEF Calculation
Despite every effort to perform all acquisitions at rest, we observed significant variations of heart rate between 20-min and 4-h gated SPECT (75 ± 16 and 79 ± 19 bpm, respectively; P = 0.02) as well as between 4-h gated SPECT and ERNA (74 ± 17 bpm; P = 0.008). However, the discrepancies between the 3 individual LVEF values were not statistically related to the corresponding variations of heart rate, when gated SPECT ejections fractions were calculated with QGS or MTK (heart rate variation averaged +7% ± 22% between 20 min and 4 h, −2% ± 15% between 20 min and ERNA, and −8% ± 21% between 4 h and ERNA).
DISCUSSION
This study investigated a new software approach for the automated calculation of LVEF from perfusion gated SPECT data. The method described was tested during critical scintigraphic settings (i.e., during a rest/redistribution protocol involving an isotope with suboptimal properties, 201Tl, in patients with severe perfusion defects resulting from a myocardial infarction). We demonstrated that MTK can calculate LVEF with high accuracy during early rest acquisitions compared with planar ERNA, which was chosen as the gold standard, though the repeatability of measures at 4-h intervals was less satisfying than it was with the QGS method.
Accuracy of Gated SPECT Measurements Versus Planar ERNA
An important finding of our study is that MTK did not underestimate the LVEF during early gated SPECT acquisitions, unlike QGS.
We found that QGS processing resulted in a slight underestimation of LVEF values during both the 20-min and the 4-h acquisitions, which averaged −2.96 and −3.29 units, respectively (Fig. 3). This underestimation is generally attributed to temporal undersampling of the 8-frame versus 16-frame acquisition procedure (7). In our population, QGS underestimation was of the same order as that given by Germano (−3.71%) (7), as well as those given by others (15,16). Therefore, one must take into account this phenomenon when interpreting LVEF given by QGS, compared with anatomical techniques such as contrast ventriculography (10,24), echocardiography (25), or cine MRI (17,26). In fact we emphasized in our results that the LVEF underestimation was more in proportion to the level of cardiac contraction than it was to the rapidity of cardiac cycle. Indeed, both the Bland–Altman plots (Fig. 3) and the detailed analysis of the LVEF range of values (Fig. 4) demonstrated progressively increasing underestimation of ejection fractions > 30%, as previously described (10), whereas individual LVEF discrepancies were not correlated with the magnitude of heart rate variations.
By contrast, the MTK algorithm did not underestimate ERNA ejection fractions for any range of magnitude (Fig. 4). Since it is based on motion field tracking, we assume that the temporal cyclicity constraints of this approach are more efficient. Indeed, the algorithm uses 3D deformable grids where each node trajectory throughout the cardiac cycle [x(t),y(t),z(t)] is approximated by a sinusoid constrained to its first Fourier harmonic. All previously published methods of gated SPECT processing rely on frame-by-frame segmentation of the myocardial outlines (5–10); therefore, each image volume is considered independently, even if temporal filtering is applied to smooth the final left ventricular curve. Conversely, tracking heart motion is the more natural approach for MRI techniques, such as tagged MRI (27), phase contrast MRI (28), or gated MRI (29), but it has never been applied to gated SPECT imaging before. We demonstrate here that such an approach is valid.
We can also assume that the detection of myocardial outlines are better with MTK, for 3 main reasons. First, the segmentation of end-diastole image volume relies on a Canny–Deriche filter (30), which uses a recursive approach to allow more robustness than the classical methods based on the detection of myocardial outlines or mid wall through radial intensity profiles (7–9). Second, the affine transformation leading to template matching gives morphological constraints that suit the myocardial perfusion distribution more accurately than would an ellipsoid fitting (7) (Fig. 1). Third, all steps of LVEF computation by MTK are fully 3D, unlike other methods where ventricular surfaces are determined from the 2D outlines detected on the short-axis (5,7) or long-axis slices (10).
Concerning the influence of perfusion defects, we assume that the greater accuracy of LVEF measurements with MTK more likely results from the dense motion field tracking than from the method used for myocardial segmentation. Indeed, a tracking approach is theoretically independent from MI perfusion defects because the defects are present throughout the cardiac cycle. In contrast, the segmentation method could be influenced by the size and severity of MI defects. However, we noticed that both QGS and MTK results were equally unaffected by these variables. In fact, some counts generally persist in the most depleted areas, as long as no thresholding occurs (13). These counts are not necessarily apparent to the naked eye but may contribute to the accuracy of myocardial delineation (13) (Fig. 1).
Precision of Gated SPECT Measurements Between 20 Minutes and 4 Hours
LVEF values obtained with MTK at 4 h were significantly lower than those obtained at 20 min, in contrast to QGS measurements, which appeared to be slightly more accurate at 4 h than at 20 min (highest correlation factor, lowest SEE; Table 1). Several reasons may explain the relative lack of repeatability of the MTK algorithm.
First, we observed a significant count loss (−30%) within the circular myocardial ROI between early and late acquisitions, resulting from radioactive decay and absence of redistribution. In parallel, we observed a significant homogenization of pixel intensities within the ROI, as expressed by the decrease of pixel SD and 2D gradient. Because the ROI included both the myocardium and the ventricular cavity, those count variations undoubtedly lead to a lower contrast of gated SPECT images with subsequent impairment of the edge detection algorithm. Reduction of the accuracy of LVEF measurements by low count density has been documented through phantom simulation with 99mTc-sestamibi (31) and has been suggested, but not documented, with 201Tl (32,33). However, in our study, individual LVEF variations between 20 min and 4 h were not correlated with changes in count density. We only found a trend of significance with the SD and the skewness within the myocardial ROI, but for both MTK and QGS algorithms.
Background activity is another variable that may affect LVEF computation. We found high lung-to-heart ratios in our population, as expected from the MI-related cardiac failure, even in absence of stress (34). Therefore, epicardial segmentation was probably more difficult in this setting than it would be with healthy patients. However, lung-to-heart ratios significantly decreased at 4 h. This may explain why QGS measurements were better at 4 h than at 20 min but not why MTK measurements were lessened.
A last explanation could be the temporal variability of ventricular response to hidden physical or mental stress. Past studies on ambulatory LVEF monitoring (nuclear stethoscope) have noted that LVEF may increase up to +18% during such daily activities as walking, climbing stairs, and eating, or may decrease up to −5% when sitting in a cold room and performing mental tasks (35,36). However, this concept of environmental stress is not supported in our study for 2 reasons. First, no correlation was found between heart rate variation and the corresponding LVEF discrepancies calculated between both gated SPECT acquisitions. Second, even if we observed a significant increase (+7%) in heart rate from 20 min to 4 h, most of the patients showed heart rate variations ≤20 bpm. Subsequently, heart rate has little expected effect on the ventricular-volume–time curve; the effect involves only the slow diastolic segment, whereas the stroke volume remains essentially unchanged.
Study Limitations
Only indirect comparison between QGS and MTK ejection fractions was performed in this study. Direct comparison would have required the homogenization of reconstruction parameters (filter, zoom) between both 3D algorithms. In fact, we wanted to validate this new method versus ERNA. The choice of this gold standard may raise controversy when evaluating a new 3D technique (37). Planar ERNA is by definition a 2D technique with uncertainty regarding the shape of the ventricular cavity and may occasionally require manual ROI drawing and operator dependence (7). However, planar ERNA has largely asserted its high interstudy reproducibility in the past (38) and continues to do so today (39).
Eight-frame sampling was not compared with 16-frame sampling in our study, although the comparison would have verified that MTK does not overestimate LVEF values at 20 min in 16-frame sampling. However, we noticed that the ventricular time curves resulting from MTK analysis systematically appeared smoother than those for QGS, which sometimes showed acute angles from one segment to another (Fig. 1). Furthermore, 16-frame sampling would substantially lengthen the acquisition time and diminish the benefit of simultaneous perfusion/function imaging, which is why 8-frame sampling has become the dominant approach (40).
We have observed that reconstruction zoom during MTK processing must be at 2.0 or higher to avoid systematic underestimation of LVEF (Fig. 5). Reconstruction/reorientation is operator dependant at this time; this limitation will soon be corrected by an automatic reorientation module that is currently being developed.
CONCLUSION
This study showed that the new MTK method accurately evaluated LVEF from rest 201Tl gated SPECT in patients with extended MI, essentially because of the tracking algorithm. There is clear clinical relevance for this subset of patients in whom LVEF has a critical value in terms of prognosis. However, we noticed that the accuracy was lower during the 4-h redistribution images, essentially because of the significant degradation of uptake intensity and contrast within the left myocardium. We find it reassuring that a method based on the detection of myocardial outlines is sensitive to the image quality because it will force the users to trust the LVEF values only when imaging conditions are optimal.
We used MTK and QGS as is, that is, with their routine default settings. We believe that further studies are needed to compare the influence of intrinsic parameters of the methods, such as the filtering. Moreover, such studies should probably be performed on healthy patients or phantoms and with 99mTc-labeled tracers to avoid the bias of image quality.
Footnotes
Received Sep. 19, 2000; revision accepted Jan. 17, 2001.
For correspondence or reprints contact: Emmanuel Itti, MD, Service de Médecine Nucléaire, CHU Henri Mondor, 51 av. du Maréchal de Lattre de Tassigny, 94010 Créteil, France.
REFERENCES
In this issue


Jump to section
Related Articles
Cited By...
- No citing articles found.