


Abstract
Brain perfusion SPECT is a functional neuroimaging technique that allows noninvasive study of physiologic and physiopathologic events in the human brain. With the appropriate technique and careful interpretation of the information provided, brain perfusion SPECT has proven potential for patient management. SPECT has clinical value in the diagnosis, therapeutic management, and follow-up of patients. The diversity of central nervous system diseases and the still incomplete knowledge of the mechanisms that underlie them have contributed to the success of brain perfusion SPECT as a research tool in neurosciences. This article provides fundamental knowledge on how and when to perform brain perfusion SPECT in clinical practice. A general overview of the clinical value of this technique is followed by relevant information on cerebral physiology for proper understanding of brain SPECT images. Practical considerations on quantification and interventional studies are also offered. Finally, step-by-step recommendations for interpreting and reporting brain perfusion SPECT images are provided to obtain the maximum clinical benefit from this technique.
Brain SPECT provides tridimensional information on the perfusion and metabolic status of brain tissue. This information is often complementary to the anatomic detail provided by structural neuroimaging techniques such as CT and MRI. However, brain perfusion SPECT has clinical value by itself, because functional impairment in cerebral diseases often precedes structural changes. SPECT images are often useful in the clinical management of patients, providing new and additional information that cannot be obtained from other techniques. Brain perfusion SPECT has a role in the diagnosis, therapeutic management, and follow-up of patients. In addition, SPECT is a useful tool for research, because it is widely available and provides noninvasive in vivo assessment of human brain function.
CLINICAL VALUE OF BRAIN PERFUSION SPECT
Clinical Value in Diagnosis
SPECT can be used to define a patient’s pathologic status when neurologic or psychiatric symptoms cannot be explained by structural neuroimaging findings. This dissociation between clinical and radiologic findings is frequently seen. A good example is the usefulness of perfusion SPECT in the differential diagnosis of dementias (1–3). SPECT is sensitive in detecting impairment of regional cerebral function when CT or MRI shows only nonspecific findings such as cerebral atrophy. Different perfusion patterns have been associated with different types of dementia. A decreased perfusion in the temporoparietal regions of the brain is associated with posterior dementia, such as Alzheimer’s type, whereas decreased perfusion in frontal or frontotemporal regions suggests frontal lobe dementia, such as Pick’s disease (Fig. 1). Accurate clasification of dementias is becoming crucially important because of recent advances in medical treatment (4,5). SPECT has an impact on therapeutic decisions by differentiating dementia of Alzheimer’s type from depressive pseudodementia, which can be effectively treated and presents with prefrontal perfusion impairment. The severity of the perfusion abnormality may evolve with increasing clinical impairment, leading to an additional role of SPECT in disease staging (6–8).

Brain perfusion SPECT patterns in dementia, using 99mTc-ECD. (A) Frontal lobe dementia: markedly decreased uptake in frontal lobes (arrows). (B) Dementia of Alzheimer’s type: hypoperfusion in posterior temporal regions, predominantly in left hemisphere (arrows). Indirect signs of cortico-subcortical atrophy, such as marked separation between hemispheres and between basal ganglia, can be clearly appreciated in both SPECT images.
The high sensitivity in detecting functional impairment is counterbalanced by poor specificity; that is, the same SPECT pattern may be encountered in different pathologies (Table 1). Detailed knowledge of the patient’s symptoms and the functional areas in the brain likely to be involved is important for interpretation of functional images. A close working relationship with the referring physician should be established, and the SPECT findings should be integrated with those of CT or MRI. Interdisciplinary cooperation improves the quality of the final report and optimizes the clinical yield of the SPECT technique.
Brain Perfusion SPECT Patterns Associated with Dementias and Other Brain Diseases
Brain injuries of different causes, such as vascular, tumoral, or traumatic, can impair neuronal impulses and interrupt connections with other cerebral regions, which may be distant from the original lesion. This phenomenon is referred to as deafferentation or diaschisis (9). Cerebral regions receiving poor afferent signals become hypofunctioning, decrease their metabolism, and appear as low-uptake areas in SPECT images, thus providing insight into the pathophysiology of clinical symptoms related to anatomically preserved cerebral regions (10,11) (Fig. 2). However, the most commonly seen pattern, known as crossed corticocerebellar diaschisis, usually has no clinically relevant consequences (Fig. 3) (12).
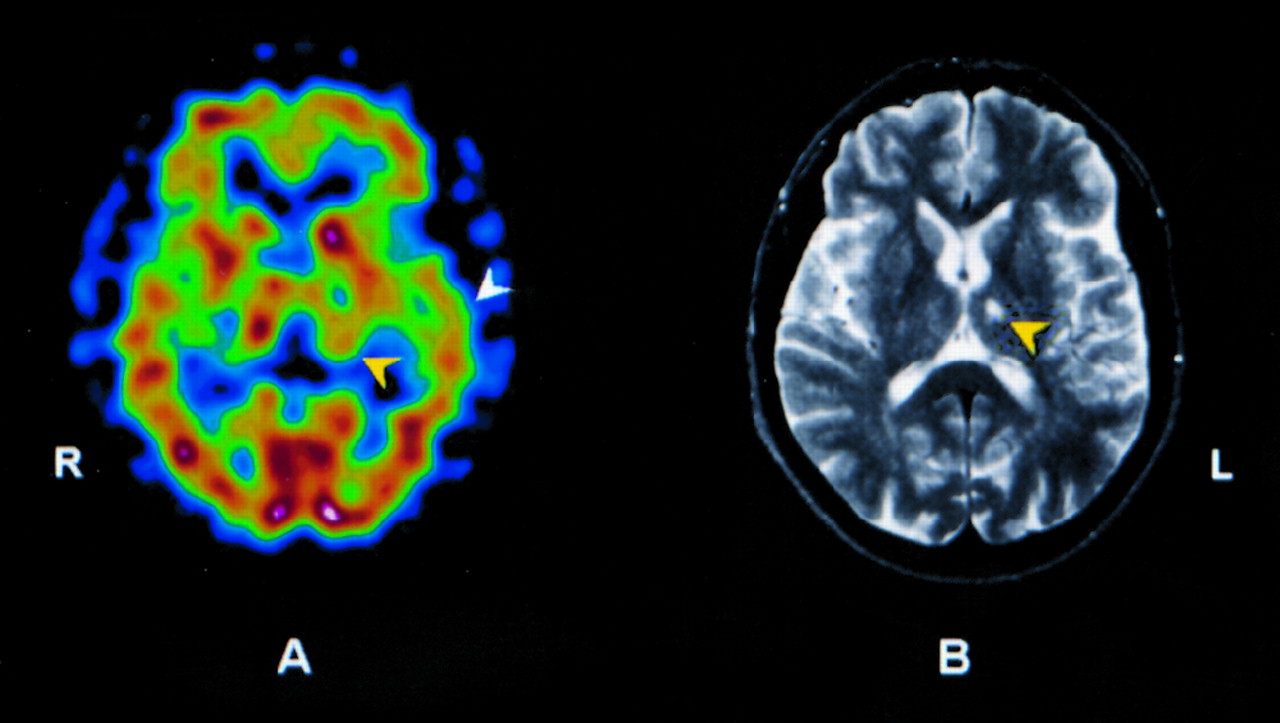
99mTc-HMPAO SPECT (A) and MRI (T2-weighted) (B) slices at basal ganglia level of patient with ischemic lesion in left thalamus (yellow arrowheads). Patient developed aphasia, which could not be explained by localization of anatomic lesion only. MRI of left temporal cortex was normal, but decreased tracer uptake in region can be seen in SPECT image (white arrowhead). This was interpreted as ipsilateral subcorticocortical deafferentation.

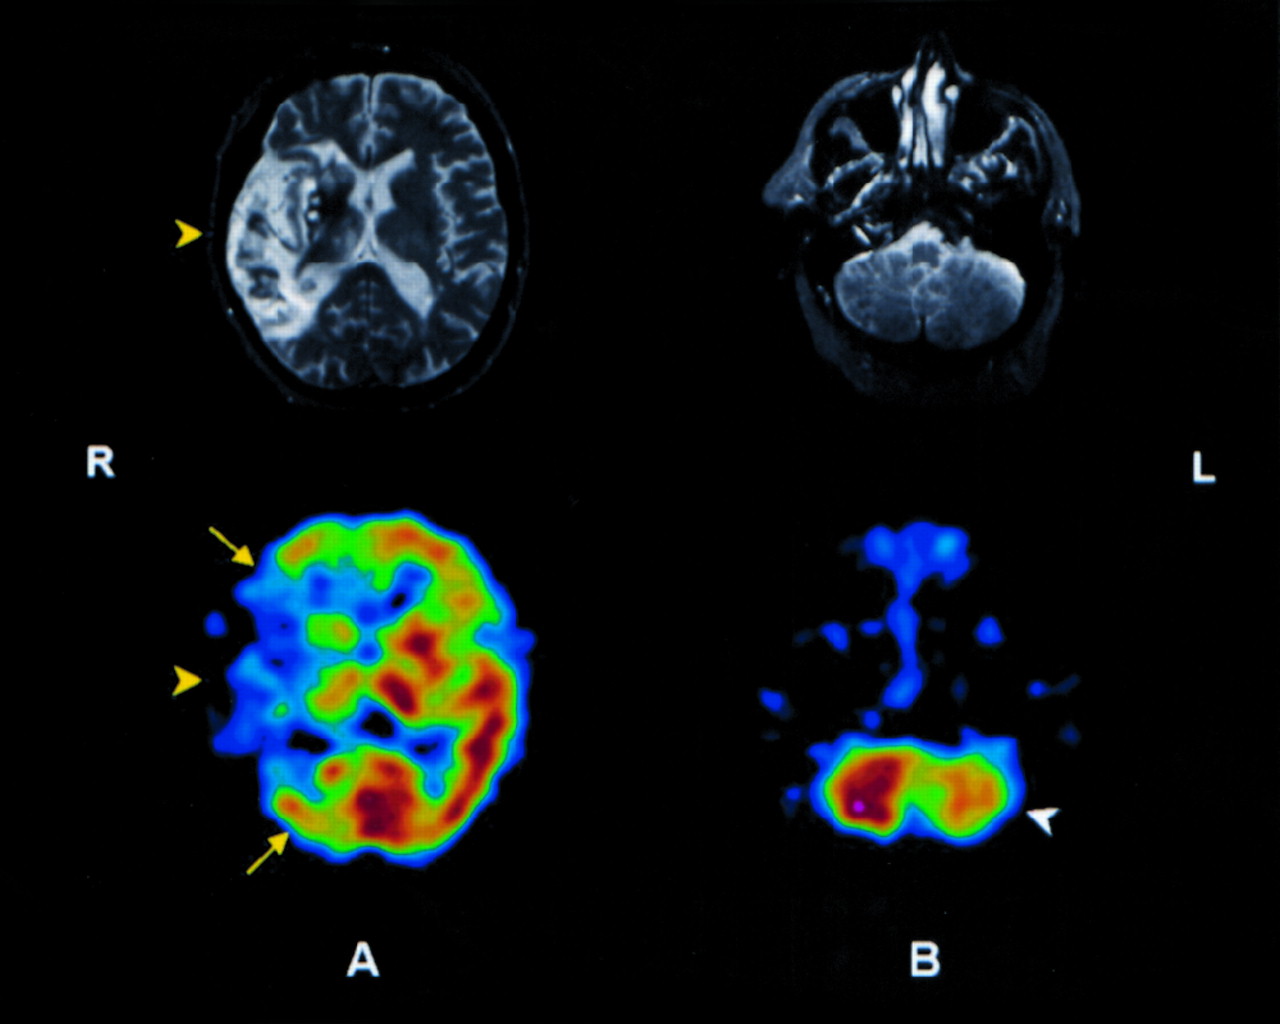
MRI (T2-weighted) (top) and 99mTc-HMPAO SPECT (bottom) slices at level of basal ganglia (A) and cerebellum (B) in patient presenting with right middle cerebral artery infarction. (A) SPECT image shows greater extension of ischemia than MRI (yellow arrows). (B) Anatomic representation of cerebellar hemispheres is normal, whereas decreased tracer uptake (hypoperfusion) is seen in left cerebellar hemisphere (white arrowhead) because of crossed corticocerebellar diaschisis.
Clinical Value in Therapeutic Management
Information derived from brain perfusion SPECT may influence therapeutic management. A well-documented example is the presurgical detection of the epileptic focus in patients with complex partial seizures refractory to medical treatment (13). A single area of hyperactivity in a cerebral region seen on ictal brain perfusion images (injecting the tracer during the seizure; technical details are discussed later) shows the epileptic focus with a high sensitivity and specificity (>95%) (14). The positive predictive value of early postictal SPECT (injecting the tracer immediately after the seizure) in localizing a unilateral focus is 97% (15). By contrast, interictal SPECT images may show hypoactivity in the epileptic focus or may fail to identify any perfusion abnormality (14). Thus, the performance of an ictal study is almost mandatory before surgery.
The potential of brain SPECT to influence therapeutic decisions appears clear in the planning of fibrinolytic therapy for stroke (16,17). SPECT allows detection of cerebral ischemia from the very beginning of the stroke. Fibrinolytic therapy must be implemented immediately after the onset of clinical symptoms, when no structural technique can reveal the extent and severity of ischemia. In this situation, brain perfusion SPECT patterns seem to forecast the outcomes of stroke patients (18) and thus could help in the selection of candidates for fibrinolytic therapy. The best candidates would be those patients presenting with an area of reduced tracer uptake (hypoperfusion) on the SPECT images, because a normal brain SPECT image implies a favorable prognosis as a result of effective collateral circulation. By contrast, an area with no tracer uptake (cold area) seems to be associated with hemorrhagic complications if fibrinolysis is implemented (16). A limitation of this approach is that the therapeutic decision must be made in the emergency room, and brain SPECT should be performed and reported between the first 3–6 h after stroke onset. Thus, clinical experience and planning of clinical trials have been limited for this application.
SPECT with vasodilator challenge (e.g., acetazolamide) has a unique value in helping clinicians select patients with carotid artery stenosis who are the best candidates for surgery (19,20). Cerebral hemodynamics cannot be predicted from the degree of carotid artery stenosis. The assessment of cerebrovascular reserve by acetazolamide brain SPECT has both therapeutic and prognostic implications. It is helpful for the identification of patients with compromised cerebral hemodynamics, who most probably would benefit from endarterectomy. Also, a higher risk of stroke has been reported in patients presenting with compromised cerebrovascular reserve, either before endarterectomy (21,22) or after bypass surgery (23). Finally, in patients who are difficult to explore neurologically (i.e., patients in a coma or under sedation, such as patients in intensive care units), SPECT can help in selecting a treatment directed toward cerebral perfusion maintenance (24,25).
Clinical Value in Follow-Up
Sequential SPECT images can reveal changes in regional cerebral perfusion over time (26), which may be helpful in follow-up management. SPECT is the technique of choice to monitor follow-up of functional abnormalities in anatomically preserved cerebral areas (Figs. 4 and 5). SPECT has also been reported to be useful in monitoring changes induced by specific medical, surgical (19,27,28), and neuroradiologic interventions (29,30). Brain SPECT has been reported to have prognostic value in cerebrovascular disease (16,18,31), head trauma (32–34), and other conditions (35,36). Longitudinal follow-up with SPECT may have an added value in the differential diagnosis of dementia, particularly when an initial perfusion SPECT is normal or does not offer useful information. Particular perfusion patterns may appear in subsequent SPECT scans (1–3,7,8).

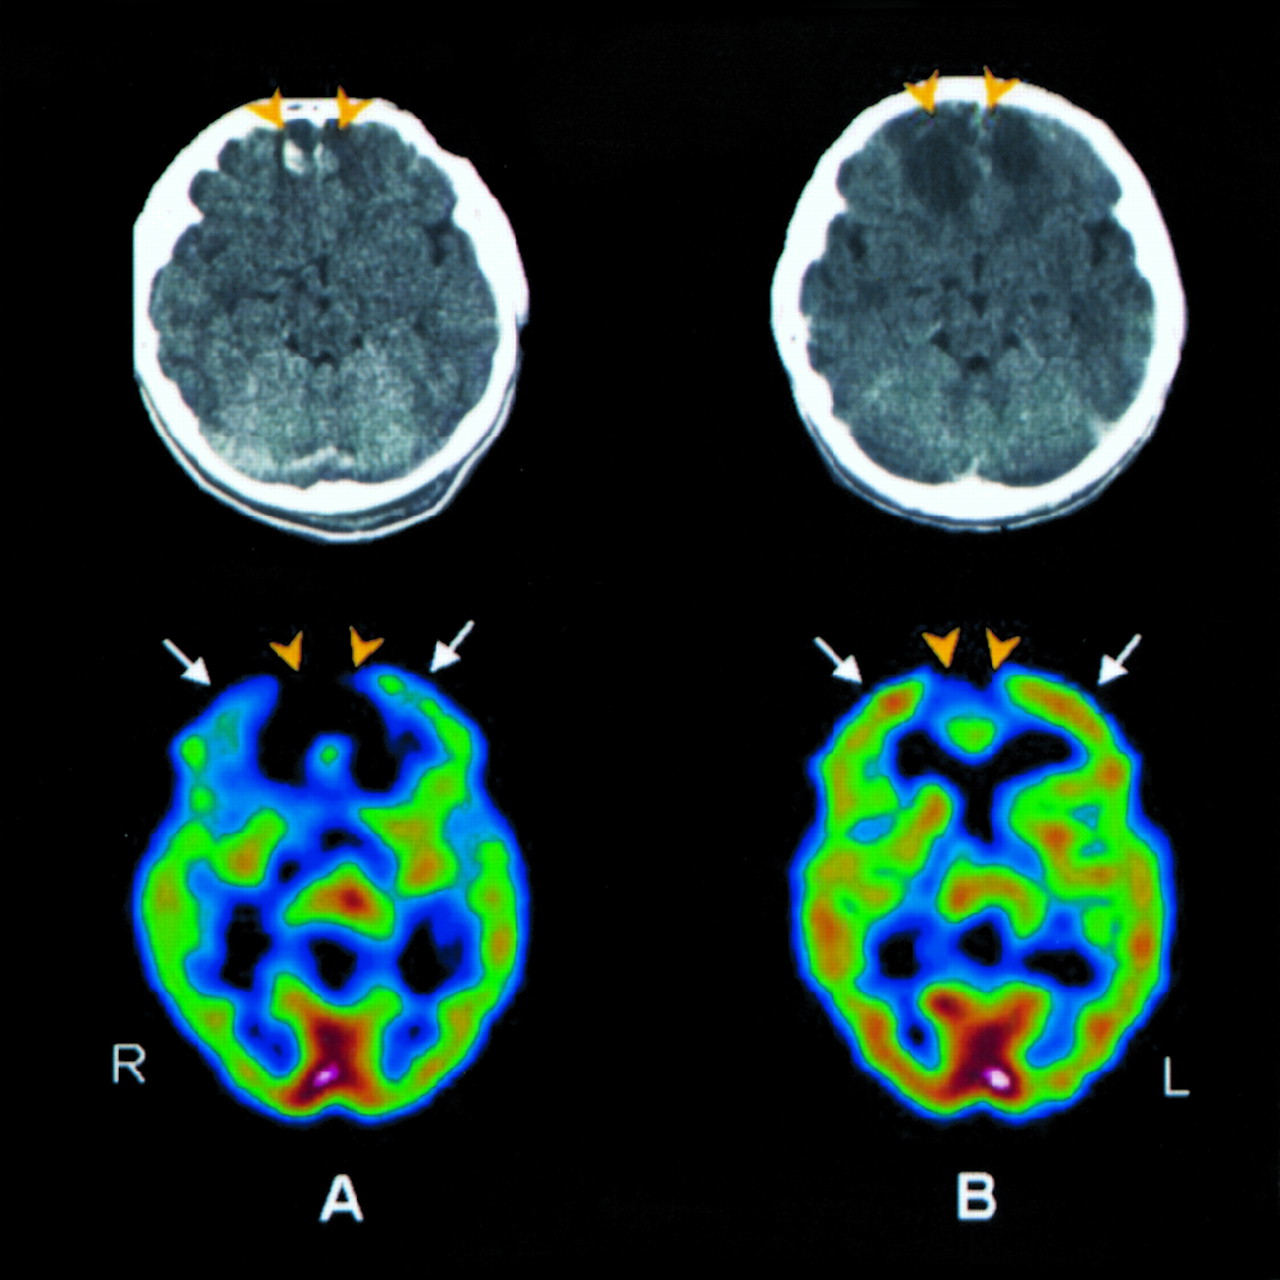
CT (top) and 99mTc-HMPAO SPECT (bottom) images from 16-y-old patient with traumatic brain injury after traffic accident. (A) CT at time of admission shows subarachnoid hemorrhage with small contusional hemorrhagic foci in both frontal lobes (orange arrowheads). Glasgow score was 12. During hospitalization, patient’s clinical status worsened, and Glasgow score decreased to 6. No changes were seen on CT scan. SPECT was subsequently performed and shows absence of tracer uptake (cold areas) in anteromedial aspect of both frontal lobes corresponding to hemorrhagic lesions, in addition to global hypoperfusion, more marked in both frontal cortices (white arrows). (B) CT and SPECT images obtained 1 mo later at time of discharge after clinical recovery. Hypodense images in both frontal lobes can be seen on CT as consequence of hematoma’s resolution. Corresponding cold areas persist on SPECT image (orange arrowheads) but show improvement in global cerebral perfusion, particularly in both frontal lobes (white arrows).
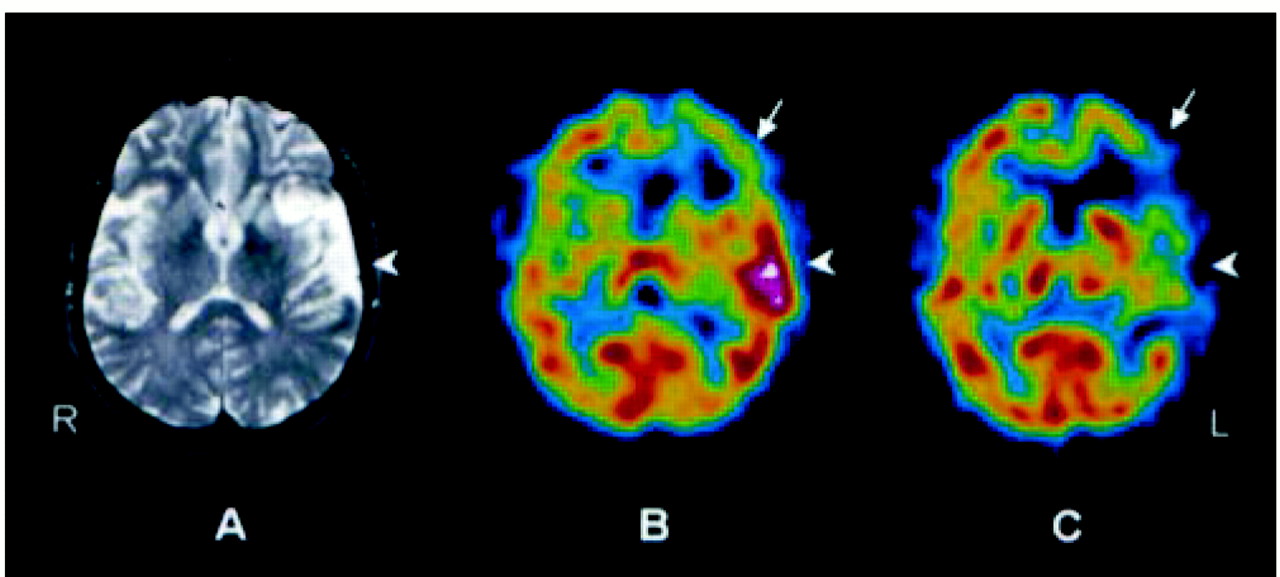
Left temporal lobe infarction in 62-y-old patient. (A) MRI (T2-weighted) at admission shows hyperintensity at site of infarction (arrowhead). (B) 99mTc-HMPAO SPECT image obtained 1 wk after stroke shows increased tracer uptake (hyperperfusion) in left temporal lobe caused by luxury perfusion (arrowhead). Hypoperfusion is also seen in left frontal cortex (arrow), intrepreted as ischemia in anatomically preserved region. (C) 99mTc-HMPAO SPECT image obtained 1 mo after stroke shows left temporal lobe hypoperfusion (arrowhead) corresponding to initial MR image of ischemia. Perfusion changes in left frontal lobe are also seen: improvement in anterior and mesial aspects caused by recovery of ischemia, as well as perfusion impairment in lateral aspect caused by extension of the infarction (arrow).
Value in Clinical Research
Brain perfusion SPECT contributes to the knowledge of the pathophysiologic basis of neurologic and psychiatric diseases (35,37–39). The ability of SPECT to detect regional cerebral blood flow (rCBF) variations in different conditions has favored the investigation of sensorial, motor, and cognitive activities (neuroactivation studies) (38–41) and the central effects of central nervous system (CNS) drugs (pharmacologic challenge) (37) in both the normal and the abnormal brain. In practice, visual evaluation of SPECT images alone is frequently limited in assessing subtle variations in regional tracer uptake, and quantification is thus required in clinical research. Results obtained in research studies are difficult to extrapolate to the clinical setting. Statistically significant differences in cerebral tracer uptake between groups are based on mean values, and mean differences are not always equivalent to individual differences. Large, well-designed, and controlled trials on brain SPECT imaging are necessary before research results can be applied in clinical practice.
PHYSIOLOGY OF THE BRAIN: A BASIS FOR UNDERSTANDING BRAIN PERFUSION SPECT IMAGES
The Brain: A Unique Organ
Special anatomic and functional features make the brain a unique organ, substantially different from the other organs of the human body. Most of these differences are encountered within the circulatory system, particularly in the regulation of perfusion and metabolism (Table 2).
Cerebral Requirements of Blood Flow and Metabolism
Intracranial arteries are different from arteries in the rest of the body. Because the skull protects against external pressures, vessel walls are thinner. No elastic fibers are found in the media, but a well-developed inner elastic membrane exists in the cerebral muscular arteries (42). The blood–brain barrier, consisting of special endothelial cells with tight junctions within brain capillaries, is a more striking difference. It regulates the entrance of high-molecular-weight and hydrophilic substances to the CNS. These substances are transported in the general blood pool and can easily reach other organs of the body, but not the brain (43).
The brain is the only organ with almost no energetic stock. Neuronal activity depends on the continuity of the supply of oxygen and glucose, which are provided by cerebral blood flow (CBF) (44). This dependence makes the brain the most sensitive and vulnerable organ to CBF variations. A lack of blood supply for only seconds leads to metabolic impairment, and, for more than 5 min, to irreversible neuronal damage. The brain vascular system has an autoregulatory mechanism to maintain CBF.
Finally, the functional consequence of a lesion in the brain depends not only on the severity or extension of the lesion, but also on its location. A small lesion in other organs such as the kidneys, lungs, or liver does not compromise their overall function. However, a very small lesion in specific brain structures can cause severe morbidity or even death, whereas larger lesions in relatively silent brain areas may cause only mild symptoms.
Perfusion and Metabolism Coupling: Detection of Neuronal Activity and Cerebral Function
Cerebral perfusion and metabolism are coupled in most physiologic and pathologic conditions, with a few exceptions such as subacute stroke or some brain tumors. In most conditions, adequate oxygen and glucose are provided to each cerebral region according to its metabolic need, which is determined by the intensity of neuronal activity. Hence, CBF is coupled to neuronal activity (44). Cerebral autoregulation controls an adequate oxygen and glucose supply in each cerebral region and involves a complex interplay of mediators and active neurohumoral substances that exert specific actions at a molecular level.
Classically, ions and metabolites such as potassium, hydrogen ions (H+), CO2, and adenosine, which are excreted to the extracellular space as a result of neuronal oxidative metabolism during increased neuronal activity, have been involved in the accompanying vasodilator response and related hyperemia (45,46).
Recently, other mediators have been identified as intrinsic endothelial factors that regulate the physiologic and pathophysiologic responses of cerebral circulation (45,47,48). Such mediators include:
Nitric oxide (NO): The highest levels of NO in the body are found in neurons. NO causes vasodilation by stimulating the activity of soluble guanylate cyclase within the vascular smooth muscle and elevating tissue levels of cyclic guanosine monophosphate (GMP) (49).
Calcium-activated potassium channels and potassium channels sensitive to adenosine 5′-triphosphate, using cyclic 3′,5′-adenosine monophosphate (cAMP) as a second messenger: Agents that increase the intracellular concentration of cAMP produce vasodilatation in part by activation of these channels (45).
Calcitonin gene-related peptide (CGRP), released from trigeminal perivascular sensory nerves in the brain. CGRP may limit noradrenaline-induced constriction of cerebral vessels and contribute to dilatation during hypotension, reactive hyperemia, and seizures (48).
This parallelism between CBF, metabolism, and neuronal activity (or cerebral function) is the basis for the use of brain perfusion SPECT in assessing cerebral function and, consequently, in detecting cerebral dysfunction. In the absence of cerebrovascular disease, hypoperfusion detected in SPECT images can thus be related to impaired cerebral function, and a hyperperfused area can be related to increased neuronal activity. The feasibility of the noninvasive study of neuronal activity in different cerebral regions under different conditions is the basis for interventional SPECT studies such as neuroactivation and pharmacologic challenges.
Autoregulation and Vasodilator Challenge: Insight into Cerebral Hemodynamics
Autoregulation is a mechanism that allows rCBF to remain constant under a wide range of regional cerebral perfusion pressure (rCPP) variations (50). In physiologic conditions, systemic arterial pressure determines rCPP, because cerebral venous back pressure is negligible. Conditions that affect either arterial inflow pressure or venous back pressure may alter rCPP globally (e.g., decreased systemic arterial pressure, increased intracranial pressure) or locally (e.g., local arterial occlusive disease, venous thrombosis). The main compensatory response depends on the ability of precapillary resistance vessels to react to rCPP variations. To maintain rCBF, pial arterioles vasoconstrict when rCPP increases and vasodilate when rCPP decreases. Intrinsic mechanisms involved in the ability of cerebral blood vessels to react to vasoactive stimuli were described in the previous section. Cerebral vasodilation can also be pharmacologically induced, a factor in the use of brain SPECT examinations with vasodilator challenge. Among the most-used vasodilator stimuli for this purpose are inhaled CO2 and intravenous vasodilator drugs such as acetazolamide (a carbonic anhydrase inhibitor) or adenosine. This modality of brain perfusion SPECT allows the assessment of the integrity of the cerebrovascular reserve and therefore of the autoregulation mechanism and cerebral hemodynamics (51).
Under normal conditions, such pharmacologic stimuli produce rCBF increases that can be detected by brain perfusion SPECT. However, under pathologic conditions leading to decreased rCPP, the ability of cerebral blood vessels to react to other vasoactive stimuli is impaired or even lost. For these conditions, a maximal vasodilation could be required to maintain CBF. In such cases, if rCPP continues to fall (between 60 and 30 mm Hg), the capacity for compensatory vasodilation is exceeded and autoregulation fails, causing rCBF to decrease. Initially, an increase in the oxygen extraction fraction can maintain cerebral oxygen metabolism, but further rCBF declines will result in decreased metabolism and function, and irreversible neuronal damage will occur (52). For these conditions, pharmacologic vasodilator stimuli fail to induce further vasodilation in the affected cerebral regions. Brain perfusion SPECT images would then reflect interhemispheric asymmetries caused by rCBF increases in preserved cerebral regions but minor or no rCBF increases in the affected regions. Brain perfusion SPECT with vasodilator challenge is therefore a feasible method to explore the integrity of the cerebral autoregulation mechanism, providing insight into cerebral hemodynamics.
TECHNICAL ASPECTS OF BRAIN PERFUSION SPECT: RADIOPHARMACEUTICALS, PATIENT PREPARATION, AND IMAGE ACQUISITION AND RECONSTRUCTION
Radiopharmaceuticals
Several radiopharmaceuticals are commercially available for brain perfusion SPECT (53). The selection of the radiopharmaceutical is important, because both the pharmacokinetic behavior of the compound and the physical characteristics of the isotopes influence the technical aspects. This situation is true from instrumentation to image interpretation and relates to the kind of quantitative approach used or to the type of interventional studies to be performed.
To quantify rCBF (mL/min/100 g tissue) by means of brain perfusion SPECT, the diffusible gas 133Xe is the best radiopharmaceutical choice. By measuring cerebral washout of the inhaled 133Xe, an absolute rCBF value is obtained (54). For this reason, 133Xe SPECT has been considered a standard for rCBF quantification. However, this radiopharmaceutical has several limitations that have restricted its use in clinical practice. First, because of the rapid clearance of 133Xe, the short acquisition time (around 5 min during the inhalation of the 133Xe gas) requires dynamic SPECT instrumentation, which provides high-sensitivity but low-resolution SPECT images. Second, the low γ-ray energy of 133Xe results in marked attenuation of deep structures, which makes this isotope less than optimal to obtain good-quality SPECT images. Finally, because 133Xe inhalation requires active cooperation, patients with respiratory or severe cognitive impairment may not be studied adequately.
Other brain SPECT tracers, such as 123I-labeled amines and technetium-labeled compounds, offer higher-resolution SPECT images after intravenous injection using conventional rotating gamma cameras. These tracers have found more acceptance, although they allow only quantitative estimations through tracer uptake ratios. The common biologic properties of these radiopharmaceuticals are the following: ability to cross the intact blood–brain barrier (small molecular size, lipophilic, and neutral); distribution in the brain proportional to blood flow (this property is assessed by correspondence to the distribution of reference perfusion tracers such as iodoantipyrine or microspheres); retention in the brain with a fixed regional distribution for a sufficient time to permit image acquisition (20–30 min); sufficient uptake in the brain to allow imaging with standard SPECT instrumentation; rapid washout from background tissues (facial and glandular tissue, blood); and high gray-matter–to–white-matter uptake ratio to yield a good image definition (55).
Among the initially used 123I-labeled amines, 123I-isopropyliodoamphetamine ([123I-IMP] IK-3; CIS Bio-International, Gif-Sur-Yvette, France) has been the most frequently used (56). After crossing the intact blood–brain barrier, 123I-IMP binds to amphetamine receptors on neurons. This radiopharmaceutical has good characteristics for brain perfusion SPECT (57). However, its peak brain activity is reached as late as 20 min after injection, and it shows redistribution over time; that is, there is reuptake by the cerebral cortex that is not proportional to blood flow (57,58). These latter characteristics, in addition to the high cost and poor availability of 123I-labeled compounds, have contributed to the current predominant use of technetium compounds for brain perfusion SPECT examinations.
Two 99mTc-labeled radiopharmaceuticals are available: hexamethylpropyleneamine oxime ([99mTc-HMPAO] Ceretec; Nycomed-Amersham, Little Chalfont, U.K.) and ethylcysteinate dimer ([99mTc-ECD] bicisate, Neurolite; Dupont-Pharma, Stevenage, U.K.). Their pharmacokinetic characteristics are summarized in Table 3 (55,59). These compounds have several advantages over 123I-IMP. The peak brain activity is reached faster (within 2 min after injection), and there is no redistribution, so the initial tracer uptake and distribution, which are proportional to rCBF at the time of injection, remain unchanged up to at least 2 h, independent of rCBF variations occurring after the fixation time. This property of quick uptake and prolonged stability allows for so-called frozen or shoot images and makes interventional SPECT studies clearly feasible. The tracer is injected while the subject is performing a specific task or at the moment of maximum central effect of a drug, so that SPECT images reflect the rCBF distribution at the time of injection, independent of the timing of SPECT acquisition. Thus, the tracer can be injected into the patient outside the nuclear medicine facility, and images can be acquired later. This procedure is generally not possible using PET or MRI, because patients must stay positioned in the device with the head fixed while performing tasks to allow simultaneous image acquisition.
Parmacokinetics of Technetium Radiopharmaceuticals for Brain Perfusion SPECT
The main differences between HMPAO and ECD relate to their in vitro stability, uptake mechanism, and dosimetry (55,59–61). HMPAO is highly unstable in vitro. Moreover, a high radiochemical purity must be assured before injection, because only a small proportion of the injected dose will reach the brain (Table 3). This purity is not difficult to achieve if the timing of the labeling process is done properly, as follows (62): time since the last generator elution < 24 h; time since the 99mTc dose was eluted < 2 h; and time since the cold vial was labeled with fresh 99mTc < 20 min. Another recommendation is to avoid the mixture of 99mTc-HMPAO with blood during intravenous injection, because the lipophylic compound enters into red blood cells. Stabilized forms of 99mTc-HMPAO using either methylene blue or cobalt chloride have recently become available and allow easier labeling and improvement of image quality by reducing background activity (63). By contrast, ECD is stable up to at least 4 h in vitro, and freshly eluted 99mTc is not required. However, the labeling procedure is longer, taking about 30 min.
The rapid urinary excretion of ECD favors its dosimetry, so high doses can be administered. The dosimetry is similar to lower doses of HMPAO if patients are instructed to force diuresis and void after the scan procedure. The use of higher doses, together with the higher gray-matter–to–white-matter ratio, contributes to the better image quality obtained with ECD in comparison with HMPAO.
Although both HMPAO and ECD are distributed proportionally to rCBF, their retention is not completely linear with rCBF because of an initial backdiffusion. High blood flow may be underestimated and low blood flow may be overestimated with both tracers (64,65).
In normal brain tissue, the kinetic properties are similar for both perfusion agents. They enter the brain cells because of their lipophilic nature and remain there because of conversion into hydrophilic compounds. However, in patients with brain disease, the distribution of these compounds may differ because of the biochemistry of lipophilic-to-hydrophilic conversion. Although a metabolic process of de-esterification accounts for ECD hydrophilic conversion, an instability of the lipophilic form and glutation interaction have been proposed for HMPAO. Thus, ECD would have a predominant cellular–metabolic uptake, and HMPAO would reflect blood flow arrival to cerebral regions. This situation accounts for slight differences in the normal SPECT pattern (66), and it is one of the explanations suggested for the different behavior of these tracers in subacute stroke. For cerebral perfusion–metabolic uncoupling, increased HMPAO uptake may occur, thus reflecting the luxury perfusion phenomenon (Fig. 5), whereas ECD uptake remains low, reflecting hypometabolism at the site of ischemia (67).
Patient Preparation
Three things must be considered regarding patient preparation for brain perfusion SPECT: environmental conditions, patient cooperation, and patient positioning.
Because of the sensitivity of brain perfusion SPECT in detecting rCBF changes coupled with neuronal activity, sensorial and cognitive stimuli must be kept at a minimum level during tracer injection and uptake. Injection in a quiet room and no interaction with patients at this time is desirable. For each patient, the room conditions should be consistent during tracer injection and uptake. If the patient’s eyes are open in a bright room during injection, a high tracer uptake in the calcarine cortex is an expected SPECT pattern. On the other hand, if the patient’s eyes are closed in a dimly lit room during injection, a low tracer uptake in the calcarine cortex is found. These injecting conditions should be well recorded and considered in the evaluation of the SPECT images.
Patient cooperation is of particular importance. To avoid head movement during scanning (20–30 min), the patient should be comfortable. Bladder voiding, a pad under the knees, and a blanket (the temperature is usually low in scanning rooms) are measures that would comfort and relax patients during the scan and help them to cooperate. Patients with severe cognitive impairment or dementia may need sedation. If a technetium radiopharmaceutical (HMPAO or ECD) is used, tracer injection must precede sedation to avoid sedation-induced metabolism/blood flow changes in the SPECT images. In uncooperative children, sedation is not recommended until other strategies to facilitate sleep during the scan procedure have been exhausted. These include instructing parents to keep the child very active during the previous hours and to feed the child after tracer injection, just before image acquisition. If sedation remains the only alternative, the same procedure described for adults has to be followed.
Patient positioning largely contributes to the final quality of SPECT images. As explained, keeping the patient comfortable helps to avoid movement artifacts. Excluding shoulders from the field of view allows keeping the radius of rotation to a minimum, thus maintaining the collimators as close as possible to the patient’s head. Belts at the forearm level help to hold the patient’s arms if the imaging bed is narrow. Keeping the head at flexion helps to reduce the radius of rotation. Lowering the chin to the chest helps to include the entire cerebellum within the field of view and allows a better reorientation plane for oblique slices during reconstruction.
For interventional SPECT studies, patients should be informed about the procedure and possible secondary effects. If pharmacologic intervention is required, written informed consent is advisable.
Practical Guides on Instrumentation and Image Acquisition and Reconstruction
Brain perfusion SPECT is a technically demanding procedure. The earlier sections described how selection of the radiopharmaceutical or patient preparation can influence the final result of the procedure. Instrumentation and selection of adequate parameters for SPECT acquisition and reconstruction also play critical roles in the quality of the SPECT images (68,69).
Because of the small size of important anatomically and functionally independent cerebral structures, spatial resolution is the main concern in brain imaging. In principle, high-resolution equipment is recommended for brain SPECT. However, high-resolution dedicated cameras are not widely available. A good compromise is to fit a general-purpose rotating camera with fanbeam collimators. SPECT information can also be obtained using standard rotating gamma cameras fitted with parallel-hole, high-resolution collimators, if this is all that is available. Finally, even with the most advanced equipment, the study cannot be optimal without appropriate quality control of the instruments (70).
Regarding image acquisition and reconstruction, the main rule is to achieve a balance between detection sensitivity (i.e., number of total counts acquired) and spatial resolution. These parameters are influenced by dose, type of collimator, pixel size, acquisition time, number of projections, and filtering (71).
Although high doses will increase detection sensitivity, dose is limited by safety rules. It is advisable to inject the highest permitted dose to ensure enough photon flux.
A high-resolution collimator is recommended for brain SPECT, provided that enough total counts per study are guaranteed and at least a 128 × 128 matrix is chosen. A low counting rate would require a smoother filtering during reconstruction, which would result in loss of spatial resolution. The same contradictory effect would occur if a 64 × 64 matrix is used with a high-resolution collimator.
The matrix and pixel size should be assessed on each specific SPECT device. The pixel size can be calculated by dividing the useful field of view of the camera by the matrix size. The matrix size chosen must provide a pixel size less than half the spatial resolution of the final image. For example, if the final resolution of brain SPECT slices is 10 mm, the matrix size should be chosen to give a pixel size of 5 mm or less.
Another factor to consider is the duration of the acquisition process. Logically, a longer acquisition time will yield a higher number of total counts and better quality of the final images. However, long acquisition times increase the risk of patient motion, which will degrade the images.
A particular rule that can be followed regarding the number of projections is to keep it close to the number of pixels in the matrix. A higher number of projections will yield minimal reconstruction benefits, and a lower number of projections will cause reconstruction artifacts. For example, the best choice for a 128 × 128 matrix is one projection for each 3° in a 360° orbit for a total of 120 projections. On the other hand, for a 64 × 64 matrix, the best choice is one projection for each 6° in a 360° orbit for a total of 60 projections.
During reconstruction, attenuation correction should be performed except when special devices that intrinsically correct attenuation, such as fanbeam collimators or transmission attenuation correction systems, are used. Filtering is another step to carefully consider during SPECT reconstruction, because the resulting image may vary substantially, depending on the filter applied. The diversity in type of filters and filter parameters that can be applied cannot be covered in depth in this article; concrete guidance can be found elsewhere (69,71). In simple terms, application of a smoothing filter will reduce the final resolution; thus, it would not be sensible to use a high-resolution SPECT device and then lose resolution by applying a smoothing filter to the acquired images. On the contrary, a very sharp filter will result in noisy images. The number of final counts in the study can be a guide for the best filter to apply. Sharp filters can be applied when a high number of total counts has been achieved, whereas low total counts require a smoother filter. It is advisable to select the appropriate filter for each study. However, this process may not always be easy to implement, depending on the software packages used. An acceptable solution is to have three or four predefined filters for different ranges of total counts.
Another important process performed during SPECT image reconstruction is the orientation of the slicing planes. There is no consensus on the best reference to orientate slices in the transaxial plane. To be able to carefully compare SPECT images to structural images, a similar orientation to that provided by CT, which is the canthomeatal plane, is the most popular. However, brain perfusion SPECT images lack bone references, and therefore it is not possible to accurately find the cantomeatal line for orientation. Hence, a reference plane that could be identified easily in the perfusion SPECT images would be preferable to be consistent with the orientation and to reproduce the same orientation plane. A similar orientation to the canthomeatal line for oblique brain SPECT slices can be achieved by a line passing through the base of the frontal and occipital lobes (fronto-occipital plane). Nevertheless, other orientations are also frequently used, such as the frontocerebellar plane. Apart from the classical oblique, coronal, and sagittal slices, slices parallel to the longitudinal edge of the temporal lobe can be obtained. These temporal slices are particularly useful when clear differentiation between the mesial and lateral aspects of the temporal lobe is required. Some examples are temporal lobe epilepsy or the initial stages of dementia of Alzheimer’s type.
For the display of final SPECT images, the choice of black-and-white or color display is arbitrary. However, discontinuous multicolor scales may overestimate defects or interhemispheric asymmetries. A method for normalizing the images should be followed consistently. In our institution, the maximum pixel count in the oblique slices is used for normalization (35). Regardless of the method used, it should be consistent for representation of the final images, and subjective manipulation should be avoided.
SPECIFIC SITUATIONS: QUANTIFICATION AND INTERVENTIONAL STUDIES
Quantification
The absolute quantification of rCBF (mL/min/100 g tissue) using SPECT is possible by measuring cerebral washout of the inhaled 133Xe, as discussed earlier. An accurate method has been sought for measuring absolute rCBF values using 99mTc tracers. Such procedures require additional invasive or technically demanding steps (e.g., arterial blood sampling or dynamic SPECT acquisition), thus increasing the complexity of performance of the SPECT (72,73). Hence, absolute rCBF measurement using SPECT has not been fully implemented, and the region of interest (ROI) analysis of rCBF has become the preferred method of quantification. This SPECT quantification method, which has been called semiquantification, is based on the calculation of tracer uptake ratios in different cerebral regions and allows an estimation of the relative rCBF distribution within the brain. Region/reference ratios can be obtained from the average counts per pixel of ROIs drawn and placed on different cerebral areas. The left-to-right ratio of the same cerebral region or asymmetry indices are used to enhance left/right rCBF differences (74). Despite the simplicity of the concept, the laborious and time-consuming process of generating a high number of ROIs and ratios, as well as problems concerning ROI design and selection of the reference region for uptake ratios, complicates brain SPECT quantification.
ROIs can be geometric (regular ROIs) and placed on given cerebral territories, or they can delineate anatomic structures (irregular ROIs). They can also be specifically designed to fit cerebrovascular territories. Irregular anatomic ROIs or ROIs specifically designed for each study purpose work better in detecting suspected abnormalities. However, drawing the same ROIs and placing them in exactly the same cerebral areas is a time-consuming process and requires special dedication. If this process is not followed carefully, reproducibility will be limited. Coregistration of structural neuroimaging slices, or superpositioning to a stereotactic atlas, can definitely improve ROI positioning, therefore reducing inter- and intraobserver variability and increasing reproducibility of these semiquantitative approaches.
The selection of the reference region is crucial in the calculation of region-to-reference uptake ratios. The whole brain and the cerebellum are the most common references used, but they do not always represent the best choice because the reference region must have anatomic and functional integrity (75). The choice of the whole brain as a reference may be misleading. If a relative rCBF impairment in a cerebral region does exist, it will influence the calculation of the whole-brain average counts per pixel value, and this reference value can be substantially different from one subject to another. Similarly, when a cerebellar involvement has been described or is indeed present, a region-to-cerebellum ratio is not suitable. For these patients, another preserved cerebral region should be used as a reference. In general, differences in ratios and the design of the ROIs will vary, depending on the purpose of each study.
In the search for more standardized and objective alternatives for brain perfusion SPECT quantification, circumferential profiles and polar maps have been proposed with limited success (76,77). Software programs allowing statistical comparison of different groups of subjects, such as the statistical parametric mapping (SPM) package, are being used mainly for research purposes. SPM offers clear advantages for PET examinations, but this approach appears limited for SPECT because of the lower spatial resolution (78).
Brain perfusion SPECT quantification in the clinical management of patients should be encouraged when comparison is required among SPECT studies performed on the same subject at different times. This situation occurs when patients are followed up in search of rCBF modifications or when an interventional study is performed (e.g., neuroactivation or pharmacologic intervention). In these situations, quantitative data help to objectively report the degree of rCBF changes and support visual impressions.
Interventional SPECT Studies
Interventional SPECT is the study of rCBF changes induced by specific sensorial, motor, or cognitive stimuli (neuroactivation) or by specific drugs (pharmacologic intervention). Other SPECT studies that could be considered interventional are those in which it is desired to capture a specific clinical feature with SPECT imaging. In these studies, a tracer is injected when the specific clinical symptom appears. For example, the tracer is injected during the seizure in patients with epilepsy. The pathophysiology of positive symptoms in schizophrenic patients can be investigated if the tracer is injected when the patient is experiencing specific symptoms, for example, auditory hallucinations. The central effect induced by some therapeutic or diagnostic procedures, such as electroconvulsive therapy or transcranial magnetic stimulation, has also been investigated by SPECT using this approach.
Interventional SPECT studies require the performance of at least two SPECT scans: one under baseline conditions and the other during the task or under a pharmacologic effect. For proper comparison of these two studies, quantification or subtraction techniques are used on slices reconstructed identically. Reference test–retest values in normal subjects should be available for interpreting quantitative results (i.e., percentage of rCBF changes) to recognize the percentage variation between two SPECT studies on the same subject under the same baseline conditions (37). These two studies may be performed on separate days or on the same day using the split-dose technique. When the two SPECT studies are compared, obtaining the identical tomographic slices may be a problem, which has been addressed by software for three-dimensional realignment (79). The split-dose technique, which refers to baseline and interventional SPECTs in the same session, may help to overcome this problem (80,81). The administered dose for the first SPECT must be at least half of the second. Patients stay positioned in the camera until the second SPECT ends, and neither patient repositioning nor software realignment is required. However, other technical issues, such as corrections for decay and injected dose, need to be addressed. Moreover, the longer acquisition time increases the risk for patient motion, that is, for image artifacts. The SPM software, mostly used in research, considers realignment and makes statistical comparisons between two groups of subjects. The results are elegantly displayed on a reference MRI or brain surface atlas image (78).
Neuroactivation SPECT has been used successfully to study sensorial, motor, and cognitive functions (38–41). The tracer is injected while the subject is engaged in a task, which should be continued until tracer fixation in the brain is complete (at least 3–5 min). Tasks should be carefully selected, because no other cerebral activity than the target one is desirable. Cognitive tasks represent a major difficulty to overcome. The performance of a control task would be preferable to a baseline “rest” condition. The task should involve the same parameters as the test task but without the cognitive function. For example, when using the Wisconsin Card Sorting Test as a cognitive task, an acceptable control task could be to match the cards with no criteria. Neuroactivation is a common approach in research SPECT studies. By contrast, neuroactivation SPECT is not widely used in the clinical setting, most probably because of the technical demands, although it has been reported to be useful in the differential diagnosis of dementia.
Brain perfusion SPECT can also be performed during pharmacologic interventions. For this purpose, a tracer is injected at the expected time of maximum CNS drug effect. The most popular pharmacologic intervention that has clinical relevance is the acetazolamide SPECT for the study of cerebrovascular reserve (32). Brain perfusion SPECT is also useful in showing the distribution and effect of intracarotid amobarbital during the Wada test used for presurgical evaluation of epileptic patients (82–84). Pharmacologic intervention SPECT has been used to investigate the effect of different drugs on the CNS.
The methodology of ictal SPECT in patients with refractory complex partial seizures requires special attention. The clinical indication of this procedure is to identify the lateralization and localization of an epileptic focus before surgery. If patients are hospitalized in an epilepsy unit and monitored by video-electroencephalography (video-EEG), injecting the perfusion tracer during a seizure is possible. The technologist in charge of the video-EEG monitoring should be trained in handling radiopharmaceuticals. If the chosen tracer is HMPAO, a cold vial and the corresponding freshly eluted 99mTc dose in a separate syringe should be provided to the video-EEG technologist. The 99mTc dose should be replaced every 2 h if no seizures have appeared. At the very beginning of seizure activity, as shown by the video-EEG, the technologist labels the cold vial with the fresh 99mTc and immediately injects it into the patient through an intravenous line. Using stabilized 99mTc-HMPAO or ECD, labeled vials can be provided and replaced every 4–6 h. Patients can be scanned in the nuclear medicine department after recovering from the seizure. The same procedure can be used when waiting for a patient’s particular symptom or another event to be imaged (85).
INTERPRETING AND REPORTING IMAGES
The brain is not composed of uniform tissue, and one must be trained to recognize the normal perfusion pattern. Perfusion patterns may differ from one subject to another, because the normal brain is not always completely symmetric, and small structural differences are frequent within normal subjects. Differences may be found between hemispheres, between subjects, and to a lesser extent within the same healthy subject scanned twice under the same conditions (test–retest). This result is partly caused by variations in functional activity and therefore by a varying vascular supply to cerebral regions at the time of injection. As mentioned previously, the radiopharmaceutical used and the patient and environmental conditions during tracer injection must be considered.
In a normal brain perfusion SPECT image (74), regions with higher perfusion, such as cortical and subcortical gray-matter structures, have the highest tracer uptake. Subcortical white matter shows low tracer uptake, and no tracer uptake is seen in areas containing cerebrospinal fluid (i.e., cerebral ventricles, fissures, and sulcus) or bone (i.e., scalp or petrous part of temporal bones). The cerebral region showing the maximum tracer uptake varies with the radiopharmaceutical used (i.e., most probably the cerebellum with HMPAO, but the calcarine cortex with ECD), the patient’s condition at the time of injection (e.g., influence of visual activity on calcarine cortex uptake), and image manipulation during reconstruction (i.e., influence of attenuation correction on basal ganglia activity).
The appropriate brain perfusion SPECT interpretation should be made using a step-by-step approach, such as the following:
Select a set of slices to use as a basis for identification of the SPECT perfusion pattern. It is advisable to start with the transaxial or oblique fronto-occipital slices. The other sets of slices will be of further help for confirmation, localization, and extension of findings.
Anatomically identify the cerebral structures within the range of precision that spatial resolution of the images allows. A good exercise to precisely recognize cerebral lobes on SPECT images is the identification of cissures separating them, using an atlas as a guide.
Follow the same regional order of perfusion assessment, including all cerebral regions. For example, first assess the cortical regions from bottom to top: cerebellum, temporal lobes, frontal lobes (orbitofrontal, prefrontal, and superior frontal areas), occipital lobes, and parietal lobes. Mesial and lateral aspects of these regions should be evaluated separately. Second, assess brain stem and subcortical regions (striatum, thalamus, and white matter).
Assess global and regional tracer uptake and distribution (normal distribution vs. identification of perfusion abnormalities).
4.1. Identify brain perfusion abnormalities. A good practice is to check for marked asymmetries between hemispheres (keep in mind that a normal brain may display some asymmetry). For inadequate reorientation of the SPECT study, asymmetries caused by head tilts may be present, which can be easily identified because the pattern is reversed on consecutive slices.
4.2. Compare functional SPECT images to anatomic CT or MRI. For example, because of the slight difference in uptake between periventricular white matter and lateral ventricles, it is difficult to differentiate these two structures on SPECT images. For marked hypoactivity of these regions, comparison with anatomic imaging will clarify if the pattern is caused by hydrocephalia or if it could be attributable to white-matter ischemia (in the latter case, anatomic images may be normal).
4.3. In patients with cerebral atrophy, look for the absence of uptake in cerebrospinal fluid and normal uptake in the cortex. These conditions may coexist within the same pixel, resulting in a false appearance of decreased uptake in the cerebral cortex. Although indirect signs of cerebral atrophy can be identified in the SPECT images, such as a marked separation between hemispheres caused by interhemispheric cissure enlargement, and between basal ganglia caused by ventricular enlargement (Fig. 1), anatomic imaging is required to confirm this result. It is difficult to be sure if hypofunction coexists in regions with atrophy unless the image analyzing software provides atrophy correction.
Characterize perfusion abnormalities.
5.1. Recognize abnormalities in brain perfusion SPECT images such as decreased tracer uptake (hypoperfusion) (Figs. 2, 3, and 5), absence of tracer uptake (no perfusion) (Fig. 4), and increased tracer uptake (hyperperfusion) (Fig. 5). The most frequent causes of these uptake patterns are summarized in Table 4 . The etiology of hypo- and hyperperfusion can be purely vascular or related to cerebral dysfunction, as described previously. Knowledge of both the clinical context and anatomic images of patients is essential for interpreting uptake abnormalities.
5.2. Recognize the distribution patterns of perfusion abnormalities such as vascular territories and eventual diaschisis patterns, dementia patterns, temporal lobe localization of epileptic foci, or herpetic encephalitis. This information often provides valuable clues for the etiology.
Frequent Causes of Different Tracer Uptake Patterns in Brain Perfusion SPECT Images
The report of brain perfusion SPECT must be concise and reader friendly and may consist of three main sections:
Heading: The report’s heading should include the radiopharmaceutical used and a summary of the clinical problem or indication of the study. When relevant, other factors known to influence perfusion SPECT images, such as patient and environmental conditions during tracer injection or possible technical pitfalls, should be included.
Description of findings: This part constitutes the body of the report and should include detailed information on localization, type of abnormality (cold, hypo- or hyperperfusion), and extension and severity of the perfusion abnormality. Comparison of SPECT with CT and MRI findings should also be added.
Interpretation of SPECT findings and conclusion: If the SPECT indication fits within a well-recognized clinical application (i.e., dementia, epilepsy, or stroke), an accurate interpretation statement leading to a diagnosis can be provided. However, extreme caution must be applied when the role of brain perfusion SPECT in the referred clinical problem has not been studied in depth or is unknown, as occurs in behavioral disorders. In these cases, the nonspecificity of the technique and lack of consistent evidence of cause and effect need to be acknowledged in the report (86).
CONCLUSION
Brain perfusion SPECT has well-recognized clinical applications mainly in dementia, cerebrovascular disease, and epilepsy. This technique generally adds valuable information to the clinical management of patients with brain disorders of a broad variety, helping in diagnosis, therapeutic management, and follow-up. Accurate knowledge of the physiologic and pathophysiologic basis of brain perfusion SPECT, together with the appropriate technique and careful interpretation of images and reporting, will enhance the clinical use of brain SPECT. Anatomic and functional correlations, as well as close interaction with the referring clinician, are additional practices of crucial importance in fully exploiting brain perfusion SPECT capabilities in clinical practice.
Acknowledgments
The author wishes to acknowledge Prof. Ignasi Carrió, MD (Hospital Sant Pau, Barcelona, Spain) for his valuable contribution, Juan Carlos Martin, MD (Hospital Sant Pau) for his help in preparing the figures, and Semih Dogan, MD, and Julia Buchanan (Johns Hopkins Medical Institutions, Baltimore, MD) for their help in editing the manuscript.
Footnotes
Received May 10, 2000; revision accepted Sep. 12, 2000.
For correspondence or reprints contact: Ana M. Catafau, MD, Medicina Nuclear, Hospital Sant Pau, Pare Claret, 167, 08025-Barcelona, Spain.
NOTE: FOR CE CREDIT, YOU CAN ACCESS THIS ACTIVITY THROUGH THE SNM WEB SITE (http://www.snm.org) UNTIL AUGUST 2001.
REFERENCES
In this issue


Jump to section
- Article
- Abstract
- CLINICAL VALUE OF BRAIN PERFUSION SPECT
- PHYSIOLOGY OF THE BRAIN: A BASIS FOR UNDERSTANDING BRAIN PERFUSION SPECT IMAGES
- TECHNICAL ASPECTS OF BRAIN PERFUSION SPECT: RADIOPHARMACEUTICALS, PATIENT PREPARATION, AND IMAGE ACQUISITION AND RECONSTRUCTION
- SPECIFIC SITUATIONS: QUANTIFICATION AND INTERVENTIONAL STUDIES
- INTERPRETING AND REPORTING IMAGES
- CONCLUSION
- Acknowledgments
- Footnotes
- REFERENCES
- Figures & Data
- Info & Metrics
Related Articles
Cited By...
- Cerebral blood perfusion across biological systems and the human lifespan
- Differential Lung Uptake of 99mTc-Hexamethylpropyleneamine Oxime and 99mTc-Duramycin in the Chronic Hyperoxia Rat Model
- SPECT imaging in dementia
- Hemodynamic changes in limb shaking TIA associated with anterior cerebral artery stenosis
- Second Harmonic Imaging of the Human Brain: The Practicability of Coronal Insonation Planes and Alternative Perfusion Parameters
- Brain SPECT in Neurology and Psychiatry