


Abstract
This study evaluated the diagnostic accuracy of case-based reasoning (CBR) to automatically detect significant coronary artery disease from dipyridamole 201Tl myocardial SPECT perfusion scintigrams. Methods: The study population included 240 patients (182 men, 58 women; mean age ± SD, 61 ± 12 y) on whom coronary angiography and perfusion scintigraphy were performed within 6 ± 11 d of each other. The patients were divided into two groups according to the presence or absence of significant coronary disease in any major coronary vessel. Regional myocardial tracer uptake was observed in 84 segments by polar map analysis. For each scintigraphic image, a CBR algorithm based on a similarity metric was used to identify similar scintigraphic images within the case library. The angiographic results of these similar cases were used to obtain the CBR reading, which was compared with the true angiographic results. Myocardial scintigrams were also analyzed by a first-generation Cedars-Sinai (CS) method, including a comparison with a reference database, and by the visual analysis of an expert reader. Results: By receiver-operating-characteristic analysis, the diagnostic accuracy of CBR was not different from the interpretation by the CS algorithm and from visual interpretation (P = not significant [NS]). For detection of significant coronary disease, the respective sensitivities at 50% and 80% specificity were 90% and 67% for CBR, 88% and 65% for CS polar map analysis, and 91% and 74% for visual interpretation. For the detection of coronary disease in the vascular territories assigned to the left anterior descending and the right coronary arteries, CBR and CS polar map analysis showed similar diagnostic accuracy (P = NS). However, for detection of disease in the circumflex artery, CS polar map analysis was slightly better than CBR (P = 0.03). Conclusion: Automated interpretation of dipyridamole 201Tl myocardial SPECT perfusion images by CBR has diagnostic accuracy similar to that of visual interpretation or CS analysis. Thus, use of a case library that includes a variety of normal and abnormal perfusion images does not appear to have greater diagnostic power than use of reference limits.
Myocardial 201Tl SPECT perfusion scintigraphy is an established noninvasive method for the functional assessment of coronary artery disease. Visual interpretation of perfusion scintigrams requires experienced readers and is associated with interobserver variability. Thus, computer-based methods have been developed that support decisions with quantitative image analysis (1–4). Polar map analysis and comparison with a database of reference values based on the Cedars-Sinai (CS) protocol (2,5) are widely used to assess perfusion abnormalities quantitatively. Although high diagnostic sensitivities and normalcy rates of 80%–90% have been reported for polar map analysis using the CS reference database, a low specificity (∼50%) has raised some concerns about its clinical use.
In recent years, methods of artificial intelligence such as case-based reasoning (CBR) (6) and neural networks (7–9) have improved the diagnostic accuracy of automated interpretation of myocardial perfusion images. These methods use the individual diagnostic information of both normal and abnormal images of a case library and thus can potentially offer better diagnostic accuracy than does polar map analysis using a database of reference limits that have been derived by statistical analysis.
This study evaluated and compared the diagnostic accuracy of automated assessment of myocardial perfusion scintigraphy by CBR, polar map analysis including a comparison with the CS reference database, and visual interpretation by an experienced observer for a large patient population, with coronary angiography as the reference standard to prove or exclude significant coronary disease.
MATERIALS AND METHODS
Patient Population
A retrospective search of the database at our department initially identified 1,866 patients who had undergone both coronary angiography and myocardial perfusion scintigraphy. From this group, patients were excluded if they had been studied by an imaging protocol other than dipyridamole 201Tl imaging, had been referred for evaluation of myocardial viability, had a history of coronary revascularization by either percutaneous transluminal coronary angioplasty or coronary artery bypass grafting, or had suffered a cardiac event between angiography and scintigraphy. With these exclusion criteria, the final patient population included 240 patients (182 men, 58 women; age range, 19–91 y; mean age ± SD, 61 ± 12 y) on whom myocardial perfusion scintigraphy and coronary angiography had been performed within 6 ± 11 d (range, 0–82 d) of each other. Of these 240 patients, 127 (53%) showed a perfusion defect on the resting images indicating chronic myocardial infarction.
Coronary stenoses were assessed semiquantitatively from coronary angiography by an expert reader using a 15-segment coronary tree and a 7-point scoring scale, in which 0 was a normal vessel, 1 was up to 50% stenosis, 2 was 51%–70% stenosis, 3 was 71%–90% stenosis, 4 was 91%–99% stenosis with normal flow, 5 was 91%–99% stenosis with reduced flow, and 6 was an occluded vessel. The distribution of the severity of coronary disease in these 240 patients is given in Table 1.
Distribution of Severity of Coronary Disease
Myocardial Scintigraphy
SPECT.
Patients underwent dipyridamole 201Tl myocardial SPECT perfusion scintigraphy according to the standard clinical protocol. After the infusion of dipyridamole (0.66 mg/kg during 4 min) and injection of 74–111 MBq (2–3 mCi) 201Tl, 30 projection images were obtained by continuous rotation of the SPECT camera (Apex 415; Elscint, Haifa, Israel) through a 180° arc starting from right anterior oblique 55°. Transaxial images (pixel matrix, 64 × 64 8-bit; pixel size, 0.34 cm) were reconstructed according to the CS protocol and transferred to an image analysis workstation for image reorientation, polar map analysis, and automated image processing. Image analysis by the automated methods was applied to only the stress images, because detection of disease and not evaluation of viability was the primary focus.
Visual Analysis.
Visual analysis by an experienced observer was based on the stress images, rest images, and sex of the patient. Coronary angiography results and projection data were not available to the observer. Long- and short-axis images were interpreted for the presence of coronary artery disease based on a 5-point scoring scheme routinely used for clinical readings: normal, equivocal, mildly abnormal, moderately abnormal, and severely abnormal. Visual scoring for individual coronary territories was not part of the standard clinical reading protocol and thus was not available for this study.
Polar Map Analysis.
Polar map analysis was based on a first-generation CS method using commercial software (Elscint). The polar maps were compared with normal values derived from a database of patients with a low likelihood of coronary disease. The extent of perfusion abnormalities was calculated for the entire polar map and for three vascular territories, which were assigned to the left anterior descending (LAD) artery, the circumflex artery (CX), and the right coronary artery (RCA).
Preprocessing for CBR.
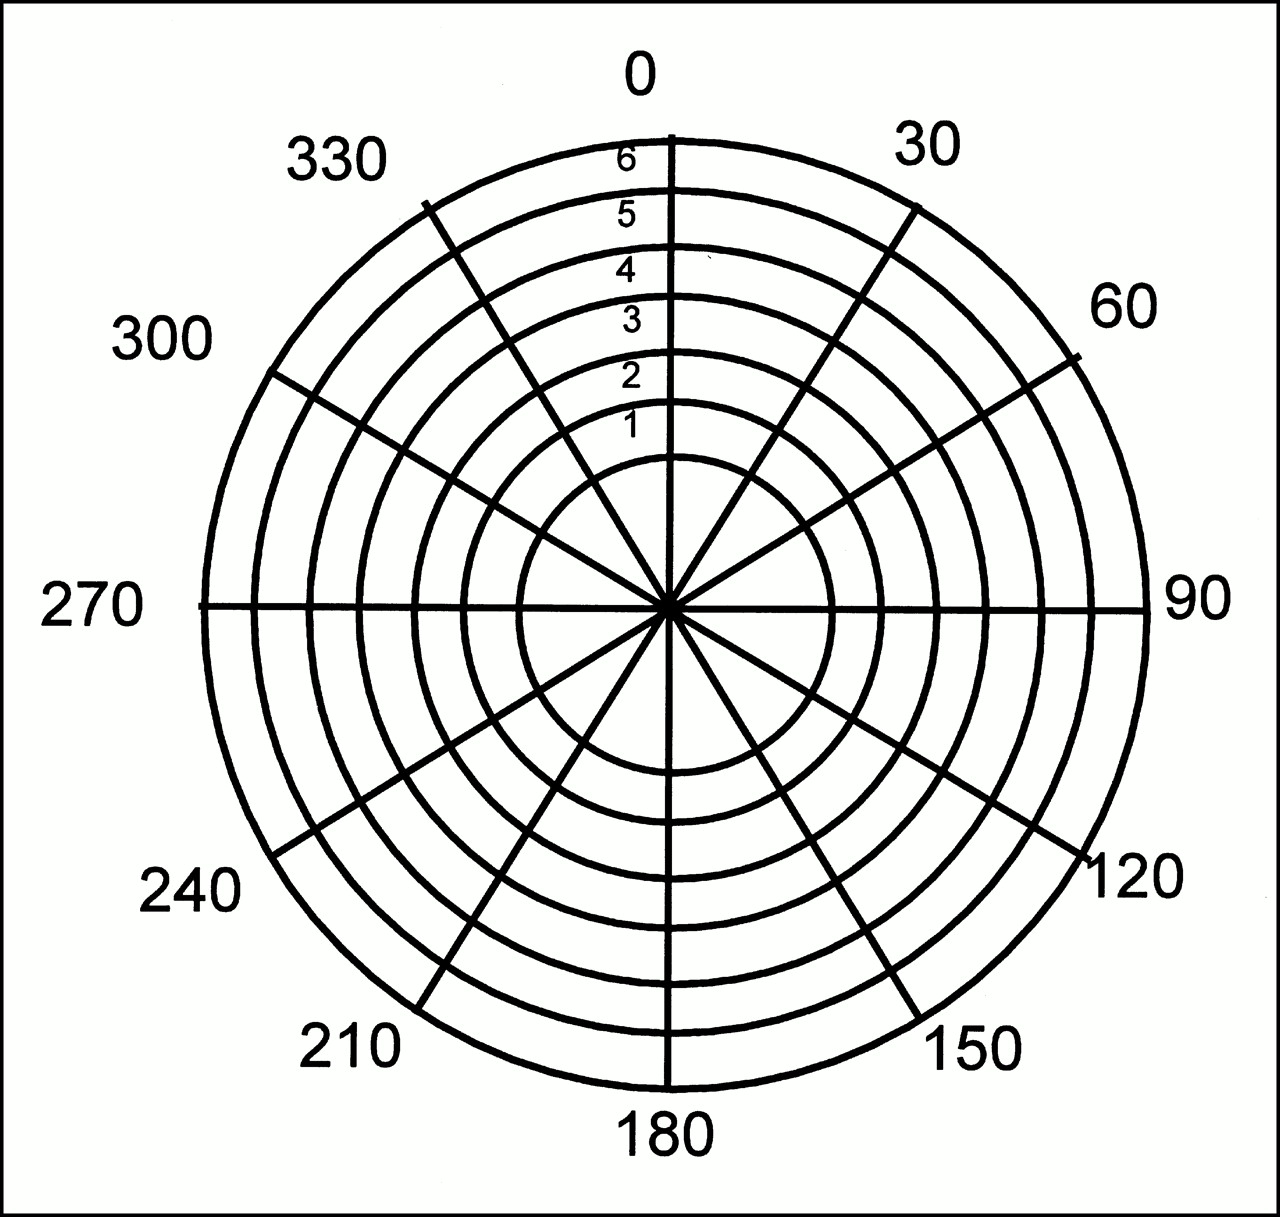
To quantify the distribution of tracer uptake on perfusion scintigrams, polar map images were analyzed along six concentric rings and across the apical region to derive values for the average tracer uptake in twelve 30° sectors around the circumference (Fig. 1). These 84 numbers were then stored in a data file for inclusion in the case library.

Segmentation of polar map (12 sectors, 6 rings, and apical region) for processing by CBR algorithm using similarity metric.
Case Library
Each case in the case library consisted of patient information, polar map data, and the results of coronary angiography. The case library was assembled from two groups of patients selected according to the results of angiography. Group 1 included 58 patients in whom all coronary vessels either were normal or showed only minor luminal irregularities (≤50% stenosis). Group 2 comprised 135 patients who had coronary stenosis greater than 90% in at least one major coronary vessel. We adopted this strategy of patient selection for the case library to include mostly typical rather than indeterminate patterns of normal and abnormal perfusion scintigraphy findings.
CBR
Analysis of perfusion images by CBR first involved compilation of a polar map and calculation of an array of 7 × 12 values for relative segmental tracer uptake. Then, these 84 integer numbers were evaluated for the degree of similarity with each case in the case library by calculating a similarity metric as previously described (6):


else
similari : = 0
end if

end for
This similarity metric represents the weighted sum of differences between segmental uptake values of the index case and the case in the case library. From the case library, the five cases with the highest degree of similarity were retrieved and their corresponding angiographic data were used to calculate a disease score for each of the three major coronary vessels according to the formula:

The VD value for a case in the library is a binary number indicating the presence (value of 1) or absence (value of 0) of coronary artery disease in each vessel. Therefore, the vessel score ranges from 0 to 1 and should estimate the likelihood of disease in each vessel for the presented case. The maximum of the three vessel scores was considered the diagnostic readout of the CBR system for the presence of significant coronary disease.
Analysis of Diagnostic Accuracy
Receiver-operating-characteristic (ROC) analysis was used to compare the diagnostic accuracy of CBR, polar map analysis, and visual interpretation (10). The results of coronary angiography were taken as the reference standard, and significant coronary disease was considered present when at least one major vessel had more than 70% stenosis. For evaluation of the CBR application, each of the 240 cases was taken as a test case; if necessary, temporarily removed from the case library; and then presented to the CBR system as a case for evaluation. Thus, for the ROC analysis, each case in the case library is associated with the scores derived from the CBR system, the extent of perfusion abnormalities derived from polar map analysis, and the visual grading indicating the presence of disease.
Implementation
The CBR system was developed using C and Visual Age C++ on an OS/2 image analysis workstation (Xpert; Elscint). A proprietary command language (CLIP; Elscint) was used to integrate the CBR system with the commercial analysis software for image processing. With this approach, the automated diagnostic assessment of the CBR system was immediately available to the user after the results of the polar map analysis had been calculated.
RESULTS
Detection of Coronary Artery Disease
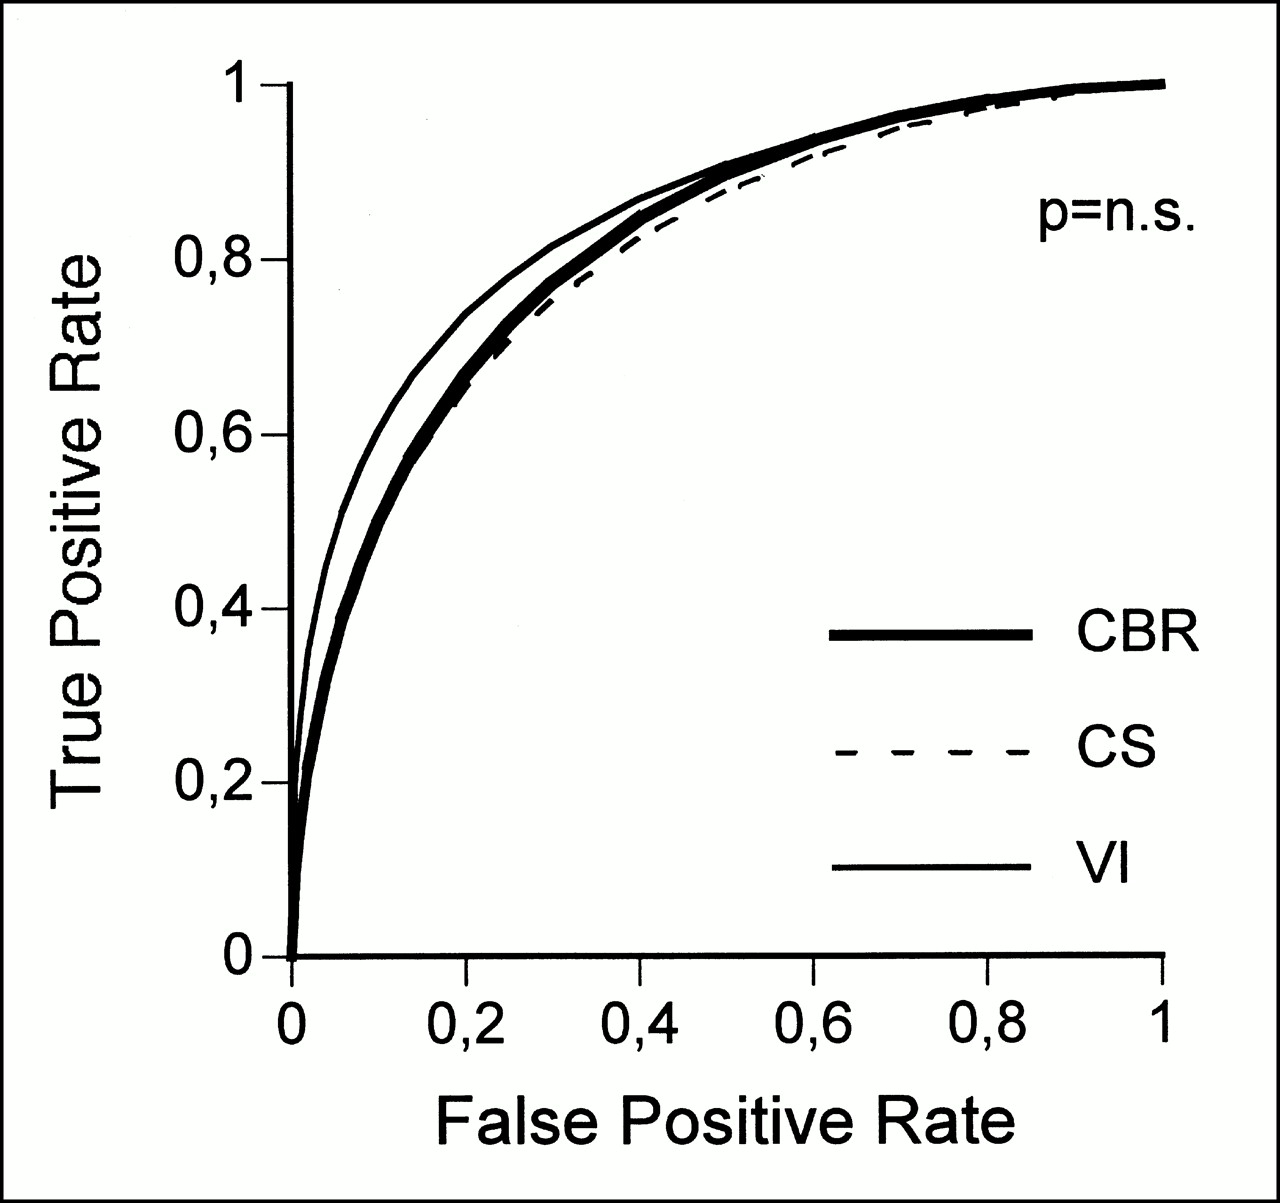
The diagnostic accuracy of CBR, polar map analysis, and visual interpretation for the detection of significant coronary disease was similar by ROC analysis (Fig. 2). The area under the ROC curve was 0.82 for CBR, 0.81 for polar map analysis, and 0.85 for visual interpretation (P = not significant [NS]). At a specificity of 50% and 80%, the respective sensitivities were 90% and 67% for CBR, 88% and 65% for polar map analysis, and 91% and 74% for visual interpretation (Fig. 3).

ROC analysis for detection of significant coronary artery disease (>70% stenosis) for CBR, polar map analysis (CS method), and visual interpretation (VI).
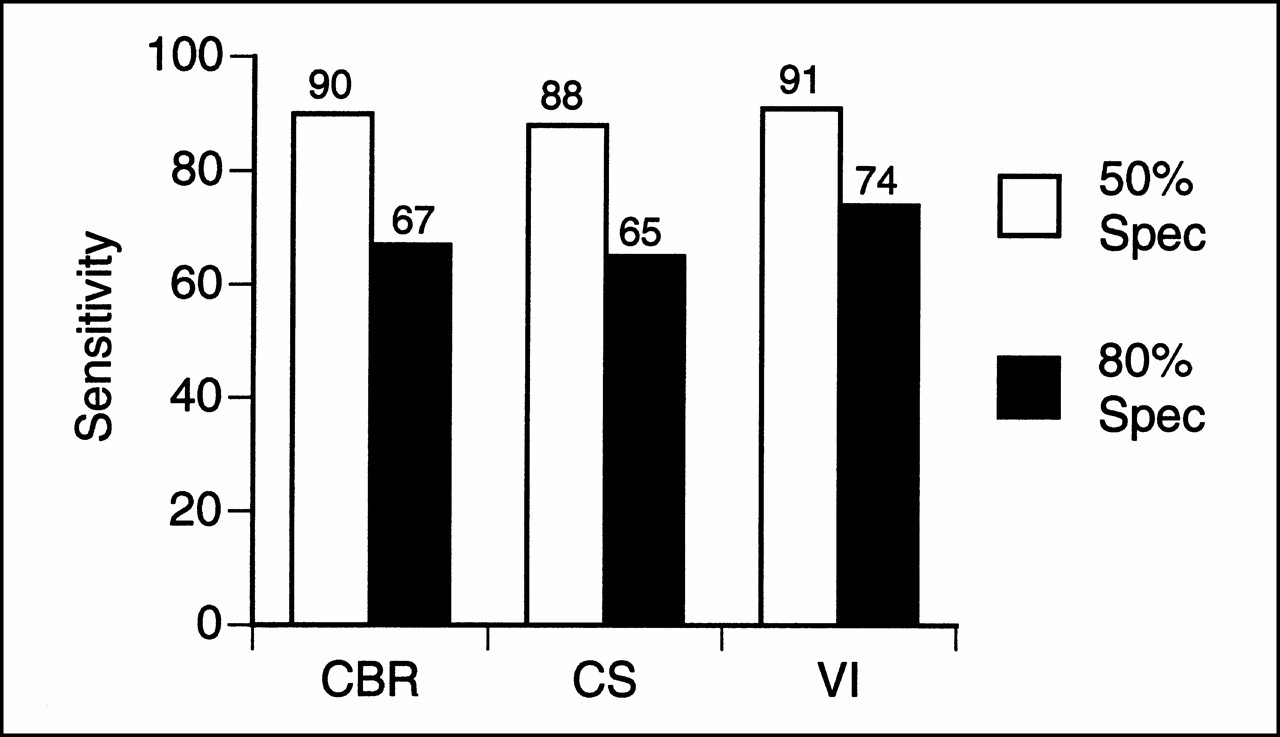
Sensitivity for detection of significant coronary disease at 50% and 80% specificity for CBR, polar map analysis (CS method), and visual interpretation (VI).
Location of Coronary Artery Disease
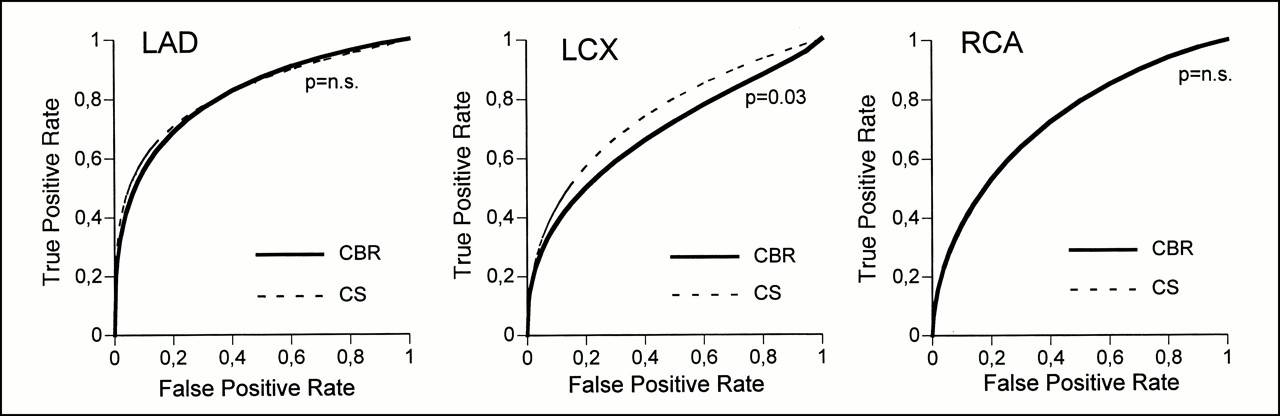
For the detection of coronary disease in the vascular territories assigned to the LAD artery and the RCA, CBR and polar map analysis showed similar diagnostic accuracy by ROC analysis (areas under the ROC curves, CBR vs. CS: 0.82 vs. 0.81 for LAD artery, P = NS; 0.73 vs. 0.73 for RCA, P = NS) (Fig. 4). However, for detection of disease in the CX, polar map analysis showed a slightly better diagnostic accuracy for CS than for CBR (area under the ROC curve, CBR versus CS: 0.69 versus 0.75, P = 0.03). The sensitivity of CBR and polar map analysis for the detection of coronary artery disease in each of the three major coronary vessels at 50% and 80% specificity is displayed in Table 2.

ROC analysis for detection of significant coronary artery disease (>70% stenosis) in each of three vascular territories (LAD artery, left CX [LCX], and RCA) for CBR and polar map analysis (CS method).
Sensitivity of Two Methods for Detection of Disease in Three Vascular Territories at 50% and 80% Specificity
DISCUSSION
This study compared the assessment of myocardial SPECT perfusion scintigrams by two automated, computer-based methods—CBR and polar map analysis based on the CS comparison with a reference database—and by the visual interpretation of an experienced observer. In a large population comprising 240 patients who had been studied by myocardial scintigraphy and coronary angiography, the diagnostic accuracy by ROC analysis for the overall detection of significant coronary disease was similar among the three methods studied.
Visual interpretation of myocardial scintigrams requires experienced observers and is associated with interobserver variability. In particular, diagnostic accuracy may vary within and among observers, is tedious to quantify, and is difficult to standardize. Thus, automated methods have been developed that support the decisions of less experienced readers and exhibit diagnostic accuracies at well-established levels.
Polar map analysis has been used to quantify regional myocardial tracer uptake and detect perfusion abnormalities. The polar map data for a patient can be compared with a database of reference values to characterize the extent and severity of perfusion defects. Polar map analysis as developed at the Cedars-Sinai Medical Center has been reported to be associated with 96% sensitivity, 56% specificity, and an 86% normalcy rate in a single-center experience (2). A multicenter trial has revealed similar diagnostic accuracy (5).
A first-generation CS method as applied in this study uses a database obtained from healthy volunteers to assess the presence and extent of coronary artery disease. A different approach, such as CBR, that also includes individual information from myocardial scintigrams with normal and abnormal findings can be expected to exhibit improved diagnostic accuracy. However, the current study shows that the diagnostic accuracies of CBR and a first-generation CS analysis are similar. Improved versions of the CS methods have recently been developed. However, these algorithms were not available for this study and thus could not be tested against CBR.
CBR used data from images obtained only after dipyridamole stress; data from images obtained with the patient at rest were not included in the database. Also, patient data such as sex and age were not considered during similarity testing. Thus, whether inclusion of these additional data into a similarity metric affects the diagnostic accuracy of CBR remains undetermined.
Although diagnostic accuracy in detecting coronary artery disease overall was not significantly different from that for the LAD artery and RCA territories, the polar map approach showed slightly better accuracy in identifying disease in the CX territory. The reasons for this difference are not obvious. Although this effect may be caused by chance alone, other causes may be the composition of the case library, known variations in the angiographic tree of the CX artery, or polar map analysis. However, this difference, although statistically significant, does not appear to be of clinical relevance.
Previous studies reported on the use of neural networks (7–9), CBR (6), rule-based expert systems (11,12), and fuzzy set theory (13) for image analysis of perfusion scintigrams. Among these studies, systems based on neural networks and CBR revealed a diagnostic accuracy similar to that reported in this study. In contrast, rule-based expert systems and systems based on fuzzy set theory have not yet been tested on a large patient population, and their diagnostic accuracy thus remains undetermined.
CONCLUSION
Automated interpretation of myocardial SPECT perfusion images by CBR shows diagnostic accuracy similar to that of CS polar map analysis and visual interpretation when coronary angiography is used as the reference standard. However, for automated image interpretation, use of a case library that includes normal and abnormal perfusion data does not appear to have greater diagnostic power than use of a reference database.
Acknowledgments
The authors thank Brigitte Slama, Regina Wagner, and Angela Fasching for technical assistance in performing myocardial SPECT perfusion studies. The authors are also grateful for the support and cooperation of the technologists and nurses working in the coronary catheterization laboratory of our department. This study was supported in part by a research grant from the Verein zur Förderung der wissenschaftlichen Forschung am Rudolfinerhaus.
Footnotes
Received Feb. 29, 2000; revision accepted Aug. 2, 2000.
For correspondence or reprints contact: Gerold Porenta, MD, PhD, Rudolfinerhaus, Billrothstrasse 78, A-1190 Vienna, Austria.


