


Abstract
Several groups have developed high-resolution PET systems and shown the feasibility of in vivo studies on small laboratory animals. In this investigation, one of these systems was validated for the performance of receptor imaging studies. For this, the radiotracer concentrations obtained in the same animals with PET and with autoradiography were quantified, and the correspondence between both methods was assessed by means of correlation analysis. Methods: Striatal radioactivity was measured in 10 Sprague–Dawley rats after injection of 60 ± 10 MBq of the dopamine D2 receptor ligand 18F-(N-methyl)benperidol in 6 time frames of 6 min each. On completion of the scans, animals were killed, and their brains were removed and sectioned using a cryostat microtome. Coronal slices were subjected to storage phosphor autoradiography with BaFBr:Eu2+-coated imaging plates. Striatal radioactivity was quantified in both modalities using region-of-interest analysis and activity standards. Results: After partial-volume correction, the median of striatal radioactivity concentration measured with PET was 0.40 MBq/cm3 (25th percentile, 0.32; 75th percentile, 0.44). Radioactivity concentrations determined by means of storage phosphor autoradiography amounted to 0.42 MBq/cm3 (25th percentile, 0.24; 75th percentile, 0.51). Correlation of striatal radioactivity values yielded a Pearson correlation coefficient of 0.818 (P = 0.002). Radioactivity accumulation in Harder’s glands led to an overestimation of striatal activity concentrations by approximately 5%. The median of striatal radioactivity concentration after spillover correction decreased slightly to 0.38 MBq/cm3 (25th percentile, 0.30; 75th percentile, 0.43). Correlation of striatal radioactivity values after spillover correction yielded a Pearson correlation coefficient of 0.824 (P = 0.002). Conclusion: The results show a significant positive correlation between radioactivity values obtained with PET and storage phosphor autoradiography used as the gold standard. Because we applied a selective dopamine D2 receptor radioligand and because radioactivity concentrations could be reliably quantified in the target region, we may infer that in vivo receptor binding studies will be possible in small laboratory animals.
In vivo imaging techniques are widely applied in the diagnosis and staging of various diseases, the assessment of therapy response, and the detection of recurrence. This application is of growing clinical relevance not only for the study of human malignancies and cardiovascular diseases but also for neurologic and psychiatric diseases related to changes in neuroreceptor status (1,2).
In recent years, several dedicated high-resolution PET scanners have been developed (3–12), which permit noninvasive and repetitive in vivo studies in small laboratory animals. One important application of these devices may be the performance of receptor binding studies in rat or mouse models of various diseases. This study focuses on this application, and was performed with a PET system developed in the Forschungszentrum Jülich, Jülich, Germany (TierPET), for the examination of small laboratory animals (13–15).
18F-(N-Methyl)benperidol was used as the radiotracer in this study. Benperidol is a dopamine D2 receptor antagonist of the butyrophenone class, which is clinically applied as an antipsychotic drug. Recent investigations on primates indicated that the 18F-labeled analog of benperidol, 18F-(N-methyl)benperidol, is a suitable radioligand for the investigation of striatal D2 receptors with PET (16).
The aim of this investigation was the validation of the small-laboratory-animal PET system for the performance of receptor imaging studies with 18F-(N-methyl)benperidol. As a reference method, we used storage phosphor autoradiography, which has the advantages of higher sensitivity and a wider linear dose–response range than those of conventional film autoradiography (17).
MATERIALS AND METHODS
Animals
Ten male Sprague–Dawley rats (Charles River Laboratories, L’Arbresle, France), weighing 350–500 g, were used. Experiments were performed in accordance with the German Law on the Protection of Animals and were approved by the regional authority.
Radiotracer Preparation
18F-(N-Methyl)benperidol was generously supplied by the Institut für Nuklearchemie (Forschungszentrum Jülich). The radiotracer was synthesized as described (18). Nucleophilic aromatic fluorination using 18F-for-nitro exchange was performed according to the method described for the butyrophenone ligand 18F-(N-methyl)spiperone (19). For intravenous injection, 18F-(N-methyl)benperidol was dissolved in 0.9% saline containing 10% ethanol. The radiochemical purity was >98% as determined with high-performance liquid chromatography. The median of the specific activity at injection time was 19.68 TBq/mmol (range, 3.56–153.66 TBq/mmol [25th percentile, 7.98 TBq/mmol; 75th percentile, 33.95 TBq/mmol]).
Instrumentation
The PET camera was developed by the Zentrallabor für Elektronik (Forschungszentrum Jülich). Technical specifications have been described in detail elsewhere (13–15). In brief, the camera consisted of 2 orthogonal pairs of detectors mounted on an aluminum wheel. A head holder was screwed to a motor-controlled object tablet, which could be moved along the x-, y-, and z-axis and thus permitted exact positioning of the animal within the field of view (FOV). To reduce perturbations caused by scattered photons, the animal’s body was kept within a lead tube (wall thickness, 20 mm) during scanning of the brain. To maintain a body temperature of 37°C, the tube was constantly perfused by warm water.
Each detector block consisted of a matrix of 400 single yttrium aluminum perovskite scintillator crystals (2 × 2 × 15 mm3; Preciosa Crytur Ltd., Turnov, Czech Republic), which was coupled to a position-sensitive photomultiplier tube (R2487; Hamamatsu Photonics Deutschland, Herrsching, Germany). The axial and transaxial FOV had a diameter of 40 mm. The sensitivity was 3.24 counts per second (cps)/kBq for a center-detector distance of 80 mm. The spatial resolution was 2.1 mm (full width at half maximum).
PET Scans
After short-time anesthesia with isoflurane, animals received intramuscular injections of ketamine (0.9 mL/kg) and xylazine (0.4 mL/kg). 18F-(N-Methyl)benperidol (median, 62 MBq [25th percentile, 61 MBq; 75th percentile, 65 MBq]) was injected into the right jugular vein. The median of the injection volume was 1.1 mL (25th percentile, 0.7 mL; 75th percentile, 1.4 mL). The median of the injected radioactivity dose amounted to 113 MBq/kg (25th percentile, 107 MBq/kg; 75th percentile, 126 MBq/kg). After surgical dressing, animals were positioned in the PET system. Images were acquired over 36 min (6 time frames of 6 min each) with angular steps of 7.5° (30 s per angular step). The median of the time delay between application of the radioligand and beginning the measurement was 6 min (25th percentile, 4 min; 75th percentile, 8 min).
Data Processing
The data acquisition has been described in detail elsewhere (13). The 3-dimensional (3D) mode data resulting from transformation of the x- and y-locations of the coincidence-detector modules into spatial coordinates were rebinned according to the method described by Lewitt et al. (20) and, thus, were converted into 2-dimensional (2D) sinograms. Because determination of attenuation correction on the basis of transmission measurements was not yet possible, this factor was estimated during sinogram conversion assuming a homogeneous cylinder with μ = 0.095 cm−1. Applying an expectation maximization algorithm (21), the 2D sinograms were reconstructed (Alpha Station 200; Digital Equipment Corp., Maynard, MA) in consecutive slices of 2-mm thickness.
Dead-time correction factors were estimated by measuring the natural decay of 11C and comparing the measured coincidence counting rate for each time frame with the extrapolated counting rate after 9 isotope half-lives. The correction factors were applied on an event-per-event basis during the conversion of the list mode data into sinograms. Minimal and maximal dead-time factors in this study were 1.25 and 1.5, respectively (mean value, 1.3).
Detector normalization factors were measured using a positron point source (68Ge/Ga) with a distance of 28 cm from the detectors—that is, the 7-fold FOV diameter. The single events were acquired for each detector separately with total counting rates of 1.7 × 10⁶, 1.2 × 10⁶, 1.4 × 10⁶, and 1.3 × 10⁶. The normalization factors were computed as the ratio of measured to expected single events for each crystal. The mean factors amounted to 1.2, 0.87, 0.98, and 0.94, respectively, for the single detectors. Scanner normalization with respect to different detector distances was performed during conversion of the list mode data by calculating the sensitivity of the oblique lines of response, which transverse the slices within the FOV.
Quantification of radioactivity concentration was performed with a syringe phantom containing a defined amount of radioactivity (18F) in a volume of 2 mL. The inner diameter of the syringe was 9.8 mm, which is approximately 2 times the diameter of the rat’s striatum and 4 times the spatial resolution of the PET camera. The PET measurement of the phantom was performed 3 times. On the basis of these measurements, 0.0027 cps/mm3 as registered with the PET camera corresponded to 1.2 Bq/mm3. This value served as a calibration factor to calculate radioactivity concentrations from the counting rates within the regions of interest (ROIs).
Data Analysis
The 6 time frames were summed, and the resulting image was analyzed using the Multi Purpose Imaging Tool, Version 2.57 (Advanced Tomo Vision, Erftstadt, Germany). According to the standard rat brain atlas by Paxinos and Watson (22), striata were localized individually for each animal on coronal sections. Two standard circular ROIs with diameters of 2.5 mm were drawn around the centers of both striata. The positions but not the sizes of the ROIs were adjusted individually for each animal by 2 operators, independently. The interoperater variability was <5%. According to the late-time method (23), the mean left and right striatal radioactivity concentrations in the last 3 time frames were computed.
Partial-Volume Correction
The investigation of small targets is biased by the partial-volume effect. This nonlinear artifact leads to an underestimation of the radioactivity concentration in objects smaller than twice the resolution of the scanner used. On the coronal sections, where the ROIs had been delineated, the mesiolateral striatal diameters amounted to approximately 2.5 mm, which is in the range of the system’s spatial resolution.
Phantom studies with water-filled cylinders of various radii performed with the animal PET device have shown that, in a target with a diameter of 2.5 mm, radioactivity will be underestimated by approximately 60%. On the basis of these measurements, left and right striatal radioactivity values before and after spillover correction underwent partial-volume correction. Left and right striatal radioactivity concentrations were averaged for each animal.
Spillover Correction
Previous studies (24,25) showed a high tracer accumulation in Harder’s glands, which are located in the medial part of the orbita (Fig. 1). Because tracer accumulation in this region might result in an overestimation of cerebral radioactivity concentration caused by spillover effects, a correction algorithm was applied to the PET data (27). Briefly, the influence of retroorbital radioactivity on the determination of striatal radioactivity was quantified on transversal slices by fitting gaussian model functions to the activity profiles of both striata and orbitae. The overlap between striatal and orbital curve was taken as a measure for spillover. For each animal, the spillover was subtracted from the mean left and right decay-corrected striatal activity.

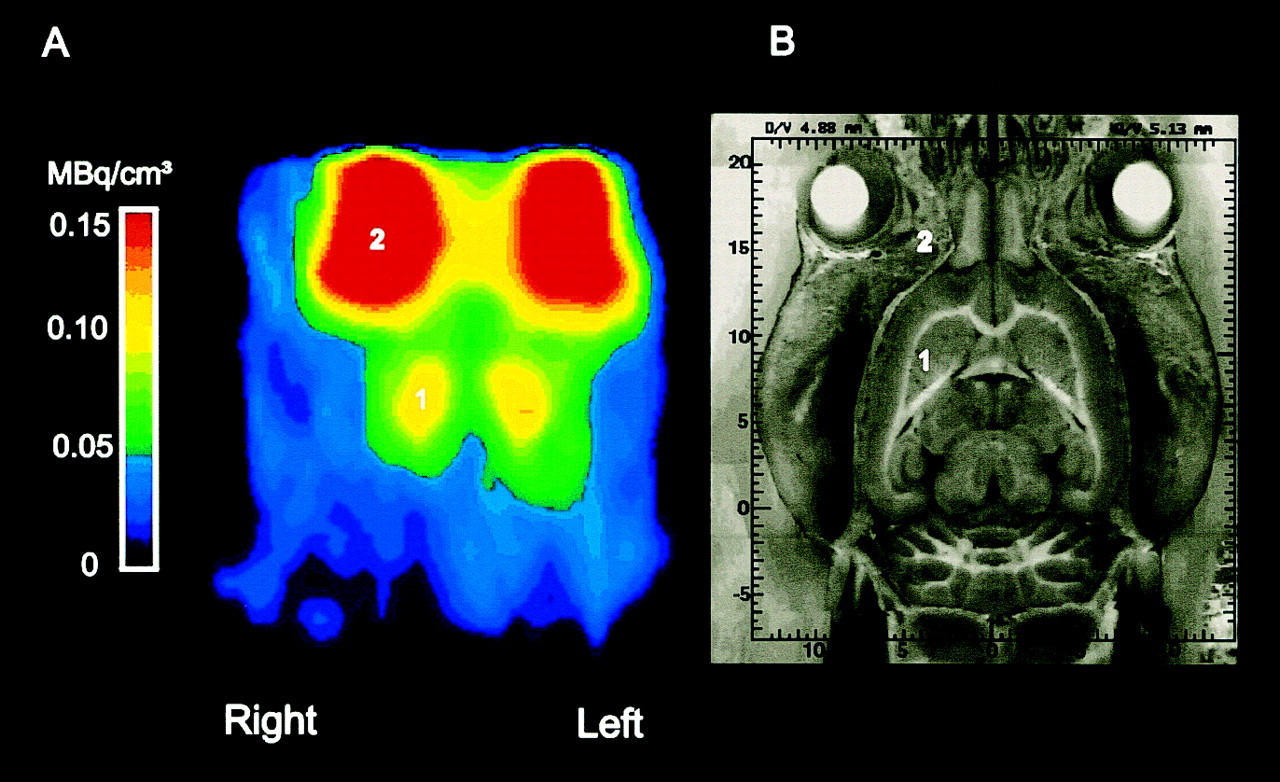
Transverse slices of Sprague–Dawley rat head obtained with PET camera (A) and taken from digital 3D stereotactic atlas by Toga et al. (26) (B) show accordance of PET image and macroanatomy of rat head. Highest concentrations of 18F-(N-methyl)benperidol are found in striata (1) and in Harder’s glands (2). For dorsoventral positions in cryosection image, see Toga et al. (26).
Autoradiography
On completion of the PET scans, the deeply anesthetized animals were killed by cervical dislocation. The brains were removed and frozen in isopentane (−70°C). Consecutive coronal sections of 20-μm thickness were made from 2.2 mm before to 2.3 mm behind the bregma (23) using a cryostat microtome (CM3050; Leica, Bensheim, Germany). Each fifth slice was mounted on a microscopic slide and air dried at room temperature. Radioactivity standards were prepared from bovine brain with increasing concentrations of 18F-(N-methyl)benperidol (20–750 kBq/g of tissue wet weight). On manual homogenization of the tissue, cryosections of 20-μm thickness were obtained.
The principle of storage phosphor screen imaging has been described in detail elsewhere (17). In brief, imaging plates coated with photostimulable europium-doped BaFBr (BaFBr:Eu2+) crystals (SR 2025; Fuji Medical Systems, Clichy, France) were exposed to striatal slices as well as standards for 17 h. On exposure, plates were scanned with a high-performance imaging plate reader (BAS5000; Fuji) providing a spatial resolution of 25 μm. The images resulting from analog–digital conversion of the emitted luminescence were analyzed with dedicated software (AIDA 2.3 0.1; Raytest Isotopenmessgeräte GmbH, Straubenhardt, Germany). The whole striatal outline was thereby delineated as an ROI from 2.2 mm before to 2.3 mm behind the bregma. The mean striatal radioactivity concentrations were calculated for each animal.
Statistical Analysis
Medians as well as 25th and 75th percentiles of striatal radioactivity concentration were computed for PET and for autoradiography. Autoradiographic data were correlated with PET data that were corrected for spillover from the retroorbital tissue and with PET data that were not corrected for spillover. The Pearson correlation coefficients were determined for either case as a measure for the correspondence between the PET scanner and storage phosphor autoradiography (1-sided t test, α = 0.01).
RESULTS
Figure 1 shows a characteristic transversal slice as obtained with the PET camera (Fig. 1A) along with a corresponding image of the rat head (Fig. 1B) from the digital brain atlas of Toga et al. (26). Figure 2 presents coronal images obtained from the same animal with the PET scanner (Fig. 2A) and storage phosphor autoradiography (Fig. 2B). In contrast to the autoradiographic image, PET also depicts extracerebral structures that accumulated 18F-(N-methyl)benperidol such as Harder’s glands (Fig. 1A) and the salivary glands (Fig. 2A). Both methods show that the intracerebral 18F-(N-methyl)benperidol activity concentration is highest in the striatum.
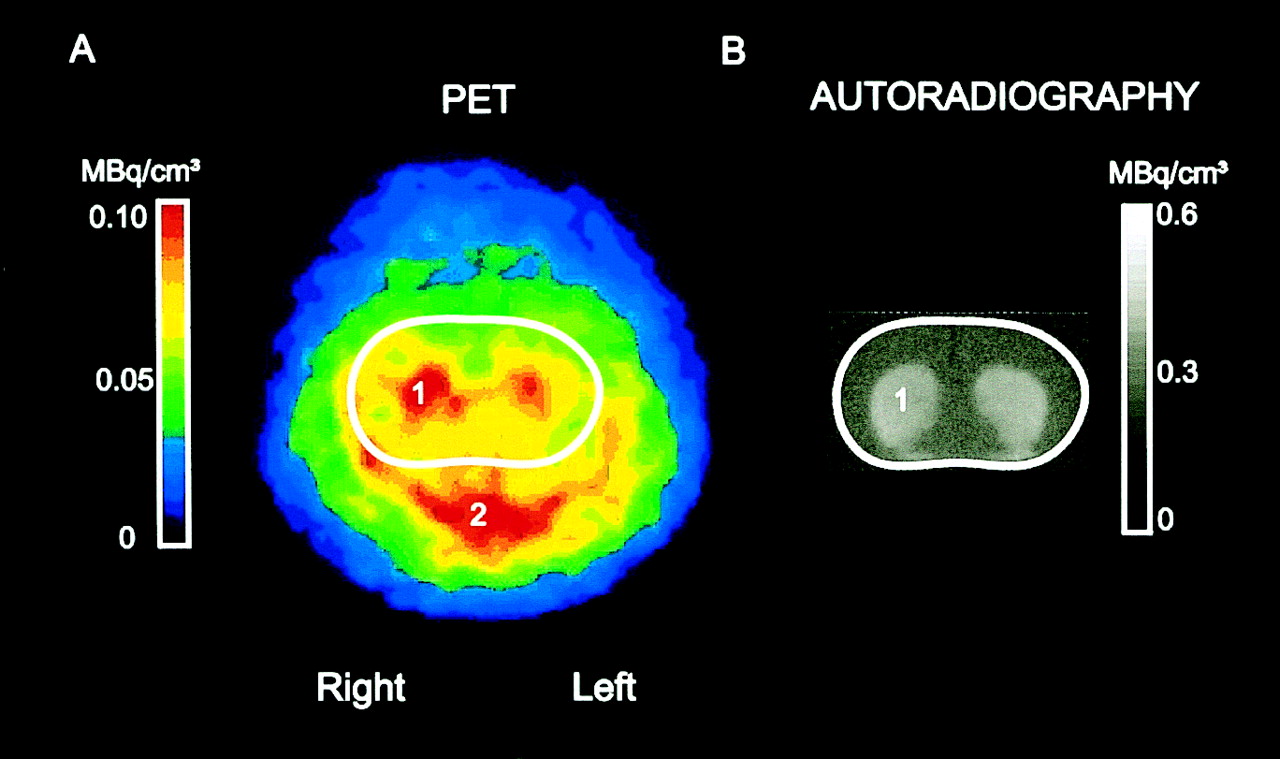
Characteristic images (coronal sections) obtained with PET (A) and with storage phosphor autoradiography (B) after intravenous administration of 18F-(N-methyl)benperidol to male Sprague–Dawley rat with highest accumulation in striata (1) and salivary glands (2). (A) Whole rat head. (B) Cerebrum. Outline of autoradiographic slice (rat’s cerebrum) was transferred to PET image.
After partial-volume correction, the median of striatal 18F-(N-methyl)benperidol concentration measured with PET was 0.40 MBq/cm3 (25th percentile, 0.32; 75th percentile, 0.44). Similarly, the median of the autoradiographically determined activity concentration was 0.42 MBq/cm3 (25th percentile, 0.24; 75th percentile, 0.51). Correlation of striatal radioactivity values obtained with both methods yielded a Pearson correlation coefficient (r) = 0.818 (1-tailed t test, P = 0.002).
Before partial-volume correction, the median of the absolute striatal radioactivity concentrations measured with PET amounted to merely 0.15 MBq/cm3 (25th percentile, 0.12; 75th percentile, 0.16). Thus, partial-volume correction led to a 4-fold increase of striatal radioactivity values.
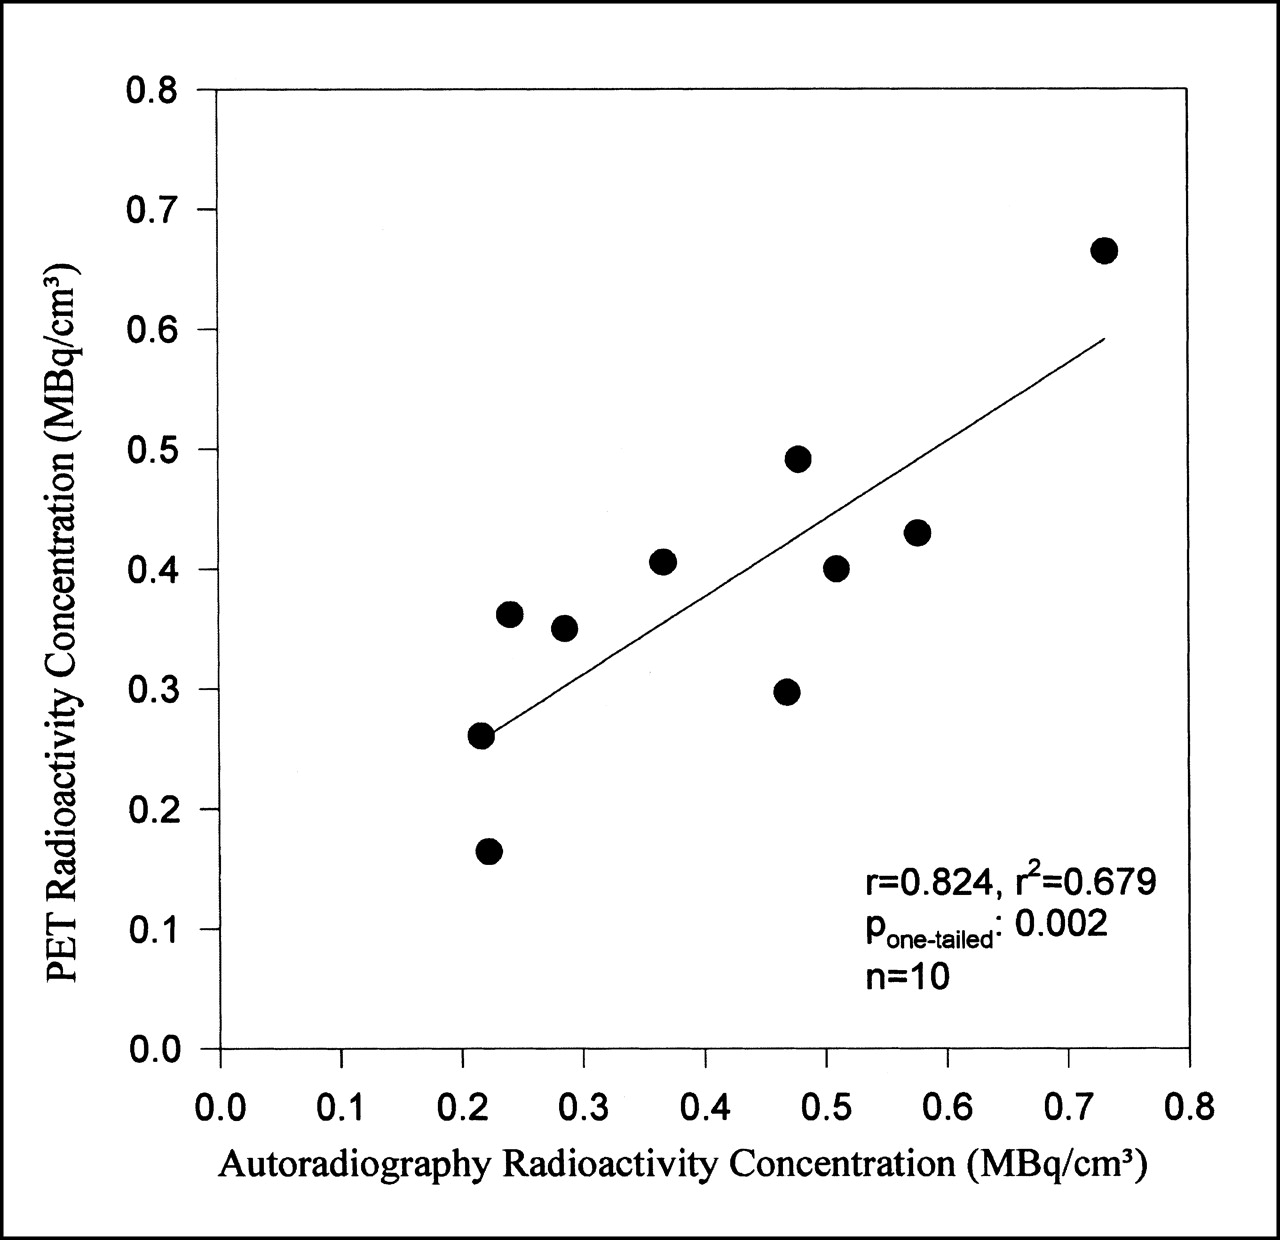
Tracer accumulation in the retroorbital region resulted in an approximately 5% overestimation of striatal activity concentration. Spillover correction of the partial-volume–corrected data consequently resulted in a slightly lowered median value of 0.38 MBq/cm3 (25th percentile, 0.30; 75th percentile, 0.43). Correlation of striatal radioactivity values after spillover correction yielded an r = 0.824 (1-tailed t test, P = 0.002) (Fig. 3).

Striatal radioactivity concentration of 18F-(N-methyl)benperidol obtained with storage phosphor autoradiography plotted against radioactivity concentration measured with PET camera after decay, partial-volume, and spillover correction.
DISCUSSION
Our results show a significant positive correlation between striatal radioactivity concentration measured with a PET system for small laboratory animals and autoradiography. Approximately 68% of PET data variance can be explained by the actual striatal 18F-(N-methyl)benperidol radioactivity concentration as determined with storage phosphor autoradiography as the gold standard.
The dependent variable investigated in this study—namely, the striatal radioactivity concentration as measured with the PET scanner—is influenced by various independent variables. Among them are the true striatal concentration of D2 receptors (the maximal number of available binding sites) and the affinity of 18F-(N-methyl)benperidol for these binding sites (the dissociation constant). For this investigation, the objection might be raised that, in several animals with comparatively low specific activities (28), a considerable number of receptors were occupied by labeled or unlabeled (methyl)benperidol. As a consequence, our data were not suitable for calculation of the binding potential of 18F-(N-methyl)benperidol, and this validation study was confined to merely quantifying striatal radioactivity concentration.
The radioligand used in this study, 18F-(N-methyl)benperidol, is not as well established for human and animal trials as is, for example, [11C]raclopride. However, the 109.7-min half-life of 18F-labeled compounds permits imaging over a wider time range and thus facilitates the performance of kinetic studies. Also, the 18F positron energy is the lowest of the first-row positron emitters. For this reason, imaging can be done at higher resolution, which becomes important when anatomic structures such as the rat striatum, with a diameter in the millimeter range, are to be investigated. Together, these circumstances suggest the application of an 18F-labeled rather than a 11C-labeled ligand. On the basis of the studies of Moerlein et al. (16), who showed that 18F-(N-methyl)benperidol is characterized by high affinity and selectivity for striatal D2 receptors, we chose this radioligand rather than other suitable D2 receptor ligands such as 18F-(N-methyl)spiperone (29), 18F-fluoroethylspiperone (30), and 18F-fallypride (31).
The purpose of our study was to assess the validity of the PET scanner by comparing striatal 18F-(N-methyl)benperidol activity concentrations measured with the PET camera with concentrations obtained using a well-established reference method. For this, we used ex vivo autoradiography, which is widely applied not only in receptor binding studies but also in other investigations using PET devices for imaging small animals (32–36). It is important to note that in these studies autoradiography was used in a semiquantitative way to compare merely patterns of uptake between methods. In contrast, our study explicitly assesses the correspondence between both imaging methods, and it does so by means of quantitative values obtained by both modalities.
However, in using either film or storage phosphor autoradiography as the gold standard, one must be aware of the fact that, because of inherent methodologic problems (e.g., quenching, slight variations in slice thickness, quality of standards varying between trials with the bovine cortex having been manually dissected and homogenized), this method is not supposed to yield error-free results. Moreover, autoradiographic radioactivity concentration values were averaged over the entire rostral to caudal extension of the rat striatum. For single animals, all of these factors led to a variation between slices of 12%–37%.
In contrast to this, PET data were evaluated in such a manner that 1 coronal brain section was selected, on which left and right striatal ROIs were defined. This selection of a suitable slice depended on, first, the localization of the striatal activity maximum and, second, the cranial anatomy of the examined rats—that is, the activity accumulation in adjacent regions attributed to Harder’s glands. As a consequence, with the PET scanner, striatal radioactivity values were not determined for the whole striatum but merely for 1 slice within the intermediate portion, where the striatal diameter was as high as possible and the spillover from the retroorbital tissue was as low as possible. Moreover, these selected slices were not identical in all animals because the lack of concurrent anatomic imaging rendered the determination of exact anteroposterior coordinates impossible. Furthermore, because of the relatively low counting rates of 70–380 counts per ROI, the PET data were subjected to a natural statistical variation of 5%–12%. It is remarkable that correlation of these noisy PET data with the autoradiographic data that were contaminated with noise of a different origin still displayed a data dependency of 68%.
It is important to note that, because of careful positioning of the striatal ROIs, the spillover from Harder’s glands proved to be minimal. This result was achieved by an improved spatial resolution of the PET camera that led to a separation of the striatal and orbital radioactivity maxima by about twice the spatial resolution. Moreover, the striatal ROI diameter was fixed to 2.5 mm; considering the activity profiles of striatal and orbital regions, the striatal ROIs contained only negligible amounts of spillover radiation. Thus, our spillover correction influenced the quantification of striatal radioactivity only minimally and produced no effect on the correlation between PET and autoradiography data.
Hume et al. (37) and Myers et al. (38), who reported widely discrepant results when comparing scan data with activity values obtained with a γ-counter after postmortem dissection, pointed out that these differences might be attributed to spillover and partial-volume effects. After correction for the partial-volume effect, our data obtained with PET and with autoradiography are in the same order of magnitude, whereas spillover from retroorbital tissue in our investigation of striatal D2 receptors could be widely eliminated. In our attempt, the partial-volume effect was merely estimated on the basis of a phantom study. This result might be optimized by coregistration of PET and MRI, which would allow for an exact anatomic orientation and, thus, for the determination of the target volume in each of the PET slices, which in turn would permit the calculation of specific recovery factors (39,40).
CONCLUSION
Striatal radioactivity values after injection of the dopamine D2 receptor radioligand 18F-(N-methyl)benperidol as assessed with an animal PET device and with storage phosphor autoradiography correlated significantly. Because we applied a selective dopamine D2 receptor radioligand and radioactivity concentrations could be reliably quantified in the target region, we may infer that in vivo receptor binding studies will be possible in small laboratory animals. However, factors such as partial-volume effect and, to a lesser degree, spillover from neighboring tissue may affect the absolute quantification of PET data. If these factors are considered, the use of animal PET devices with the possibility of performing longitudinal studies of the same individual provides a viable complement to established in vivo and postmortem techniques, such as microdialysis or receptor autoradiography.
Acknowledgments
The authors thank Prof. Heinz H. Coenen for his methodologic suggestions, Dr. Simone Weber (Zentrallabor für Elektronik) for her contributions to the PET experiments, and Dr. Karl Hamacher (Institut für Nuklearchemie) for the synthesis of 18F-(N-methyl)benperidol. The authors also thank Drs. Weber and Hamacher for their contributions to this article and acknowledge Dr. Andreas Bauer (Institut für Medizin) for fruitful discussions. This work was supported by a grant from the Forschungskommission of the Faculty of Medicine, Heinrich-Heine-Universität, Düsseldorf, Germany. The study was performed in the Institut für Medizin, Forschungszentrum Jülich (Director, Prof. Dr. Karl Zilles). The PET scanner (TierPET) was developed by the Zentrallabor für Elektronik, Forschungszentrum Jülich (Director, Prof. Dr. Horst Halling). 18F-(N-Methyl)benperidol was synthesized in the Institut für Nuklearchemie, Forschungszentrum Jülich (Director, Prof. Dr. Heinz H. Coenen).
Footnotes
Received Feb. 6, 2001; revision accepted Jul. 10, 2001.
For correspondence or reprints contact: Rolf Larisch, MD, Department of Nuclear Medicine, Heinrich-Heine-Universität, Moorenstrasse 5, 40225 Düsseldorf, Germany.
REFERENCES
In this issue


Jump to section
Related Articles
Cited By...
- Reproducibility of 11C-Raclopride Binding in the Rat Brain Measured with the MicroPET R4: Effects of Scatter Correction and Tracer Specific Activity
- In Vivo Measurement of D2 Receptor Density and Affinity for 18F-(3-N-Methyl)Benperidol in the Rat Striatum with a PET System for Small Laboratory Animals