


Abstract
One objective of this investigation was to determine whether chemical modifications of oligonucleotides to permit radiolabeling with γ- or positron emitters interferes with hybridization and target cell accumulation. A second objective was to establish to a reasonable extent whether cellular accumulation of radiolabeled oligonucleotides can be explained by an antisense mechanism. Methods: An 18mer uniform phosphorothioate DNA antisense to the messenger RNA (mRNA) of the type I regulatory subunit α of cyclic adenosine monophosphate-dependent protein kinase A (RIα) was conjugated with the N-hydroxysuccinimidyl derivative of S-acetylmercaptoacetyltriglycine (MAG3) through a primary amine/linker and investigated in vitro in cell culture. Results: By surface plasmon resonance, the association kinetics between native (i.e., without amine/linker) DNA and MAG3-amide/linker-DNA were identical. Melting temperatures were also identical for native DNA, amine/linker-DNA, and MAG3-amide/linker-DNA, indicating that these chemical modifications had no detectable influence on hybridization. However, cellular accumulation of 99mTc-MAG3-DNA was lower than that of 35S-MAG3-DNA, suggesting that chemical modifications can have an important influence on cellular accumulation. In tissue culture studies of ACHN tumor cells (a human renal adenocarcinoma cell type), an antisense effect was suggested by 3 findings: an increased accumulation of 35S- or 99mTc-labeled antisense versus sense DNA, an increased accumulation of 99mTc-antisense DNA in another RIα-positive tumor cell line (LS174T) but not in a murine transfected control cell line (HC-2), and the disappearance of the increased cellular accumulation of 99mTc-antisense DNA with increasing dosage of antisense DNA. Higher than expected cellular accumulations of about 105 antisense DNAs per cell over 24 h suggest stabilization of the target mRNA or increased mRNA production by the presence of the antisense DNA. In support of this suggestion, we observed, first, an increased incorporation of uridine-5′-triphosphate into RNA in cells exposed to the antisense DNA but not to the control DNA and, second, an increase in target mRNA expression in cells exposed to the antisense DNA but not to the control DNA. Conclusion: This evidence suggests tumor cell accumulation by an antisense mechanism. Moreover, the high level of DNA accumulation suggests that a rapid target mRNA turnover or transcription rate may be an important determinant of tumor counting rates.
Clinical efficacy in antisense chemotherapy has now been shown (1–3). The field of antisense imaging will share many similarities with antisense chemotherapy (4,5); however, an important dissimilarity is the need, unique to antisense imaging, to modify the DNA to carry the positron- or γ-emitting radionuclide. Once it becomes necessary to modify chemically an antisense DNA for any reason, it becomes necessary to establish the influence of the chemical modifications on the properties of DNA integral to antisense targeting. The influence of 18F radiolabeling by 1 method on the pharmacokinetics of a DNA has been explored (6), as has the ability of oligomers to hybridize to their complement after radiolabeling with γ- or positron-emitting radionuclides by a variety of methods (6–9). The influence of radiolabeling methods on the kinetics and affinities of hybridization requires considerably more investigation. Moreover, as yet largely unexplored are the influences of chemical modifications on the behavior of antisense DNAs in tissue culture.
In this research, one 18mer antisense uniformly phosphorothioate-modified DNA was conjugated with the N-hydroxysuccinimidyl derivative of S-acetylmercaptoacetyltriglycine (NHS-MAG3) to a primary amine on its 5′ end (10). Melting temperatures and surface plasmon resonance were then used to assess the influence of these chemical modifications on hybridization. In addition, by labeling with 35S and 99mTc, the influence of these chemical modifications on accumulations in 1 cell type expressing the target messenger RNA (mRNA) was evaluated.
The antisense DNA used in this and our previous investigation (11) is directed against the intracellular growth-regulatory molecule, cyclic adenosine monophosphate (cAMP)–dependent protein kinase A, type I, and type I regulatory subunit α of cAMP-dependent protein kinase A (RIα). The 18mer DNA does not include a G quartet (i.e., 4 guanine bases together: GGGG), which has been identified as contributing to sequence-specific nonantisense effects on phosphorothioate DNAs (12). The control DNAs possess the sense or random sequences. Uniformly modified phosphorothioate DNAs were selected for all DNAs because of the documented success in the treatment of cancer and other diseases with this, the most common, chemical form for antisense studies. The use of a human renal adenocarcinoma cell type (ACHN) was based on a report of dose-dependent growth inhibition by the antisense DNA with a mixed methylphosphonate/phosphorothioate backbone (13).
Apart from establishing the influences of chemical modification on antisense DNA properties, another goal of this investigation was to establish to a reasonable extent whether cellular accumulation could be explained by an antisense mechanism.
MATERIALS AND METHODS
Standard chemicals were obtained from various suppliers and used without purification. All oligonucleotide DNAs were purchased from the same source as the uniform phosphorothioates (Operon Technologies, Alameda, CA), purified with high-performance liquid chromatography (HPLC), and used as supplied. These included the antisense (5′-GCG TGC CTC CTC ACT GGC), sense (5′-GCC AGT GAG GAG GCA CGC), and random (5′-GGG ATC GTT CAG AGT CTA) DNAs, each with a primary amine on the 5′ end attached through a 6-carbon alkyl linker. The antisense DNA was also purchased as the native form (i.e., without the terminal amine group and linker), and the sense DNA was purchased with a biotin group attached to the 5′ end. The NHS-MAG3 was synthesized as previously described (10). Both the oligonucleotide 3′ end-labeling system and the deoxyadenosine 5′-(α-thio)-triphosphate [α-35S] (dATPαS[35S]) (NEN Life Science Products, Inc., Boston, MA), as well as uridine-5′-triphosphate [α-32P-UTP] (American Radiolabeled Chemicals, Inc., St. Louis, MO), were purchased. ACHN and the human colon cancer cell line (LS174T) were obtained from American Type Culture Collection (Manassas, VA). The murine cell line HC2, an NIH 3T3 transfectant cell line expressing the type III variant of epidermal growth factor receptor (EGFRvIII) was a gift from Drs. David K. Moscatello and Albert J. Wong (Thomas Jefferson University, Philadelphia, PA). The 99mTc was obtained from a 99Mo–99mTc radionuclide generator (DuPont Pharmaceuticals Co., Billerica, MA).
DNA Conjugation
The DNA was dissolved to a concentration of 5 μg/μL in 0.1 mol/L N-2-hydroxyethylpiperazine-N-2-ethanesulfonic acid (HEPES) buffer, pH 8.0. A fresh 10–20 mg/mL solution of NHS-MAG3 in dry N,N-dimethylformamide was added dropwise with agitation to a final chelator-to-DNA molar ratio of 15–20:1. The reaction mixture was then incubated at room temperature for 60 min before purification on a 0.7 × 20 cm P4 column (Bio-Rad, Hercules, CA) with 50 mmol/L phosphate buffer, pH 7.2, eluent. The peak fractions were collected and quantitated by a recording ultraviolet visible spectrophotometer (U-2000; Hitachi Instruments, Inc., Danbury, CT) at 260 nm (optical density = 33 μg/mL) and were dispensed at 10 μg per vial and stored at −20°C for future use.
The average number of MAG3 groups per molecule was determined by measuring the sulfhydryl concentrations using 4,4′-dithiodipyridine as indicator with absorbance measured at 324 nm (14). A 0.1 mg/mL solution of NHS-MAG3 hydrolyzed in pH 9.0 buffer for 1 h at room temperature was serially diluted in a 0.1 mol/L sodium bicarbonate buffer to provide 10 solutions of known sulfhydryl concentrations as standards over the range 0.0–120 μmol/L. To 100 μL of each of these solutions and to 100 μL of the DNA-MAG3 sample under investigation were added 100 μL of a 2 mmol/L solution of dithiodipyridine freshly prepared in 0.1 mol/L sodium phosphate buffer, pH 7.2. All samples were analyzed in triplicate. The absorbance was measured after 30 min at room temperature. The absorbance of solutions of native DNA treated in the identical manner was also determined, and the result was subtracted from that of the appropriate test solutions.
Melting Temperature Measurements
Melting temperature was measured commercially (Integrated DNA Technologies, Inc., Coralville, IA) and analyzed as previously described (15). The uniform phosphorothioate DNA concentrations were determined by ultraviolet absorbance at 25°C, and extinction coefficients were estimated using a nearest-neighbor model (16,17). Equimolar amounts of complementary phosphorothioate and native strands were mixed to form a duplex. The melting buffer contained 6.13 mmol/L sodium hydrogen phosphate, 3.89 mmol/L sodium dihydrogen phosphate, and 0.1 mmol/L sodium ethylenediaminetetraacetic acid (EDTA) with 100 mmol/L sodium chloride, pH 7.0 (total sodium ion concentration, 116.4 mmol/L). The EDTA was added to remove traces of divalent and trivalent ions that might bind to DNA and could influence the melting process. The DNA samples were dialyzed, using 3.5-kDa dialysis cassettes (Slide-A-Lyzer; Pierce Chemical Co., Rockford, IL), against the melting buffer for at least 24 h and were degassed by applying a vacuum in a Speed-Vac concentrator (Savant, Holbrook, NY) for less than 10 s. The weight measurements showed that <0.4% of the buffer evaporated during this procedure. Melting experiments were conducted on a DU 650 spectrophotometer (Beckman Coulter, Inc., Fullerton, CA) using a Micro Tm Analysis accessory (Beckman Coulter), a high-performance Peltier controller (Beckman Coulter), and 1-cm pathlength cuvettes. Because the original software had limited features, a more sophisticated program, TmColl, which controls melting experiments, was programmed in Turbo C++ (Borland Software Corp., Scotts Valley, CA) to run on a personal computer interfaced to the spectrophotometer. Absorbance at 268 nm was measured every 0.1°C in the temperature range 15°C–85°C. Both heating and cooling melting curves were recorded, and the rate of temperature change was 25°C/h.
Because the spectrophotometer was single-beam construction, melting curves of buffer alone were also collected in the same sample cuvettes and subtracted digitally from raw melting curves of DNA samples. This correction guaranteed that small changes in absorbance of the buffer with temperature did not contribute to the DNA melting curves. Thermistor thermometer 874C with type K thermocouple (Tegam, Inc., Madison, OH) was used to directly measure temperatures inside cuvettes. The difference between the temperature measured inside the cuvette by external probe and the temperature reported by the internal probe of the cell holder was close to the measurement error at <0.6°C. Therefore, only the internal probe was typically used. The fraction of broken base pairs (bp), θ, was calculated from the graph of raw absorbance versus temperature (18,19). Plots of θ versus temperature were smoothed by digital filtering (20). All sample temperatures at which θ equaled 0.5 were reproducible within 0.3°C.
Surface Plasmon Resonance Measurements
Biomolecular interaction analysis may be used to measure the rate of binding of an analyte on a surface to which its partner has been immobilized (21). In this investigation, the biotin-derivatized sense phosphorothioate DNA was added to a sensor chip coated with streptavidin and dextran (SA; Biacore, Inc., Piscataway, NJ) only until a response of about 200 resonance units (RUs) was reached. The analysis was performed on a BIACORE 1000 system (Biacore) operating at room temperature and injected using the KINJECT command. The native and MAG3-amide/linker-antisense DNAs were prepared identically at the same series of 6 concentrations (0.0–5.0 μmol/L) in the same running buffer (10 mmol/L HEPES, 150 mmol/L sodium chloride, 3.4 mmol/L sodium EDTA, 0.005% polyoxyethylenesorbitan, pH 7.4). The absence of mass transfer effects was confirmed by running 1 concentration of both DNAs at 3 different flow rates (10, 30, and 75 μL/min) and seeing identical RU responses. Each analysis consisted of 2 measurements. Before being applied to the sense DNA surface, a sample was first applied to a control surface. The control surface consisted of an identical streptavidin–dextran sensor chip immobilized at about the same level (i.e., 200 RUs) but with the biotin-derivatized antisense DNA. Subtraction of the sensorgram obtained with the control surface from that obtained with the test surface at each concentration corrected for bulk refractive index changes. After subtraction, the resulting sensorgrams were analyzed using instrument software (BIAevaluation 3.0; Biacore) by assuming 1:1 Langmuir interaction.
Radiolabeling
The radiolabeling of MAG3-DNA was similar to that previously described (10,11,22). Native and 5′ chemically modified DNAs were 3′ end-labeled with 35S using a 3′ end-terminal deoxynucleotidyl transferase labeling technique following the manufacturer’s instructions. A low dATPαS[35S]/DNA molar ratio of 1:30 was used to minimize the elongation of labeled DNAs. After labeling, each DNA was precipitated by the addition of 95% ethanol and the precipitate was rinsed with 75% ethanol to remove unreacted dATPαS[35S].
Reverse Transcriptase–Polymerase Chain Reaction
The ACHN cell line was examined for relative RIα mRNA expression by reverse transcriptase (RT)–polymerase chain reaction (PCR). Total RNA was extracted using a phenol and guanidine thiocyanate–based RNA extraction reagent (TRI Reagent; Molecular Research Center, Inc., Cincinnati, OH) following the manufacturer’s instructions. Briefly, cells growing in T75 flasks in monolayer were lysed directly once the medium was removed by adding the reagent to each flask, followed by repetitive pipetting of the cell lysate. Each lysate solution was then transferred to an Eppendorf tube, and chloroform was added. Each sample was vigorously agitated briefly and allowed to settle for approximately 15 min before centrifugation at 12,000g for 15 min at 4°C. The aqueous phase containing the RNA was transferred to a fresh Eppendorf tube, and the RNA was precipitated by the addition of isopropanol. The RNA precipitate was rinsed with 75% ethanol before being dissolved in nuclease-free water (Promega, Madison, WI). The concentration was determined by absorbance measured at 260 nm and was adjusted to 1 μg/μL in water.
RT-PCR was performed in a 1-tube system (Access RT-PCR Introductory System; Promega). Briefly, total RNA (1 μg) was diluted to a 50-μL reaction volume containing 5 U avian myeloblastosis virus (AMV) RT and 5 U Thermus flavus DNA polymerase. Reverse transcription was performed at 48°C for 45 min, followed by PCR with 35 cycles of amplification. The β2-microglobulin (β2m), a ubiquitous housekeeping gene, was used as an internal reference to ensure integrity of the RNA samples and PCR (23). The primers for human RIα mRNA were 5′-GAA CCA TGG AGT CTG GCA GT (sense, bases 83–102) and 5′-GTT TTG CCT CCT CCT TCT CC (antisense, bases 277–258). As RT-PCR control, the AMV RT was eliminated to ensure the absence of genomic DNA contamination in the RNA samples.
To obtain expression levels of RIα mRNA relative to the β2m mRNA, each PCR product was separated by gel electrophoresis in 1.5% agarose gel with a 1× concentration of buffer (40 mmol/L Tris, 0.114% glacial acetic acid, and 2 mmol/L sodium EDTA) containing 0.5 μg/mL ethidium bromide for fluorescence. The developed gel was visualized by ultraviolet transillumination and digitally acquired (Digital Science Electrophoresis Documentation and Analysis System 120; Eastman Kodak, Rochester, NY). The resulting fluorescence of the gel was analyzed dosimetrically using imaging software (Scion Corp., Frederick, MD). The relative level of RIα mRNA was expressed as a ratio of band intensity with that of the β2m.
Cell Culture
Cells were grown in minimum essential medium (MEM) (Gibco BRL Products, Gaithersburg, MD) with 2 mmol/L l-glutamine, 1.5 mg/L sodium bicarbonate, 0.1 mmol/L nonessential amino acids, and 1.0 mmol/L sodium pyruvate supplemented with 10% fetal bovine serum (FBS) and 100 mg/mL penicillin-streptomycin (Gibco). Cells were maintained as monolayers in a humidified 5% carbon dioxide atmosphere, normally in T75 flasks (Falcon; Becton Dickinson, Lincoln Park, NJ).
For uptake studies, the cells were trypsinated in the T75 flasks at 80%–90% confluence using 0.05% trypsin/0.02% EDTA and were then suspended in MEM with 10% FBS to the desired density, normally 1–2 × 10⁵ cells per milliliter. The cells were seeded to the wells of 24-well flat-bottomed plates at 1 mL per well and incubated at 37°C in 5% carbon dioxide for 24 h for adherence and growth. The wells of the plates were prewetted with 1 mL Dulbecco’s phosphate buffered saline (DPBS) (Gibco) to ensure homogeneity of cell adherence to the well bottom. The medium was changed to MEM with 1% FBS thereafter to slow cell growth, and the cells were cultured further for another 10 h or until 80% confluence was reached. Cell growth status and viability were monitored by inverted microscopy with phase contrast. Trypan blue exclusion was also used to assess viability.
Radiolabeled DNAs were dissolved in the same MEM with 1% FBS at a concentration of about 20–40 ng/mL (4–7 nmol/L), and 1 mL per well was added in quadruplet after normal medium was withdrawn. The time of addition (24, 12, 8, 4, 1, and 0 h) was staggered such that harvesting could occur simultaneously. At harvesting, the radioactive medium was aspirated and each well was then rinsed with 1 mL DPBS. The medium and rinse were combined and added to a scintillation vial (35S) or standard counting tube (99mTc). The cells were then lysed with 1 mL 0.2N sodium hydroxide and 1% sodium dodecyl sulfate. The well contents were collected into additional scintillation vials or counting tubes along with 1 mL of the same lysate solution used as a rinse. 35S radioactivity was determined by adding 18 mL scintillator (Complete Counting Cocktail; Research Products International Corp., Mount Prospect, IL) to each vial, and the samples were left undisturbed overnight before counting. In the case of 99mTc, tubes were counted directly in an automatic NaI(Tl) well counter. In the case of dual-radiolabel studies, tubes containing 99mTc were first counted, the samples were left to decay for up to 48 h or until 99mTc radioactivity was at background levels, and the contents of each tube were then transferred to scintillation vials containing scintillator for 35S counting.
The efflux of radioactivity from cells previously incubated with both 35S- and 99mTc-labeled DNA was investigated. In a dual-label study, multiple wells each received a total of 40 ng radiolabeled DNA in 1 mL solution and the cells were incubated for 16 h in the usual manner to maximize cell accumulation. The medium was then collected, the cells were rinsed twice with 1 mL DPBS, and 1 mL fresh medium was added. The cells were then reincubated. Periodically thereafter for the next 6 h, the medium was removed and replaced. At each time point, the medium was added to the 2 mL DPBS rinse. At the end of the 6 h (i.e., 22 h from the start of the study), the cells were harvested after rinsing. Radioactivity in each sample of medium plus wash and in the cells themselves was then determined. Cell-associated radioactivity was calculated and plotted against time to obtain the efflux curve.
Microautoradiography
Both the 35S-labeled antisense and sense DNAs were dissolved in the MEM medium with 1% FBS to a final concentration each of about 40 ng (18.5 kBq)/mL. To T75 flasks with about 107 cells were added 10 mL of each DNA after the medium was removed. After 4 and 24 h of incubation, the radioactive medium was removed and cells were washed 3 times with 20 mL DPBS before trypsinization. The dissociated cells were washed twice with 10 mL MEM without FBS followed by washing with 20 mL DPBS. The cells were suspended in DPBS at approximately 105 cells per milliliter. Monolayers of cells for autoradiography were prepared by smearing 20 μL cell suspension on each slide. The slides were air dried and fixed for 10 min in acetone that had been prechilled at 4°C. Autoradiography was performed as described previously (24). Briefly, the slides were dipped in 42°C liquid nuclear track emulsion (NTB2; Eastman Kodak) for 5 s, dried in a lighttight box overnight at room temperature, and then transferred to a refrigerator at 4°C for exposure. After 35S exposure for 60 d, the slides were developed with D-19 (Eastman Kodak) for 4 min, washed for 30 s in water, and fixed for 4 min in rapid fixer (Eastman Kodak). After fixation, the slides were washed for 10 min in running tap water. The slides were counterstained with hematoxylin–eosin (Sigma, St. Louis, MO) and mounted with Permount mounting medium (Electron Microscopy Services, Fort Washington, PA) for viewing. The autoradiography images were viewed and photographed with a light microscope (Olympus America Inc., Melville, NY).
RESULTS
Influence of MAG3-Chelator/Linker on DNA Hybridization
The influence of the MAG3/linker group on hybridization was determined by surface plasmon resonance measurements and by melting temperature measurements. By surface plasmon resonance, the dissociation rate of the DNA duplex was shown to be slow and outside the measurement range of the instrument. However, an association rate constant of 1.06 ± 0.07 × 10⁴ M−1 s−1 could be measured for native DNA, whereas the value for the MAG3-amide/ linker-DNA was 1.03 ± 0.05 × 10⁴ M−1 s−1 (mean ± SD, n = 5). The difference between these 2 values is not statistically significant (Student t test, P = 0.31).
The average melting temperatures (n = 3 or 4) for DNA duplex (by half θ) was 60.2°C for the native DNA, 60.9°C for the amine/linker-DNA, and 60.7°C for the MAG3-amide/linker-DNA. This range of values is within the experimental error for repeated measurements (approximately 0.5°C).
Radiolabeling
The number of MAG3 groups attached to each DNA molecule was 1.07 ± 0.06 (mean ± SD, n = 5). Radiolabeling efficiency typically was about 35%, and specific activity of 99mTc-labeled DNA was generally about 20 GBq/μmol (100 μCi/μg). The radiochemical purity was >95% after P4 column purification. Figure 1, trace A, presents a typical size-exclusion HPLC radiochromatogram of 99mTc-MAG3-DNA. Recovery in these analyses was typically about 70%. Under these conditions, radiolabeled oligonucleotides often show multiple peaks (8,25). The peak at 45 min elutes together with radiolabeled free MAG3 and is probably caused by this radiocontaminant. Trace B shows a shift in radioactivity profile toward a shorter retention time (i.e., higher molecular weight) after the addition of the biotinylated complementary DNA to which streptavidin was attached. The nearly quantitative shift in profile shows conclusively that the radiolabel was attached to DNA (control studies showed no appreciable nonspecific binding of the DNA to streptavidin itself). After incubation in 37°C fresh human serum at 2 μg/mL, binding of the radiolabel to serum proteins was nearly quantitative within 5 min. The radiochromatograms obtained over 24 h thereafter were essentially unchanged except for a small peak at low molecular weight that increased with time and was probably caused by labeled cysteine (26).

Size-exclusion HPLC radiochromatograms of 99mTc-labeled antisense MAG3-amide/linker-DNA before (A) and after (B) addition of streptavidin-biotin-sense DNA. Almost quantitative shift to higher molecular weight after addition of complementary DNA and streptavidin shows conclusively that 99mTc is labeling DNA.
The DNA was radiolabeled with 35S at a specific activity of about 37 kBq/μg. When stored at refrigerator temperatures, the radiolabel was stable for at least 2 wk as determined by ethanol precipitation.
Evaluation of Tissue Culture Model
By trypan blue exclusion, the viability of cells at all phases of this investigation was estimated to be no less than 98%. In addition, no evidence of cell growth arrest resulting from the addition of any of the DNAs was observed.
The suitability of the ACHN cell line for evaluating the behavior of DNAs with base sequences complementary to the base sequence of the RIα mRNA was shown in several ways. Figure 2 presents a digitized gel showing the location and intensity of bands caused by RIα mRNA (lanes 3 and 4, initial total RNA dosage of 1 and 2 μg, respectively) and β2m mRNA (lanes 1 and 2, initial total RNA dosage of 1 and 2 μg, respectively). In lane 5 are DNA standards, the sizes of which are indicated in bp. The sizes of the PCR products agree exactly with the size designed (RIα, 195 bp; β2m, 120 bp). The average ratio of band intensity for RIα mRNA versus β2m mRNA was 1.45. These results show that ACHN cells express the RIα gene to an extent acceptable for use as a model in this investigation.
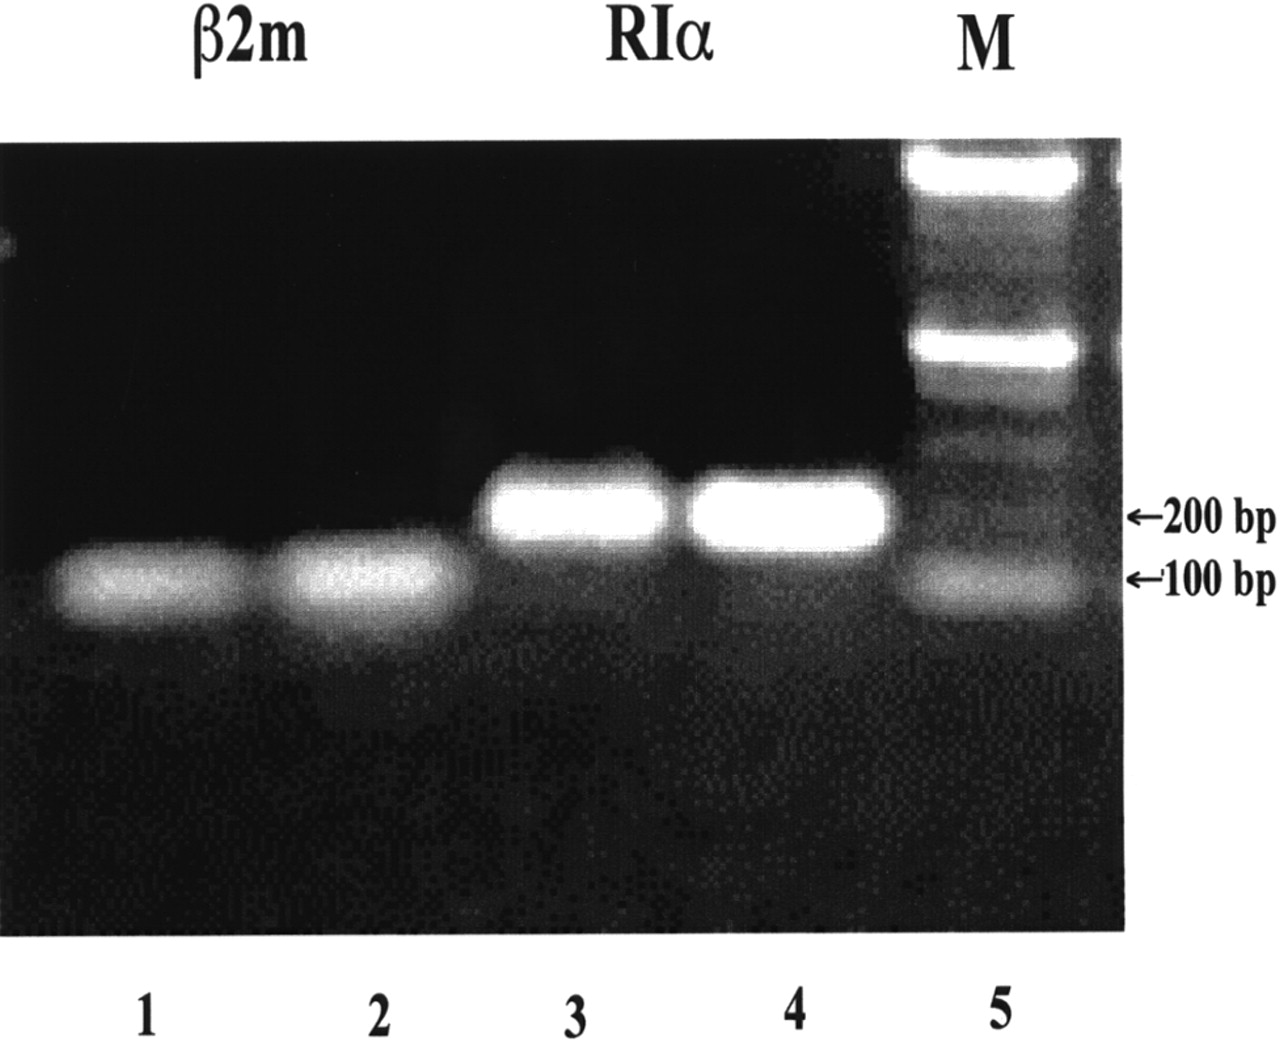
Gel electrophoretogram shows increased expression of RIα mRNA in ACHN cells relative to that of β2m housekeeping gene. M = DNA standard marker.
The validity of the model was also shown by the results of tissue culture incubations in which the cell accumulations of 35S-labeled antisense and sense DNAs with various 5′ modifications were compared. Figure 3A shows that a significantly (P < 0.05) higher accumulation of 35S on antisense DNA (native, with amine/linker, and with MAG3-amide/linker) compared with amine/linker-sense was evident after approximately 1 h. Figure 3B shows that when radiolabeled with 99mTc, the efflux is significantly slower at all time points for the antisense than for the sense DNA. As a control, the uptake of dATPαS[35S] was seen to be low at all time points considered (data not shown).
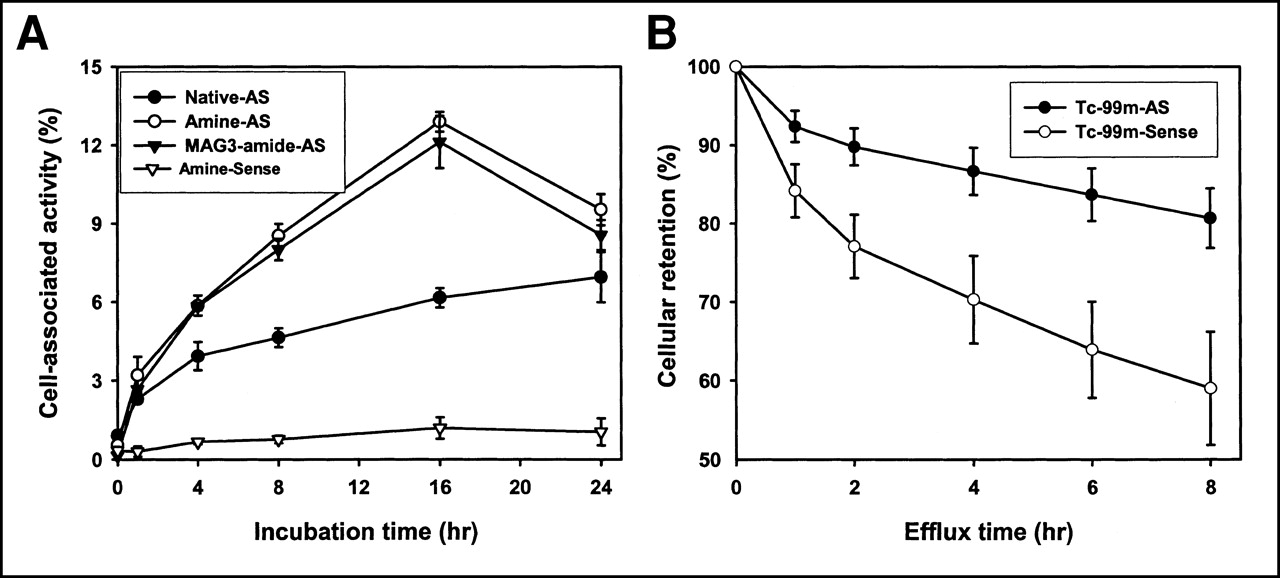
(A) Cell accumulation over time of 35S after incubation of ACHN cells with 3′ end-labeled native, amine/linker-, and MAG3-amide/linker-antisense DNA compared with amine/linker-sense (control) DNA. Significantly higher accumulation at most time points is evident for antisense DNAs relative to sense DNA. (B) Efflux of 99mTc from ACHN cells after 16 h of incubation with 99mTc-labeled MAG3-amide/linker-antisense and sense DNAs. AS = antisense.
At each time point, no difference in accumulation between the amine/linker-antisense DNA and the MAG3-amide/linker-antisense DNA was observed. It is apparent that the addition of an amine/linker and the conjugation of DNA with a MAG3 chelator group did not have a negative effect on the accumulation of DNA in cells. Surprisingly, lower uptake was associated with the native antisense DNA at most time points. Apparently, modification of DNA with the amine (amide)/linker had a positive effect on cell-associated radioactivity in this case.
35S and 99mTc Cell Accumulation
Figure 4A presents the results of a dual-label study in which both 35S- and 99mTc-labeled DNAs were added to the same wells at the same dosage (20 ng per well of each DNA) and incubated simultaneously. All DNAs were modified with a MAG3-amide/linker regardless of the label. As shown, the cell accumulations of both radiolabels were identical when they were added attached to the sense DNA. Once again, in the case of both radiolabels, the antisense DNAs showed significantly higher cell accumulation of the radiolabel than did the sense DNA. However, when attached to antisense DNA, 35S showed a higher cell accumulation than did 99mTc. Figure 4B shows the percentage of 35S and 99mTc radioactivity leaving the cells over 6 h after washing and replacement of the medium. The cells had been incubated over the previous 16 h with MAG3-amide/linker-DNA. No statistically significant differences in efflux between the 2 radiolabels (P < 0.05; n = 4) were found at any time points, showing that efflux was similar for both radiolabels over this period. Thus, the lower cellular accumulation of 99mTc seen in Figure 4A was probably not caused by increased efflux.
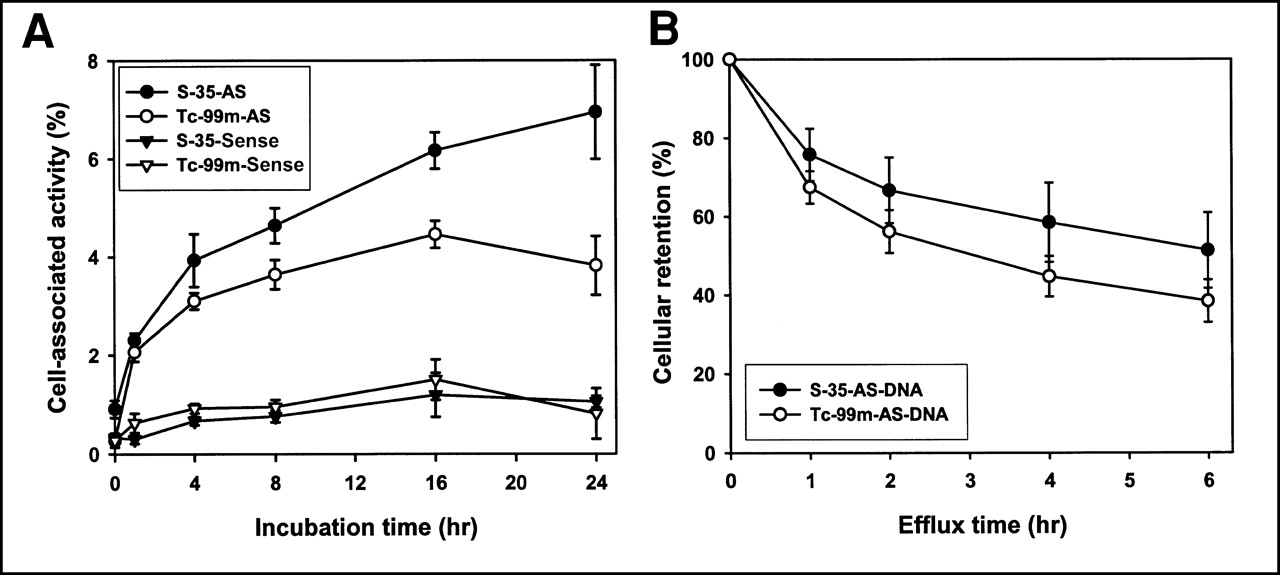
(A) Cell accumulation over time of MAG3/linker-antisense and MAG3/linker-sense DNA radiolabeled with 35S or 99mTc. Significantly higher accumulation at most time points is evident for both antisense DNAs relative to both sense DNAs. Accumulation of 99mTc is lower than that of 35S when attached to antisense DNA. (B) Efflux of 35S and 99mTc from ACHN cells after 16 h of incubation with 35S- and 99mTc-labeled MAG3-amide/linker-antisense DNA. AS = antisense.
Microautoradiography
A differential antisense accumulation was also visualized with microautoradiography. ACHN cells were incubated with 35S-labeled antisense and sense DNAs for 4 and 24 h. The results are presented in Figure 5. The cell-associated radioactivity appears to be uniformly distributed throughout the cell, consistent with internalization. In addition, the accumulation of the radiotracer on antisense DNA is obviously higher than that on sense DNA.
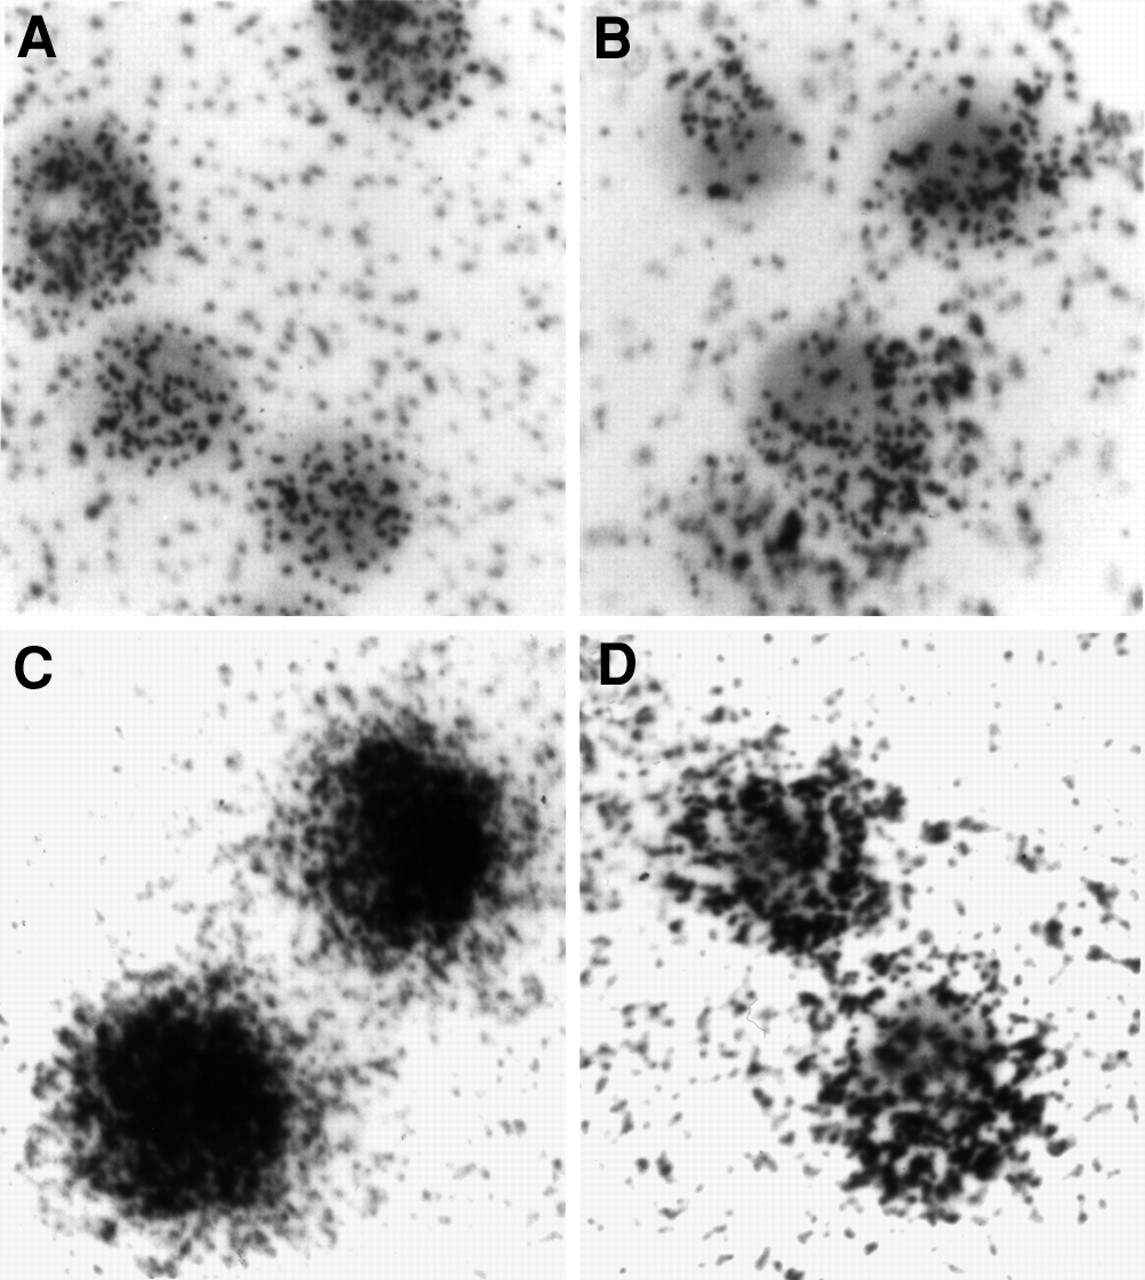
Microautoradiography images at ×400 magnification of ACHN cells incubated with 35S-labeled antisense and sense DNAs for 4 h (antisense [A]; sense [B]) and 24 h (antisense [C]; sense [D]).
Additional Evidence of Antisense Mechanism
Use of Additional Positive Cell Line.
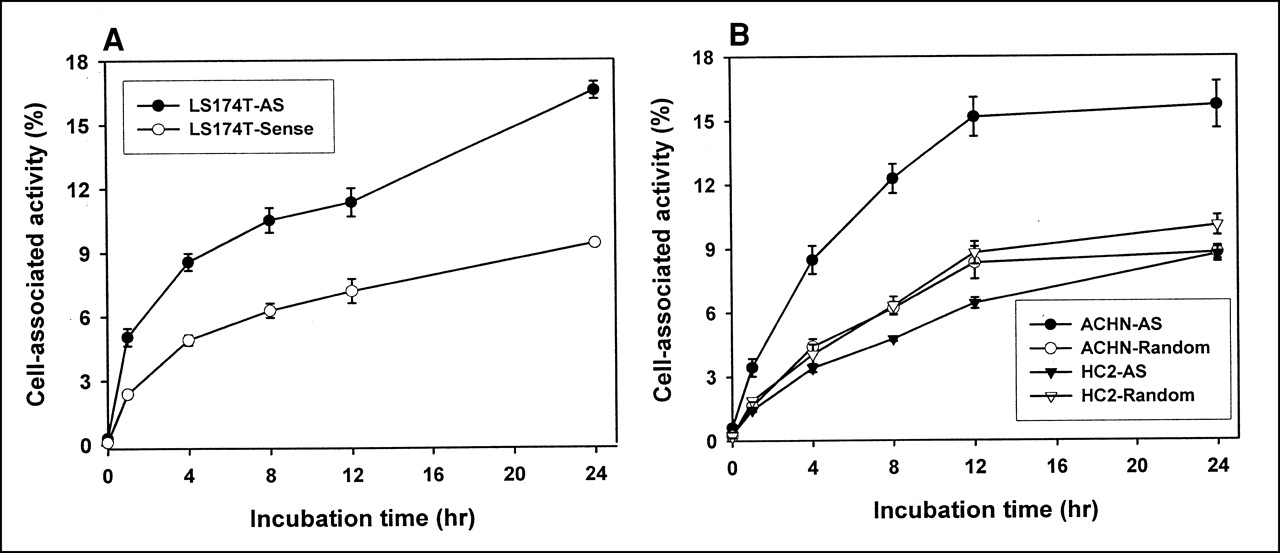
To obtain evidence against an aptameric effect explaining the higher accumulation of the antisense DNA in ACHN cells, we repeated the studies using LS174T cells, an additional RIα-positive cell line (27). As shown in Figure 6A, once again a significantly higher accumulation of 99mTc was observed for the antisense than for the sense DNAs at all time points considered.

(A) Cell accumulation over time of 99mTc-labeled antisense and sense DNA in LS174T cells. These cells also express target RIα mRNA. (B) Cell accumulation over time of 99mTc-labeled antisense and sense DNA in HC-2 cells (compared with RIα mRNA–positive ACHN cells). These cells do not express target RIα mRNA. AS = antisense.
Use of Negative Murine Control Cell Line.
Figure 6B compares the results obtained for the ACHN cell line with those for an RIα-negative cell line, HC2 (HC2 20 d2/c, an NIH 3T3 transfectant cell line expressing EGFRvIII (28)), for both 99mTc-labeled antisense and random DNA. The antisense base sequence has no homology with the base sequence of the murine RIα mRNA as listed in the GenBank (National Institutes of Health, Bethesda, MD). Both cell lines were studied simultaneously, and the results have been normalized to the same number of cells per well (5 × 10⁵) for direct comparison. Unlike the results obtained for both of the RIα-positive cell lines, an increased accumulation of the antisense DNA was not observed in this control cell line.
Effect of Tracer Dosages of Antisense DNA on Target mRNA Expression.
RT-PCR was used to assess the effect of tracer dosages (7 nmol/L) of 99mTc-labeled antisense DNA on the level of target RIα mRNA. ACHN cells were cultured with labeled antisense and random DNA for 24 h. As before, the β2m housekeeping gene was coamplified as an internal reference to ensure PCR integrity (23). The average ratio of band intensity for RIα mRNA compared with β2m mRNA in cells exposed to both sense and random control DNAs was 1.5 ± 0.09 and therefore identical to that found for ACHN cells. However, the ratio increased significantly (P = 0.017; n = 4) to 2.1 ± 0.27 in cells exposed to the antisense DNA.
Effect of Tracer Dosages of Antisense DNA on RNA Synthesis.
ACHN cells were cultured with α-32P-UTP in the presence of tracer concentrations (7 nmol/L) of antisense, random, or no DNA (i.e., blank) for 24 h. Total RNA from each sample was extracted with TRI Reagent and counted. With respect to the blank control at 100%, the α-32P-UTP incorporation in total RNA in 106 cells was 132% ± 23% for cells exposed to the antisense DNA, compared with 103% ± 18% for cells exposed to the random DNA (n = 4). The 32P incorporation is significantly higher for the antisense than for either the random or the blank control (P < 0.05), indicating an elevated RNA synthesis in the presence of antisense DNA.
Effect of an Increasing Dosage on Cell Accumulation of Antisense DNA.
Finally, the influence of increasing the dosage of the unlabeled antisense and sense DNAs added to the 99mTc-labeled antisense and sense DNAs (3.5 nmol/L), respectively, is shown in Table 1 for 24 h of incubation. Accumulation of radiolabeled antisense DNA decreases more rapidly with increasing loading than does accumulation of sense DNA, as expected for specific accumulations, such that the significant difference disappears at a concentration of about 175 ng/mL (30 nmol/L) or higher.
Cellular Accumulation of 99mTc-Labeled Antisense and Sense DNA with Different Dosages of Unlabeled DNA in 2 × 10⁵ Cells
DISCUSSION
We selected for this study an 18mer uniform phosphorothioate DNA antisense to the mRNA of RIα of protein kinase A radiolabeled with 99mTc using MAG3 as a chelator. The target and base sequences were selected, in part, because of the satisfactory therapeutic benefit that others have observed for a variety of cancers (13,29–31). The uniform phosphorothioate backbone was selected to conform with that used in most of these therapeutic studies. In agreement with reports of antisense cellular uptake of this DNA, the microautoradiographs of Figure 5 show uniform distribution of 35S-labeled DNA in ACHN cells. ACHN cells were selected because the RIα mRNA has been reported to be expressed in this cell line (13), and we confirmed that finding (Fig. 2). Finally, the MAG3 chelator for 99mTc labeling was selected for convenience and with the knowledge that we have used this labeling strategy successfully in several previous investigations. In a previous investigation from this laboratory using size-exclusion HPLC, extensive protein binding was observed in cell lysate incubations as expected for a phosphorothioate DNA (32), but the radiolabel was “stable” in that about one quarter of the radioactivity was still on viable DNA after 24 h in cells (11).
This investigation had 2 major goals. The first was to determine whether 1 method of chemically modifying DNA to facilitate radiolabeling with 99mTc influences either its hybridization properties or cell accumulation. The second was to establish to a reasonable extent whether the cellular accumulations could be explained by an antisense mechanism.
There have been several previous attempts to establish the influence on hybridization properties of chemical modifications required for oligomer radiolabeling (6–9). However, hybridization affinities for the modified relative to the native oligomer have not been previously reported. We have now evaluated the influence on hybridization of attaching a primary amine and a 6-member alkyl linker to the 5′ end of an antisense DNA and conjugating the amine with NHS-MAG3. By surface plasmon resonance measurements at room temperature, no significant differences in the kinetics of hybridization were observed between immobilized sense DNA and either the native antisense DNA or the antisense DNA with a 5′ MAG3-amide/linker attached. Furthermore, no significant differences in melting temperature were observed for duplexes between sense DNA and either the native, amine/linker, or MAG3-amide/linker antisense DNA. These observations are therefore consistent with the absence of influences on hybridization as reported by previous investigators. For example, we have reported identical association rate constants for the above antisense DNA conjugated with hydrazinonicotinamide (HYNIC) and diethylenetriaminepentaacetic acid (DTPA) in comparison with MAG3 (11). Therefore, we can conclude that neither N-hydroxysuccinimide esters nor anhydrides chemically alter the nitrogenous bases comprising DNA under the conditions of these investigations.
The influence of chemical modifications on cellular accumulations may be more important. To our knowledge, the issue of cell accumulation of antisense oligomers chemically modified to permit radiolabeling with 99mTc or other imaging radionuclides has not been previously considered. In a comparison study of MAG3-, HYNIC-, and DTPA-conjugated DNA, we recently observed that the 99mTc radiolabel showed significant differences in accumulation in cultured ACHN cells (11). These observations were ascribed to differences in cellular efflux resulting from the chemical modifications. More definitive evidence on the influence of chemical modification on cellular accumulation is evident from this study. As shown in Figure 3, when radiolabeled with 35S in the identical fashion, the native DNA showed lower accumulation relative to either the amide/linker-DNA or the MAG3-amide/linker-DNA. The attachment of an amine (amide)/linker has either increased cellular transport (influx) or decreased efflux of the DNA. An increased influx may be explained by increased lipophilicity introduced by the modification. Further evidence for the influence of chemical modification may also be apparent in Figure 4, which shows increased accumulation of 35S relative to 99mTc despite the presence of both labels on the same MAG3-amide/linker-DNA. Because we have also shown identical efflux for both radiolabels (Fig. 4B), the difference must be caused by different influx. This difference may be related in some way to instability of the 99mTc label, but another possible explanation is that the addition of the technetium atom to the chelate may decrease cellular membrane transport.
The second goal of this investigation was to establish whether an antisense mechanism could explain the increased cellular accumulation of the antisense DNA. Because favorable results were obtained with 35S as well as with 99mTc, the possibility that instability of the 99mTc label could explain the increased accumulation may be excluded. Another possibility is that an aptameric effect, in which the antisense DNA, because of its particular 3-dimensional configuration, shows an affinity for a binding protein in ACHN cells may explain our results. However, this possibility became more unlikely when we were able to show similar increased accumulation for another RIα-positive cell line (LS174T) and the absence of increased accumulation for an RIα-negative cell line (HC-2) (Fig. 6). We have also observed a disappearance of the increased accumulation with increasing dosages of antisense DNA, as expected for specific binding (Table 1). Taken together, these observations suggest that the observed accumulation of radioactivity in cells exposed to antisense DNA under the conditions of this investigation may be caused, at least in part, by an antisense mechanism.
Only a few tissue culture studies with radiolabeled antisense DNAs have been reported, and not all have observed a putative antisense effect (33). Our results suggest that an antisense effect may easily be obscured by nonspecific cellular accumulations if concentrations are higher than nanomolar (Table 1).
In this investigation, we were able to show a significantly higher accumulation of the radiolabeled antisense compared with both sense and random control DNAs (Figs. 3–6). If a cellular volume of 10−11 L is assumed, the intracellular concentration of antisense DNA may be calculated as approximately 10-fold higher than the concentration in the cell culture medium. Thus, these cellular concentrations cannot be explained by passive diffusion alone.
From the tissue culture results and the known specific activity of the radiolabeled DNAs, the specific accumulation (i.e., antisense minus sense or random control DNAs) is easily calculated to amount to approximately 105 antisense DNA molecules per cell at 24 h. Similar calculations can show that other previous investigators of radiolabeled antisense DNAs have also achieved similarly high accumulations in tissue culture (34). Totals as high as 107 DNAs per cell have been measured in connection with studies of antisense chemotherapy (35). These specific accumulations are many orders of magnitude greater than the steady-state target mRNA concentrations, which are usually assumed to be in the range of 1–1,000 copies per cell (36). One potential mechanism for specific accumulations of the observed magnitude requires that the targeted mRNA be stabilized by hybridization with the antisense DNA. Stabilization of the duplex may help to retain the antisense DNA within the cell along with its radiolabel. However, phosphorothioate DNAs such as those used in this study are thought to degrade targeted mRNAs (37). A decrease in targeted mRNA cellular concentrations after treatment with antisense phosphorothioate DNAs is a common observation (30) but is usually seen at much higher doses (μmol/L) than that used here (nmol/L). In support of this suggestion, we have shown by RT-PCR an increase rather than a decrease in the RIα mRNA concentration in cells exposed to tracer concentrations of antisense DNA.
The observed increase in RIα mRNA concentration in cells exposed to the antisense DNA may also be explained by the presumed decreased cellular concentration of the RIα protein by translation arrest after hybridization. If the RIα protein functions in a feedback fashion to downregulate transcription of the RIα mRNA, its decreased concentration could also explain an increase in mRNA concentration. This could, at least partially, explain the observed increased α-32P-UTP incorporation into newly synthesized RNA in cells exposed to antisense DNA.
CONCLUSION
The results of this investigation, although strictly applying to only 1 antisense DNA and 1 target cell type, by being added to the observations of others make increasingly clear that hybridization may not be influenced by certain chemical modifications related to radiolabeling with γ- or positron-emitting radionuclides. However, these and other chemical modifications can have unpredictable and important effects on cell membrane transport and, therefore, on cellular accumulation of the radiolabel.
We were also able to show high cellular specific accumulations of antisense DNAs, suggesting that the intracellular presence of the antisense DNA at low concentrations may stabilize the target mRNAs. This proposed mechanism implies that the mRNA turnover/transcription rate may be as important in determining the specific accumulation (and therefore the tissue counting rate) as is the steady-state concentration. We conclude that predictions based on only steady-state mRNA copy numbers may underestimate the counting rates achievable by antisense targeting and that transcription/turnover rates may need to be considered as well.
Acknowledgments
The authors thank Richard Owczarzy and Lisa Bogh (Integrated DNA Technologies, Inc.) for measuring the melting temperatures, Ken Miller (Biacore, Inc.) for many helpful discussions on surface plasmon resonance, James Pullman (Department of Pathology, University of Massachusetts Medical School, Worcester, MA) for photographing our microautoradiographs, and Suresh Gupta for helping with the BIACORE analysis. The authors also appreciate the helpful comments of Howard Sands. This study was supported in part by the U.S. Department of Energy (DE-FG02-99ER62781).
Footnotes
Received Oct. 31, 2000; revision accepted Feb. 20, 2001.
For correspondence or reprints contact: Donald J. Hnatowich, PhD, Department of Radiology, University of Massachusetts Medical School, Worcester, MA 01655.
REFERENCES
In this issue


Jump to section
Related Articles
Cited By...
- Noninvasive Imaging of Human Telomerase Reverse Transcriptase (hTERT) Messenger RNA with 99mTc-Radiolabeled Antisense Probes in Malignant Tumors
- Imaging Cerebral Gene Transcripts in Live Animals
- Initial Mechanistic Studies of Antisense Targeting in Cells
- Antisense Targeting of P-Glycoprotein Expression in Tissue Culture
- In vivo imaging with oligonucleotides for diagnosis and drug development
- Sense, Antisense, and Common Sense