


Abstract
The identification of discrete patterns of altered functional brain circuitry in preclinical Huntington’s disease (HD) gene carriers is important to understanding the pathophysiology of this disorder and could be useful as a biologic disease marker. The purpose of this study was to use PET imaging of regional cerebral glucose metabolism to identify abnormal networks of brain regions that are specifically related to the preclinical phase of HD. Methods: Eighteen presymptomatic HD gene carriers, 13 early-stage HD patients, and 8 age-matched gene-negative relatives were scanned using PET with [18F]FDG to quantify regional glucose utilization. A network modeling strategy was applied to the FDG PET data to identify disease-related regional metabolic covariance patterns in the preclinical HD cohort. The outcome measures were the region weights defining the metabolic topography of the HD gene carriers and the subject scores quantifying the expression of the pattern in individual subjects. Results: Network analysis of the presymptomatic carriers and the gene-negative control subjects revealed a significant metabolic covariance pattern characterized by caudate and putamenal hypometabolism but also included mediotemporal metabolic reductions as well as relative metabolic increases in the occipital cortex. Subject scores for this pattern were abnormally elevated in the preclinical group compared with those of the control group (P < 0.005) and in the early symptomatic group compared with those of the presymptomatic group (P < 0.005). Conclusion: These findings show that FDG PET with network analysis can be used to identify specific patterns of abnormal brain function in preclinical HD. The presence of discrete patterns of metabolic abnormality in preclinical HD carriers may provide a useful means of quantifying the rate of disease progression during the earliest phases of this illness.
Huntington’s disease (HD) is a hereditary neurodegenerative disorder characterized by progressively worsening abnormalities of movement and cognition. The genetic mutation underlying this condition is an unstable expanded DNA trinucleotide (cytosine-adenosine-guanoside [CAG]) repeat within the coding region of a 348-kDa protein (huntingtin) on the 4p16.3 segment of chromosome 4. PET has been used to identify function abnormalities in the brains of HD gene carriers preclinically and after the onset of symptoms. Similarly, [18F]FDG has been used with PET to detect local abnormalities in regional glucose utilization associated with HD. FDG PET studies in symptomatic HD patients have consistently revealed reduced striatal metabolic rates (1–4). However, in the early symptomatic phases of HD, only caudate hypometabolism has been reliably identified, and putamenal metabolism may be normal (2). In contrast, FDG PET data in presymptomatic individuals at risk have been inconsistent, with some studies showing normal metabolic rates (5) and others showing reduced levels of striatal glucose metabolism (6–9). Thus, although these data indicate that consistent PET abnormalities may be identified in symptomatic HD patients, this may not be the case in the preclinical period.
Similarly, PET studies of postsynaptic dopamine (D2) receptors with [11C]raclopride (RAC) have observed reduced striatal D2 binding in symptomatic HD patients (6,10). However, in the preclinical period, striatal D2 binding has been reported variably to be either normal or reduced in individual HD gene carriers (6,11).
Imaging markers of disease progression may be helpful in assessing the efficacy of potential neuroprotective interventions to retard the onset of symptoms in individuals at risk. Indeed, in HD, the use of reliable imaging markers may be especially relevant in that the rate of progression may change after clinical onset (12). In this PET investigation of early-stage HD, we applied the network modeling strategy that we developed previously for the study of patients with genetically mediated hyperkinetic movement disorders (13). In this approach, patterns relating to gene carrier status independent of symptoms are identified through the network analysis of FDG PET data from preclinical gene carriers and gene-negative control subjects. By applying this analytic method to HD gene carriers, we identified a distinct regional metabolic covariance pattern relating to the preclinical phase of the illness.
MATERIALS AND METHODS
HD-Positive Gene Carriers
Group A.
Eighteen preclinical carriers of the HD mutation (mean age ± SD, 34.4 ± 8.8 y; CAG repeat length, 43.9 ± 1.5) were evaluated and had normal neurologic evaluations (6). Subjects in this group were divided into those with normal RAC binding (n = 6; RAC−/CLIN−) and those with abnormally reduced RAC binding (n = 12; RAC+/CLIN−).
Group B.
Thirteen early-stage symptomatic HD patients were evaluated (mean age, 38.4 ± 7.1 y; CAG repeat length, 46.2 ± 3.1; RAC+/CLIN+). These patients were rated at stage I according to the Shoulson and Fahn scale (14) and had a disease duration of <2.5 y.
Control Subjects
Eight clinically normal, mutation-negative relatives of the patients were evaluated (mean age, 29.4 ± 3.8 y). These gene-negative subjects were matched in age with the preclinical HD gene carriers. Limited imaging data for 10 of the 18 presymptomatic gene-positive individuals and for 8 of the 13 early symptomatic patients have been reported (6). To our knowledge, network analysis of the FDG PET data has not been reported previously.
Written informed consent was obtained from all participants under a protocol approved by the institutional review board of the ethics committee of Zurich University Hospital.
PET Imaging
PET studies were performed using a CTI/Siemens 933/04-16 scanner (CTI/Siemens, Knoxville, TN). This 4-ring tomograph records 7 contiguous planes (width, 8 mm) simultaneously with an in-plane transaxial resolution of 8 mm full width at half maximum after image reconstruction. Each mutation carrier was scanned with FDG and RAC in separate PET sessions as described (6).
On the FDG PET scans, we calculated regional cerebral metabolic rates for glucose (rCMRGlc) on a pixel-by-pixel basis as described (6). Quantitative brain images were transformed into the coordinate system described by Talairach and Tournoux (15), and 28 standardized gray matter regions of interest were placed on each set of images using an automated routine blind to gene status and clinical designation (16). To reduce intersubject variability, rCMRGlc values were ratio-normalized by the global metabolic rate.
Data Analysis
We used a network analytic strategy for the identification of specific metabolic topographies that we applied previously to the study of hereditary hyperkinetic movement disorders (13). This approach uses the scaled subprofile model (SSM) (17) and principal components analysis (PCA) to identify significant patterns of regional metabolic covariation in combined rCMRGlc datasets from patient and control groups. The SSM/PCA procedure is conducted blind to clinical and genetic status. It does not impose a priori assumptions regarding either the contributions of specific regions to the covariance pattern or the anatomic–functional relationships among the contributing regions.
Once individual covariance patterns (principal components [PCs]) are identified by PCA, we then determine whether 1 of these is relevant to HD. This is accomplished by performing discriminant analysis on the PC subject scores to identify those that can accurately distinguish (P < 0.01) the asymptomatic HD gene carriers from the age-matched, gene-negative control subjects. In previous network analyses of FDG PET scans (13,18), we found that most often only the first and the second PCs (i.e., those with the very highest effect sizes [eigenvalues]) account for sufficient variance in the subject × region data to be considered meaningful. If subject scores for 1 of these 2 PCs, singly or in linear combination, are shown to discriminate the 2 groups, then the network analysis is considered to be significant for a disease-related effect. On the other hand, if neither of these patterns discriminates the 2 groups, then the network analysis is considered to be negative. To be as conservative as possible in the interpretation of this exploratory covariance analysis, we did not consider the less significant PCs (PC3 or higher).
To identify metabolic topographies that are related to HD mutation carrier status in the absence of clinical manifestations, we analyzed combined rCMRGlc data from the preclinical gene carriers and the age-matched, gene-negative control subjects (13,18,19). To reduce the potential confound of local striatal atrophy, we included in the network analysis only those early-stage preclinical HD gene carriers with normal striatal D2 binding (RAC−/CLIN−). This cohort, reported by us (6), was comprised of 6 subjects with caudate and putamenal RAC binding falling within 2 SDs of mean control values. In this SSM/PCA, we designated the covariance pattern whose subject scores maximally discriminated these gene carriers from the gene-negative control subjects (P < 0.05; F test according to Wilks’ λ) as the HD-related pattern (HDRP).
Network region weights were mapped onto standardized Talairach MRI sections as described (13,20). This process produces an image for which the maximum corresponds to the region weight, and other pixels are modulated by the foreground pixel variation. This allows for better discrimination of brain topology and the relative contribution of regional pixel values. Subject scores for the SSM network were z-transformed and offset to a mean of 0 for the control group. Thus, individual subject scores were interpreted relative to an adjusted metabolic baseline defined by the gene-negative control group. The polarities of the covariance patterns were oriented so that subject scores for the patient subgroup had positive values (19).
We used topographic profile rating (21,22) to determine whether the candidate HDRP topography was expressed in the cohorts that were not included in the pattern identification stage of the analysis. Specifically, we hypothesized that as a marker of carrier status, the HDRP should be present in the more advanced preclinical gene carriers (i.e., those with reduced striatal D2 receptor binding) as well as in the symptomatic HD patients. The computed HDRP subject scores for these gene carriers were compared with those for the early-stage preclinical carriers and the gene-negative control subjects using ANOVA followed by posthoc group comparisons according to Dunnett’s method (23). Subject score differences between groups were considered significant for P < 0.05.
RESULTS
Regional Glucose Metabolism
ANOVA revealed a significant reduction in normalized caudate and putamenal metabolism across the cohorts ([F3,35 = 36.7; P < 0.0001] and [F3,35 = 20.0; P < 0.0001], respectively). Posthoc testing revealed significant metabolic reductions in the caudate and the putamen in the symptomatic and the preclinical groups with low RAC binding compared with those of the preclinical gene carriers with normal striatal RAC binding and the gene-negative control group. The presymptomatic gene carriers with normal striatal D2 binding did not differ significantly from gene-negative control subjects in either caudate or putamenal glucose metabolism.
Network Analysis
An SSM/PCA was performed on the rCMRGlc data from the combined group of the 6 early-stage preclinical carriers and the 8 healthy control subjects. In this analysis, the first principal component (PC1) accounted for 34% of the subject × region variance. Region weights for this pattern are presented in Table 1. Its topography (Fig. 1) was characterized by relative hypometabolism of the caudate and lentiform nuclei and the mesial temporal cortex, covarying with metabolic increases in the occipital cortex. These regions had pattern weights with an absolute value of ≥1. In each of these regions, at least 35% of the variability in normalized rCMRGlc was predicted by subject differences in pattern expression (P < 0.01) (20). Subject scores for this pattern were elevated in the preclinical gene carriers compared with those of the gene-negative control subjects (P < 0.005) (Fig. 2, left). Subject scores for the PCs of lower effect size (eigenvalue)—that is, PC2 and higher—failed to distinguish between the 2 groups.
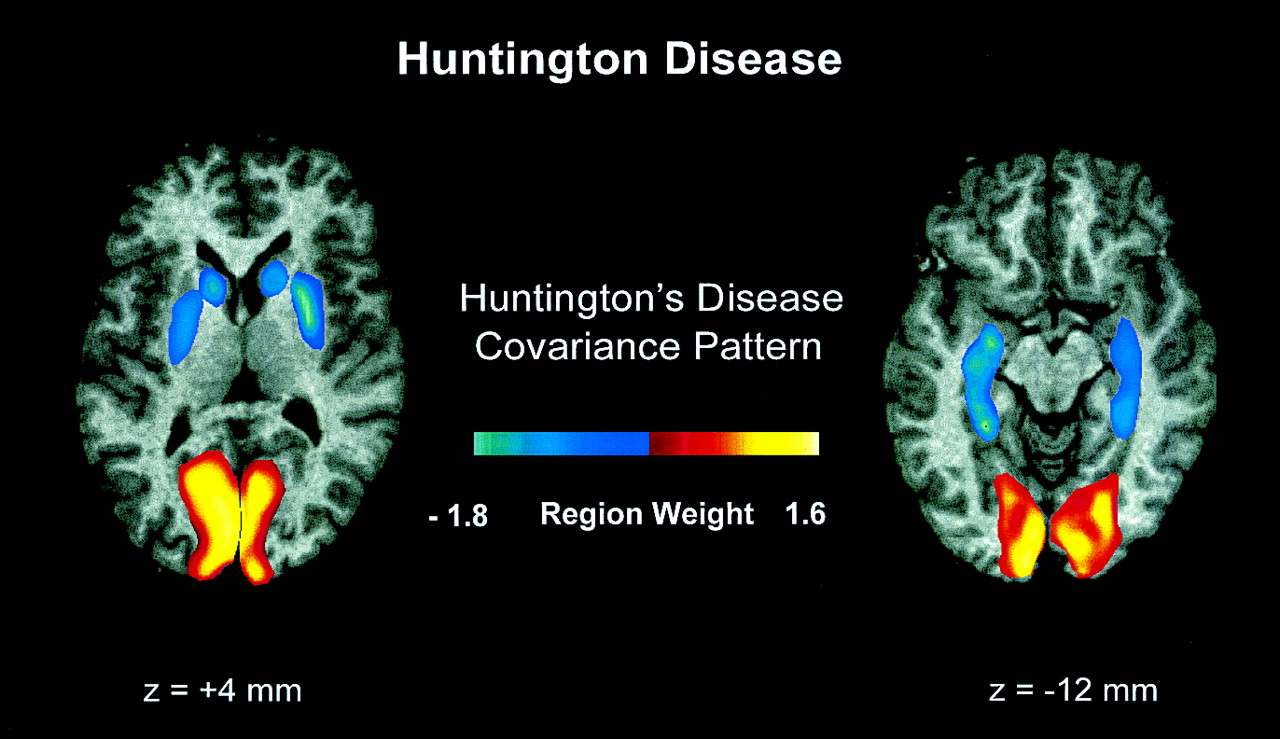
Display of region weights of scaled SSM topography associated with HD overlaid on standardized Talairach MRI sections (13,20). Regional metabolic covariance pattern was identified in PET data from combined group comprised of 6 neurologically normal, presymptomatic HD gene carriers with normal striatal D2 receptor binding and 8 age-matched, gene-negative control subjects. Topography was characterized by relative decreases in striatal and mediotemporal metabolism covarying with metabolic increases in occipital region. We designated this topography as HDRP.

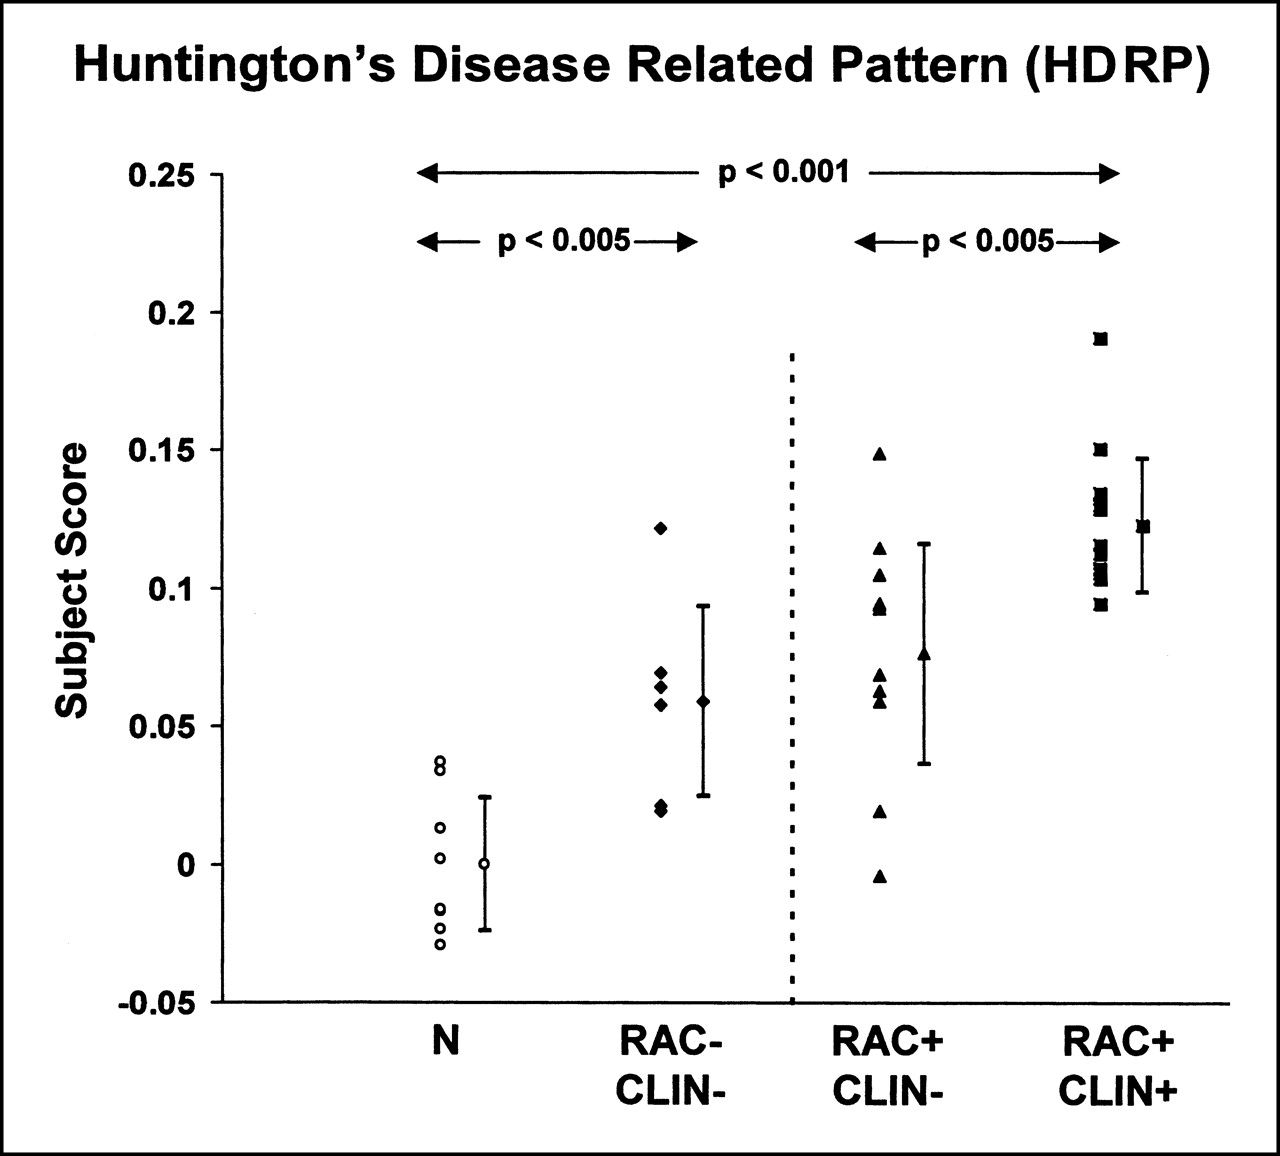
(Left) Scatter diagram of the HDRP subject scores for gene-negative control subjects (N) and for presymptomatic HD gene carriers with normal striatal D2 receptor binding (RAC−/CLIN−). (Right) Scatter diagram of HDRP subject scores computed prospectively on individual basis for presymptomatic gene carriers with reduced striatal D2 receptor binding (RAC+/CLIN−) and for affected HD patients (RAC+/CLIN+). HDRP subject scores were abnormally elevated (P < 0.001) in presymptomatic and clinically affected HD patients. (Subject scores were z-scored and offset to mean value of 0 for gene-negative control subjects. Error bars indicate subgroup SDs.)
Region Weights for Metabolic Covariance Pattern Associated with HD (HDRP)
We next computed subject scores for this pattern on a prospective case basis in the more advanced gene carriers—that is, those with low striatal D2 binding (RAC+/CLIN−), clinical symptoms (RAC+/CLIN+), or both. We found an abnormal increase in the expression of the HDRP in both of these groups (P < 0.005) (Fig. 2, right). HDRP subject scores were elevated to a greater degree in the symptomatic HD patients compared with those of each of preclinical subgroups (P < 0.005). The 2 presymptomatic groups did not differ significantly in the expression of this pattern.
DISCUSSION
Reductions in striatal glucose metabolism are a well-established feature of symptomatic HD and, more variably, of the preclinical gene carrier state (1–4,6). Our findings using FDG PET with network analysis indicate that striatal metabolic reductions covary with cerebral cortical changes as part of a distinct metabolic pattern present in the preclinical and early symptomatic phases of disease. Indeed, abnormal expression of this pattern in asymptomatic gene carriers may occur when striatal D2 receptor binding is still relatively preserved. Our results also suggest that the transition to clinical symptomatology appears to involve increased expression of this HDRP.
The HDRP topography is associated with striatal metabolic reductions covarying with metabolic reductions in the temporal cortex. We interpret this finding as indicative of an early derangement in striatal connectivity. Specifically, projections from the ventrocaudal neostriatum (ventral putamen and tail of the caudate) to the inferotemporal cortex have been described in rhesus monkeys (24). Moreover, very early pathologic changes in HD have been noted in the tail of the caudate (25). Thus, a discrete disturbance of these striatotemporal projections may underlie aspects of the psychiatric and cognitive abnormalities associated with the earliest stages of HD before the onset of motor signs (26,27).
In addition to striatotemporal metabolic decrements, the HDRP topography is associated with relative increases in occipital metabolism. This finding raises the possibility of active metabolic demand in this region, perhaps through excitotoxic mechanisms. Indeed, glutamate concentrations have been found to be specifically elevated in the occipital cortex of HD patients examined at postmortem (28). Moreover, in vivo proton magnetic resonance spectroscopy has revealed elevations of brain lactate in the occipital lobes of HD patients and carriers (29). Although relative occipital hypermetabolism is identifiable through network analysis, we note that this regional contribution to the preclinical HDRP covariance topography does not necessarily indicate functional connectivity with the other brain regions comprising this pattern. Indeed, the role of the occipital cortex in this disease-related topography remains uncertain, and further imaging and physiologic studies are needed to clarify the role of this pattern-related metabolic abnormality in the overall functional pathology of HD.
The expression of the HDRP was elevated in the subgroup of asymptomatic gene carriers with normal striatal RAC binding. This finding raises the possibility that metabolic network abnormalities may be present in preclinical HD mutation carriers at a time when their striatal D2 receptor binding is relatively preserved and when there is likely to be little, if any, brain atrophy. Conceivably, early in the presymptomatic phase of HD, derangements in striatal cellular energetics produce abnormalities in brain metabolism and network organization in advance of the appearance of measurable losses in D2 neuroreceptor function and volume loss. Nonetheless, we cannot exclude the possibility that meaningful losses in striatal D2 neuroreceptor binding have already occurred at this stage, although to a degree that is less than that which can be detected with the RAC or PET imaging techniques used in this study. Additional FDG PET studies in presymptomatic gene carriers with normal striatal D2 binding are needed to confirm whether the metabolic abnormalities precede the loss of striatal D2 receptors during the earliest preclinical stages of the disease process.
The contribution of striatal atrophy features critically in the interpretation of the HDRP covariance pattern as a potential imaging biomarker of HD. Volume loss in the caudate and putamen has been revealed by MRI in the preclinical period (30,31). Therefore, it is likely that appreciable partial-volume effects from focal striatal atrophy can cause reductions in striatal PET measures in presymptomatic carriers. For this reason, to identify a preclinical HDRP, we specifically chose presymptomatic carriers with normal striatal D2 binding, thus minimizing potential partial-volume effects associated with focal striatal atrophy. In this vein, we note that this topography involves regional covariation with spatially removed cortical regions that are associated with pattern-related metabolic increases as well as decreases. Although temporal lobe cell loss has been reported in HD patients at postmortem (32), routine MRI examination in the affected and presymptomatic cohorts failed to disclose discernible cortical atrophy. Moreover, focal cortical volume loss, even if present in the preclinical period, would not explain the relative functional increases noted in the occipital cortex. Thus, the HDRP topography is unlikely to be an artifact of tissue atrophy, although striatal volume loss may contribute in part to the relatively higher pattern scores noted in the symptomatic cohort. We recognize that even by limiting the network analysis to presymptomatic gene carriers with normal RAC binding, the confound of local tissue loss can only be fully addressed through the implementation of rigorous MRI-based atrophy corrections (33). Further PET studies using these routines are needed to determine the degree to which our findings can be explained by structural or metabolic effects or by a combination of both.
Having identified a discrete HDRP topography in HD gene carriers with normal striatal RAC or PET values, we computed prospectively the expression of this pattern in the other preclinical and symptomatic groups, each with low striatal D2 binding. We found that subject scores of the preclinical HDRP were abnormal in both of these groups. Interestingly, HDRP expression was elevated in the symptomatic group relative to the preclinical groups. This finding suggests that in addition to being abnormal in the earliest preclinical stages of illness, HDRP expression may increase with the progression of HD into the early symptomatic period. Therefore, this pattern may have a role as an imaging marker to be used as an adjunct for trials of potential neuroprotective agents in presymptomatic gene carriers.
CONCLUSION
Our findings show that FDG PET with network analysis can be used to identify specific patterns of abnormal brain function in preclinical HD. These patterns may also be abnormally expressed in clinically affected HD patients. The presence of discrete patterns of metabolic abnormality in preclinical HD carriers and HD patients may provide a useful means of quantifying the rate of disease progression during the earliest phases of this illness.
Acknowledgments
The authors thank Dr. Yilong Ma for assistance in data analysis, Ms. Christine Edwards for manuscript preparation, and Dr. Gwenn Smith for valuable comments. The PET studies were funded in part by the Swiss Huntington’s Disease Foundation. Data analysis was funded by National Institutes of Health grants NS RO1 37564 and NS KO8 02011.
Footnotes
Received Apr. 3, 2001; revision accepted Jul. 19, 2001.
For correspondence or reprints contact: David Eidelberg, MD, Center for Neuroscience Research, North Shore Long Island Jewish Research Institute, 350 Community Dr., Manhasset, NY 11030.
REFERENCES
In this issue


Jump to section
Related Articles
Cited By...
- Brain Metabolic Network Covariance and Aging in a Mouse Model of Alzheimers Disease
- Abnormal development of cerebellar-striatal circuitry in Huntington disease
- Abnormal brain development in child and adolescent carriers of mutant huntingtin
- Bioenergetics in fibroblasts of patients with Huntington disease are associated with age at onset
- Clinical Neurology and Epidemiology of the Major Neurodegenerative Diseases
- Striatal molecular alterations in HD gene carriers: a systematic review and meta-analysis of PET studies
- Potential biomarkers to follow the progression and treatment response of Huntingtons disease
- Distinct brain networks underlie cognitive dysfunction in Parkinson and Alzheimer diseases
- Triheptanoin improves brain energy metabolism in patients with Huntington disease
- Abnormal synchrony of resting state networks in premanifest and symptomatic Huntington disease: the IMAGE-HD study
- Shaping the role of mitochondria in the pathogenesis of Huntington's disease
- Mitochondrial Respiration and ATP Production Are Significantly Impaired in Striatal Cells Expressing Mutant Huntingtin
- Deficits in Experience-Dependent Cortical Plasticity and Sensory-Discrimination Learning in Presymptomatic Huntington's Disease Mice
- In vivo evidence of cerebellar atrophy and cerebral white matter loss in Huntington disease
- In Vivo Comparative Imaging of Dopamine D2 Knockout and Wild-Type Mice with 11C-Raclopride and MicroPET