


Abstract
SPECT with 18F-FDG has emerged as an alternative to dedicated PET for the assessment of myocardial viability. However, whether FDG SPECT can reliably quantify the extent of viable and scarred myocardium is uncertain. The aim of this study was to investigate whether SPECT with an 18F-labeled agent would provide information on defect size similar to that provided by dedicated PET. Methods: Imaging was performed using an elliptic cylinder chest phantom with simulated bone, lung, mediastinum, liver, and heart. 18F was administered into the myocardium, mediastinum, right and left ventricular cavities, and liver. Plastic inserts (n = 11) ranging in size from 2% to 60% of the myocardium were used to simulate transmural myocardial infarctions. The chest phantom was imaged with a dedicated PET camera and with a double-head SPECT camera equipped with ultra-high-energy collimators. Both SPECT and PET data were analyzed using a semiquantitative polar map approach. Defects were quantified using various cutoff thresholds ranging from 30% to 80% of peak activity and were expressed as a percentage of the left ventricular myocardium. Defect size as measured by SPECT or PET was compared with true defect size. Results: The measured SPECT defect size was highly variable depending on the cutoff used, whereas PET defect size was relatively constant over the range of cutoffs tested. The mean absolute difference between measured and true defect sizes was minimal at a cutoff of 50% of peak activity for both SPECT (3.3% ± 3.3%) and PET (2.7% ± 2.5%). For this threshold, both SPECT and PET measurements showed an excellent correlation with true defect size (r = 0.98 for SPECT and 0.99 for PET). The correlation between SPECT and PET measurements was also excellent (r = 0.99; P < 0.01). Conclusion: If an appropriate threshold is used to define a defect, SPECT with an 18F-labeled agent can accurately measure defect size similarly to the manner of PET.
For distinguishing viable from scarred myocardium in patients with severe coronary artery disease and left ventricular dysfunction in whom coronary revascularization is under consideration, 18F-FDG PET is an accurate, noninvasive diagnostic technique (1–3). However, availability and high cost limit the widespread use of PET in clinical practice. Therefore, substantial efforts have been made to develop techniques to assess myocardial viability with SPECT, which is more widely available and less expensive than PET. Of these, FDG SPECT has recently emerged (4–6). Despite limited spatial resolution and counting sensitivity in comparison with PET, FDG SPECT has been shown in several clinical studies to offer diagnostic information similar to that of PET (7–9) and compares favorably with other imaging modalities, including rest-redistribution imaging (10), stress-reinjection 201Tl imaging, and low-dose dobutamine echocardiography (6). However, whether FDG SPECT can reliably measure the extent of viable and scarred myocardium in the quantitative manner of PET remains uncertain. Such quantitative information on viability may be important for predicting patient outcome after coronary revascularization (11,12).
The aim of this study was to investigate whether SPECT with an 18F-labeled tracer would provide information on defect size similar to that provided by dedicated PET, using a cardiac phantom in which true defect size is known.
MATERIALS AND METHODS
Chest Phantom
SPECT and PET were performed using a commercially available elliptic cylinder chest phantom (320 mm wide and 220 mm thick) with simulated bone, lung, mediastinum, liver, and heart (model HL; Anzai Co. Ltd., Tokyo, Japan), as shown in Figure 1. The heart consisted of right and left ventricles with separate compartments for the blood pool and the myocardium. The volume of the simulated left ventricular myocardium was 120 mL. 18F solution, to simulate clinical studies using FDG, was administered into the left ventricular myocardium (100 kBq/mL), mediastinum (10 kBq/mL), right and left ventricular cavities, and liver (40 kBq/mL). Plastic inserts (n = 11) ranging in size from 2% to 60% of the myocardium were used to simulate transmural myocardial scars. Six anterior and 5 inferior defects were present. In this phantom, the defect area represented a scar, whereas the area without defect represented viable tissue.
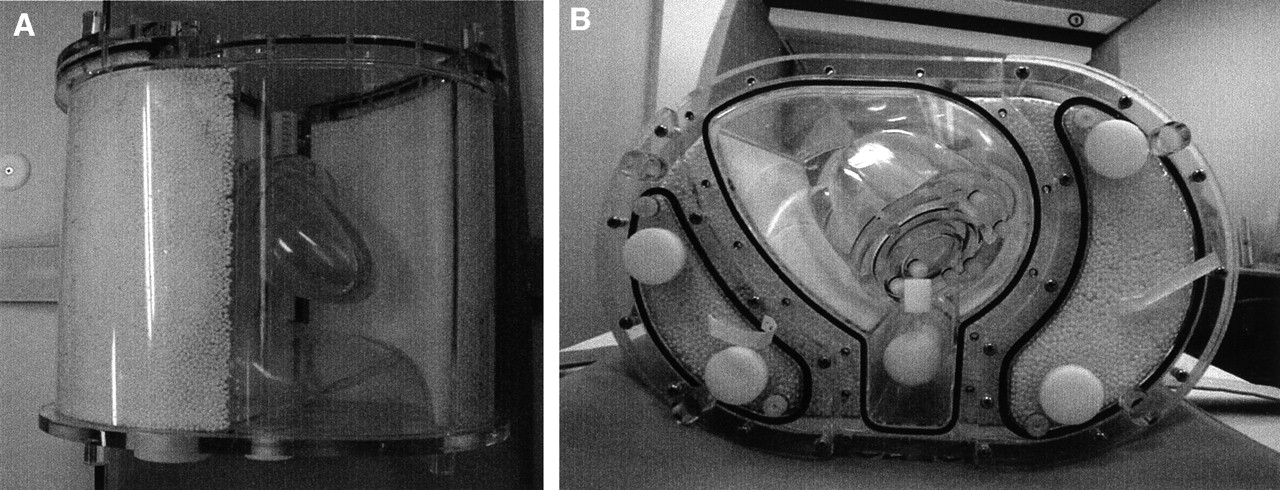
Anterior (A) and upper (B) views of elliptic chest phantom used in this study. Phantom consists of various components such as simulated thorax, lungs, bone, liver, mediastinum, and heart.
SPECT
Imaging was performed using a double-head SPECT camera in a 90° geometry equipped with ultra-high-energy, parallel-hole collimators designed for a 511-keV acquisition (Millennium VG; General Electric Medical Systems, Milwaukee, WI). This system has crystals 1.6 cm thick (0.625 in.) (13) and a spatial resolution of 11.2 mm in full width at half maximum at 10 cm from the collimator face. Images were recorded over 180° from 45° right anterior oblique to 45° left posterior oblique in 64 × 64 matrices with an acquisition time of 30 s per projection in 3° increments, resulting in a total of 60 projections. An energy window was centered on 511 keV ± 10%. Images were reconstructed using a Butterworth filter with a cutoff frequency of 0.45 and an order of 10. The image data matrix was 64 × 64, with a pixel size of 6.91 mm and a slice thickness of 6.91 mm. No scatter or attenuation correction was performed.
PET
PET was performed using a full-ring scanner (Advance; General Electric Medical Systems). The characteristics of this scanner have been described previously (14). In brief, the system has an in-plane spatial resolution of 3.8 mm in full width at half maximum at the center of the field of view and an axial resolution of 4 mm. After the phantom was positioned in the scanner, static emission data were acquired for 640 s. The phantom was then kept at the same position in the gantry until the transmission scan was completed on the following day, allowing for the physical decay of 18F activity in the phantom. Transmission data were acquired for 640 s using rotating 67Ge pin sources. Images were reconstructed using a standard filtered backprojection algorithm with a Hanning filter that had a cutoff frequency of 0.5 and a zoom of 1.57. The image data matrix was 128 × 128, with a pixel size of 2.73 mm and a slice thickness of 4.25 mm. Both attenuation correction and scatter correction were performed during image reconstruction.
Data Analysis
Both SPECT and PET data were transferred to an Octane workstation (Silicon Graphics, Mountain View, CA) by Ethernet and were analyzed using a semiquantitative polar map approach that has been developed and validated at Technische Universität München (Munich, Germany) (15,16). Briefly, an observer defined the long axis manually, and then the program automatically optimized sampling parameters using this axis as the initial estimate. The basal plane of the study was automatically determined, and a volumetric sampling algorithm encompassing the left ventricle with 540 sampling locations was used to generate polar maps. Defect size was then quantified using various cutoff thresholds ranging from 30% to 80% of peak activity with 10% increments and was expressed as a percentage of the left ventricular myocardium (%LV). Measured defect size by SPECT or PET was then compared with true defect size, and estimated error (measured defect size − true defect size) and absolute error (absolute value of estimated error) were calculated for each phantom measurement.
Statistical Analysis
Data were expressed as mean ± 1 SD. The Student t test was used to determine whether the mean estimated error was different from zero. Linear regression was performed by least-squares analysis. Bland–Altman plotting was used to analyze agreement and reveal estimation errors in the measured defect size (17). Statistical significance was defined as P < 0.05.
RESULTS
Figure 2A displays representative SPECT and PET polar maps from a phantom with an anterior defect (size, 37 %LV). By visual inspection, the border between the defect area and the area without defect was more clearly delineated on the PET than on the SPECT image. Furthermore, the background activity in the defect area seen on the SPECT image was higher than that on the PET image, likely because of the higher scatter fraction of the SPECT technique. The same polar maps with quantified defect areas using 30%, 50%, and 80% cutoffs are shown in Figures 2B, 2C, and 2D, respectively. The measured SPECT defect size was highly variable (27 %LV at a 30% cutoff, 42 %LV at a 50% cutoff, and 74 %LV at an 80% cutoff) depending on the cutoffs used to define the defect area, whereas the measured PET defect size was relatively constant over the range of cutoffs tested (41 %LV at a 30% cutoff, 43 %LV at a 50% cutoff, and 52 %LV at an 80% cutoff).
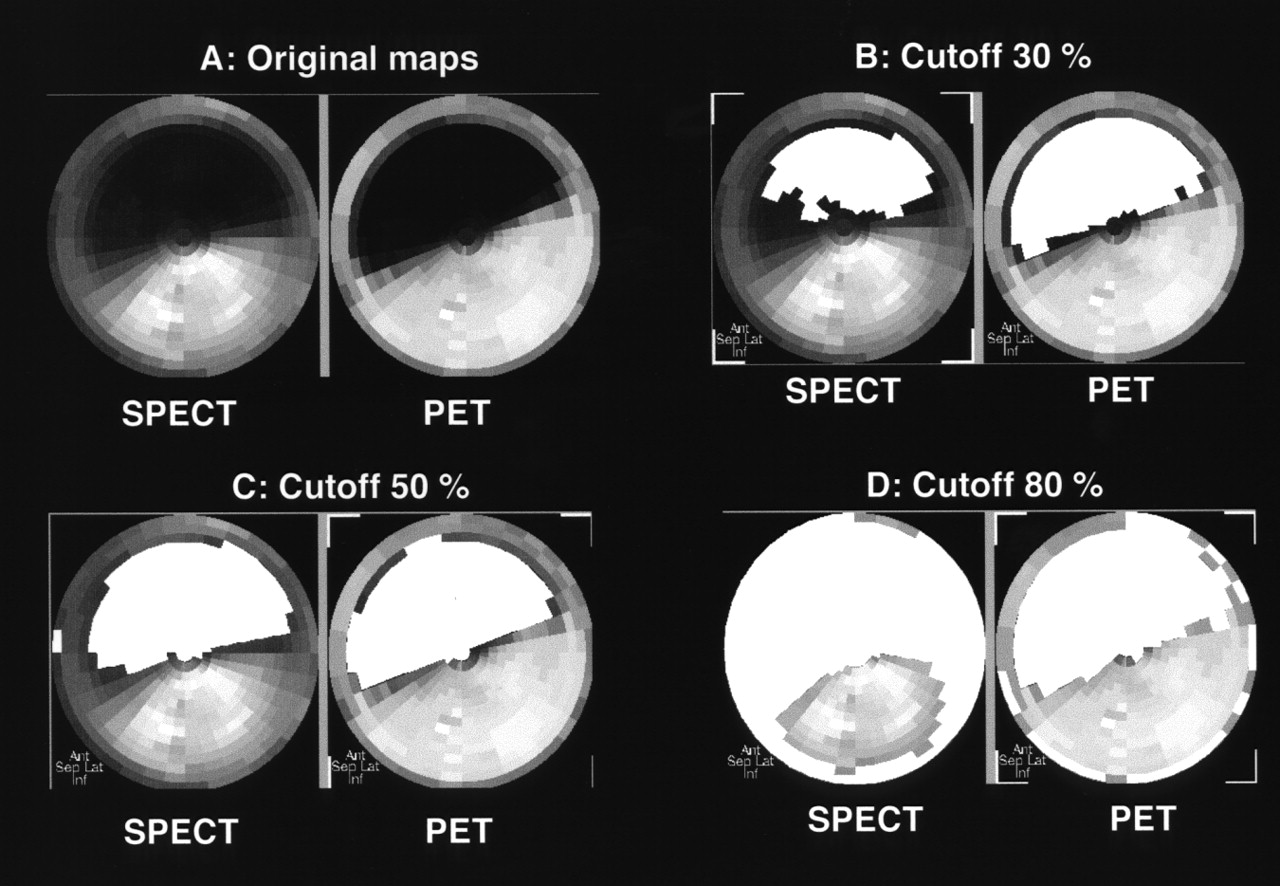
SPECT and PET original polar maps (A) and maps with quantified defect areas (filled with white) using 3 cutoff thresholds (B–D) from phantom with anterior defect (37 %LV).
Relationship Between Measured and True Defect Sizes
Table 1 summarizes the mean measured defect sizes, mean estimated errors, and mean absolute errors for both SPECT and PET using various cutoffs. At the high cutoffs (60%–80% of peak activity), the mean estimated errors with SPECT measurements were significantly greater than zero, indicating an overestimation of defect size. In particular, the degree of overestimation as expressed by the estimated error reached 38.7 ± 21.4 %LV at an 80% cutoff. In contrast, such an overestimation was found only at an 80% cutoff by PET, with a mean estimated error of 5.7 ± 4.4 %LV. On the other hand, SPECT measurements underestimated defect size at low cutoffs (30%–40% of peak activity), whereas PET measurements did not show such an underestimation. Among the various cutoffs tested, 50% of peak activity minimized the mean absolute difference between measured and true defect sizes for both SPECT (3.3 ± 3.3 %LV) and PET (2.7 ± 2.5 %LV) (Table 1).
Measured Defect Size and Estimated and Absolute Errors for SPECT and PET Measurements as Function of Cutoff to Define Defect Area
The correlations between true defect size and measured defect size as a function of cutoff level are summarized in Table 2. When various cutoffs (range, 30%–80% of peak activity) to define myocardial defects were tested, PET measurements showed minimal variations in slopes, intercepts, and correlation coefficients, whereas a small change in threshold caused a considerable change in SPECT measurements.
Results of Linear Regression Analysis Between True and Measured Defect Sizes for SPECT and PET
When 50% of peak activity was used, on the basis of our findings, as a threshold to delineate viable and scar tissue, the SPECT measurements showed an excellent correlation with true defect size (r = 0.98; P < 0.01) (Fig. 3). The Bland–Altman plot of errors over true defect sizes revealed no systematic measurement bias for SPECT measurements (slope, 0.006; r = 0.03; P = 0.9316). Similar to the results of SPECT, the PET measurements also showed an excellent correlation between measured and true defect sizes (r = 0.99; P < 0.01) (Fig. 4). The Bland–Altman plot again showed no systematic measurement bias for PET measurements (slope, 0.03; r = 0.19; P = 0.5696).

(A) Correlation between measured SPECT defect size using 50% cutoff and true defect size. (B) Bland–Altman plot of agreement and estimated error between measured SPECT defect size and true defect size.

(A) Correlation between measured PET defect size using 50% cutoff and true defect size. (B) Bland–Altman plot of agreement and estimated error between measured PET defect size and true defect size.
Effects of Defect Location on Measurements
When effects of defect location were considered, no significant differences in absolute errors were seen between anterior (n = 6) and inferior (n = 5) defects for either SPECT (2.8 ± 2.1 %LV vs. 4.0 ± 4.5 %LV, respectively, P = 0.5802) or PET (2.9 ± 2.8 %LV vs. 2.4 ± 2.2 %LV, respectively, P = 0.7510) measurements.
Identification of Small Defects
Figure 5 displays SPECT and PET polar maps from a phantom with a small defect (size, 2 %LV). Despite the limited spatial resolution of SPECT technique, the defect was still visible and measurable on SPECT images. For a 50% cutoff, the measured SPECT defect size was 0.9 %LV and the measured PET defect size was 1.7 %LV.

SPECT and PET polar maps from phantom with small defect (2 %LV). Defect areas were filled with white using 50% cutoff.
Relationship Between SPECT and PET Measurements
Figure 6 displays the relationship between PET and SPECT measured defect sizes using a 50% cutoff for both types of imaging. The defect sizes measured by SPECT closely correlated with those measured by PET (r = 0.99; P < 0.01). The Bland–Altman plot of error between SPECT and PET measurements over PET defect sizes showed no systematic bias for SPECT measurements (slope, −0.04; r = 0.21; P = 0.5282).
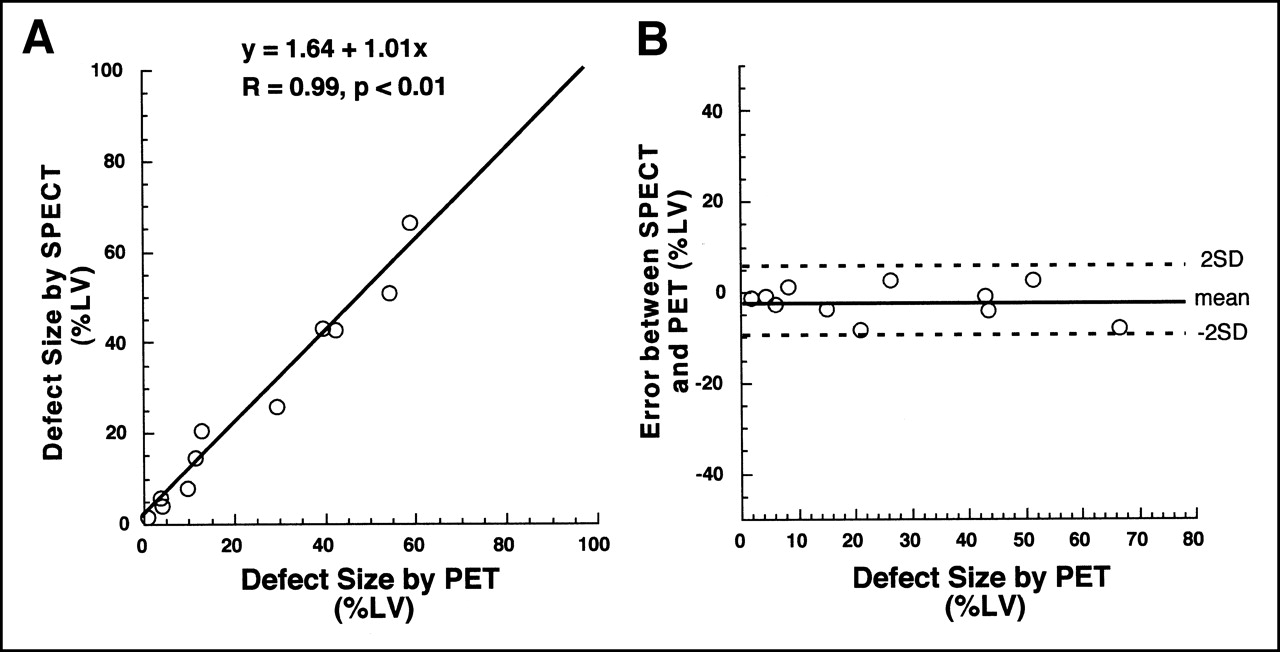
(A) Correlation between SPECT and PET measured defect sizes. (B) Bland–Altman plot of agreement and error between SPECT and PET measurements.
DISCUSSION
This study directly compared ultra-high-energy 18F SPECT with 18F PET for the estimation of myocardial defect size using a cardiac phantom with simulated infarcts. The major findings were, first, that the measured SPECT defect size varied greatly depending on the cutoffs used to define a defect, whereas PET defect size was relatively constant over the range of cutoffs tested; second, that both SPECT and PET measurements nevertheless closely correlated with true defect size if appropriate cutoffs were selected; and third, that the measured SPECT defect size correlated strongly with PET measurements.
There are distinct technical differences between SPECT and PET; the advantages of PET over SPECT include higher spatial resolution, higher counting sensitivity, and routine use of attenuation and scatter correction. The considerable change in SPECT measurements observed in this study when cutoffs were changed may at least partially be explained by the lack of attenuation and scatter correction. The underestimation of defect size by SPECT at low cutoffs, such as 30% of peak activity, likely stems from lack of scatter correction. This lack increases the background activity on the image (18) and thus reduces image contrast, as shown in Figure 2A. On the other hand, the overestimation of defect size by SPECT at high cutoffs, such as 80% of peak activity, may be explained by lack of attenuation correction of the photon. This lack creates heterogeneity of myocardial activity distribution on SPECT images, and thus, some areas without a defect may be incorrectly regarded as having a defect, as illustrated in Figure 2D. Furthermore, the difference in spatial resolution between SPECT and PET may also play a role in the agreement between quantified SPECT defect size and true defect size. In contrast to SPECT measurement, PET measurement showed an excellent correlation with true defect size over a wide range of thresholds, indicating that, as expected, PET can accurately quantify myocardial defect size. Nevertheless, both SPECT and PET measurements closely correlated with true defect size if appropriate cutoffs were selected. From a clinical viewpoint, the benefits of FDG SPECT over PET are greater accessibility and the possibility of performing dual-isotope imaging with FDG and perfusion tracer. Thus, FDG SPECT can be suitable for routine clinical use if its diagnostic accuracy is satisfactory. In this regard, our results support prior clinical results showing that, despite significantly inferior physical imaging characteristics compared with PET, SPECT with dedicated 511-keV collimators offers a low-cost, practical alternative to PET in studying myocardial viability using FDG (19).
Polar maps and circumferential count profiles have been widely used to quantify defects in myocardial SPECT and PET images using either a simple threshold technique (15,20) or a reference database–derived threshold (21). In this study, we used a simple threshold technique because many investigators have used such a method to delineate viable and scarred myocardium with both SPECT (22,23) and PET (16). The results indicate that use of a simple threshold technique may be feasible in FDG SPECT.
Several phantom studies to evaluate defect quantification using SPECT and either 99mTc-labeled agents or 201Tl have been performed (18,24–26). Very good correlations between measured and actual defect sizes were reported for all these studies. Our results are essentially consistent with these previous reports.
Our study found no significant differences in absolute errors between anterior and inferior defects measured by SPECT. This finding is explained by our use of a 50% cutoff, which is far beyond the heterogeneity of the myocardial activity distribution created by photon attenuation. An additional explanation is the higher photon energy of 18F (511 keV), and thereby fewer attenuation artifacts, compared with 99mTc (140 keV) or 201Tl (70–80 keV).
The finding that a defect as small as 2 %LV was visible and measurable on both SPECT and PET disagrees with the approximately 5 %LV lower limit for detection of infarcted myocardium found by a previous phantom study using 99mTc and SPECT (24). This disagreement may have been caused by the differences in camera systems, data processing, and analysis between the studies. In particular, our approach used volumetric sampling of the whole left ventricular myocardium.
Few PET data are available on quantifying myocardial defect size using a cardiac phantom. In a study by Nekolla et al. (15), excellent correlation was found between measured and true defect sizes, consistent with our results. Although this excellent correlation may not be surprising considering the high physical performance of PET technology compared with SPECT, our data also showed an excellent correlation between SPECT and PET measurements, indicating that the 2 imaging techniques can be used similarly to measure myocardial defect size.
Our study had several limitations. First, phantom images may not closely mimic human myocardial infarctions. In many patients, infarcts may occupy the myocardial wall to various degrees but not completely. The defect materials of the phantom did not allow systematic evaluation of nontransmural infarction. Therefore, we are uncertain whether the same 50% cutoff will continue to be valid for nontransmural infarctions. However, this limitation is present in most such phantom studies (15,18,24,25). We believe that validating the accuracy of our quantitative technique in a simple situation (e.g., transmural infarction) is essential before proceeding to a more complicated situation (e.g., nontransmural infarction).
Second, FDG imaging combined with a flow tracer is often used to assess myocardial viability in clinical practice (1,2,6,11). Although the presence of FDG uptake itself within a dysfunctional myocardium is considered to be a marker of viability, as show by a high likelihood of functional recovery after revascularization (27,28), the flow– FDG combination would provide more comprehensive information on viability. Thus, although the thresholding technique used in this study seems to be feasible for SPECT with 99mTc-perfusion tracers (24), feasibility needs to be addressed by further studies.
Finally, we did not use attenuation or scatter correction for SPECT. Although published results using attenuation- or scatter-corrected SPECT are promising (16,18), this use has not yet been validated for FDG SPECT. To date, reports of FDG SPECT without attenuation or scatter correction have been the most common (5,7,9,10,13).
CONCLUSION
If an appropriate threshold is chosen to distinguish an area with a defect from an area without a defect, SPECT using an 18F-labeled agent can accurately measure myocardial defects in a manner similar to that of PET. Although caution is required in directly applying our results to the more complicated clinical setting, they suggest that FDG SPECT, like PET, may permit accurate quantification of viable and scarred myocardium.
Acknowledgments
The authors thank Shigeo Hayashi and Chie Sawa of The Medical and Pharmacological Research Center Foundation for technical support with the SPECT and PET studies.
Footnotes
Received Feb. 9, 2001; revision accepted Jun. 12, 2001.
For correspondence or reprints contact: Ichiro Matsunari, MD, The Medical and Pharmacological Research Center Foundation, Wo 32, Inoyama-town, Hakui-city, Ishikawa, 925-0613, Japan.
REFERENCES
In this issue


Jump to section
Related Articles
Cited By...
- No citing articles found.