


Abstract
This study describes a method for quantifying cerebral blood flow (CBF) distribution in Alzheimer’s disease (AD) from SPECT images obtained with 99mTc-hexamethylpropyleneamine oxime (HMPAO) by 3-dimensional fractal analysis (3D-FA). Methods: HMPAO SPECT was performed on 68 patients with probable AD and 14 healthy control subjects. We delineated the CBF images using 4 cutoff levels (35%, 40%, 45%, and 50% of the maximal voxel radioactivity) and measured the total number of voxels in the areas surrounded by the contours obtained with each cutoff level. We calculated fractal dimensions from the relationship between the total number of voxels and the cutoff levels transformed into natural logarithms. Results: The fractal dimensions (mean ± SD) for patients with probable AD and healthy subjects were 0.74 ± 0.33 and 0.52 ± 0.09, respectively. A significant difference in the fractal dimension was found between groups (P = 0.001). Statistically significant correlations were obtained between the fractal dimension and the Mini-Mental State Examination score (r = −0.598; P < 0.0001) and between the fractal dimension and the AD Assessment Scale (r = 0.670; P < 0.0001). The fractal dimensions for subjects with clinical dementia rates (CDRs) of 0, 1, 2, and 3 were 0.52 ± 0.09, 0.63 ± 0.21, 0.77 ± 0.23 (P < 0.05 vs. the group with a CDR of 1), and 1.43 ± 0.49 (P < 0.0001 vs. the group with a CDR of 2), respectively. Conclusion: Quantification of CBF distribution on SPECT images in AD was possible using 3D-FA. The fractal dimension was well correlated with the cognitive impairment, as assessed in neuropsychologic tests. 3D-FA may be a useful method for objectively evaluating the progression of AD.
In Alzheimer’s disease (AD), measurement of regional cerebral blood flow (CBF) using SPECT reveals a decreased cortical perfusion that is typically predominant in the temporal and parietal cortices (1,2). This pattern matches that of the metabolic abnormalities that can be revealed by PET (2,3). Topographic analysis of SPECT and PET reveals regional CBF and metabolic reduction in the frontal cortices, hippocampus, and posterior cingulate cortex in addition to the parietal and temporal lobes. Variable patterns of CBF and metabolic abnormalities have also been reported (4–8). The variability of abnormality on SPECT and PET in AD is related to various patterns of cognitive impairment (6–9), although the SPECT and PET abnormalities may not be specific to AD (10,11). The ability to recognize regional CBF reduction by visual interpretation is highly dependent on the quality of SPECT images and the observer’s level of experience (12). To reduce interobserver variability in evaluation of brain SPECT studies and to allow more accurate assessment of the extent and severity of regional CBF abnormalities, observer-independent analysis and objective measurement of SPECT perfusion abnormalities are necessary.
Fractal analysis is a mathematic tool for dealing with complex systems that have no characteristic length scale (scale invariant). Concepts of fractal analysis are most useful in characterizing the structure of branching trees, such as those found in pulmonary airways and in blood vessels (13,14). Scale-invariant systems are usually characterized by noninteger dimensions, which are termed fractal dimensions. Spatial variation in ventilation, regional blood flow, and metabolism in the living organ is measurable even with low spatial resolution techniques such as PET and SPECT (15–17). The observed variance has been reported to increase with the increasing number of subregions in the organ studied (17). This resolution-dependent variance can be described by fractal analysis (17).
It is well established that biologic systems show considerable spatial and temporal heterogeneity (18,19). We regard variable patterns of CBF abnormality on brain SPECT in AD as the heterogeneity of CBF distribution and hypothesize that the severity of the heterogeneity of CBF distribution may reflect the severity of dementia and may be related to specific neuropsychologic abilities. Following the suggestion that fractal analysis can be applied to data acquired with low spatial resolution techniques such as PET and SPECT, we developed a 3-dimensional fractal analysis (3D-FA) to quantify the spatial heterogeneity of CBF distribution on SPECT images obtained with 99mTc-hexamethylpropyleneamine oxime (HMPAO). In this study, we report the application of 3D-FA to CBF SPECT images in AD and examine whether 3D-FA is useful for evaluating the progression of AD.
MATERIALS AND METHODS
Subject Selection
The study population consisted of 68 patients with probable AD and 14 healthy control subjects whose characteristics are displayed in Table 1. Patients were recruited from the Department of Neuropsychiatry at Ehime University School of Medicine between March 1996 and March 2000. The clinical diagnosis of probable AD was based on criteria of the National Institute of Neurological and Communicative Disorders/Stroke and Alzheimer’s Disease and Related Disorders Association (20). All patients had a history of gradually progressive intellectual deterioration without focal motor or sensory signs and a laboratory examination profile that was negative for other major illnesses. The inclusion criteria consisted of being right-handed and having an interval of <3 mo between cognitive testing (21–23) and the SPECT study. Mild cases were included in the analysis only when they fulfilled the clinical criteria for probable AD in a subsequent clinical follow-up. Patients with magnetic resonance (MR) evidence of focal brain lesions and MR angiographic evidence of occlusive lesions in the cervical and intracranial arteries were excluded.
Subject Characteristics
Fourteen cognitively intact, right-handed, healthy control subjects of similar age were recruited by advertising. Informed consent was obtained from all patients or their relatives.
Data Acquisition
HMPAO was labeled with 99mTc on site shortly before administration. The dose was approximately 1,036 MBq (28 mCi). The radiopharmaceutical was injected into an antecubital vein while each subject lay in a supine position with eyes closed in a secluded examination room. SPECT was performed 10 min after the injection. A SPECT scanner (SPECT-2000H; Hitachi Medical Corp., Tokyo, Japan), incorporating a 4-head rotating gamma camera with an in-plane and axial resolution of 8 mm full width at half maximum and equipped with low-energy, high-resolution collimators, was used for scanning. Image reconstruction was performed by the filtered backprojection method using a Butterworth filter as a preprocessing filter (order, 10; cutoff frequency, 0.25 cycle/pixel). Attenuation correction was performed using Chang’s method by assuming the object shape to be an ellipse for each slice and the attenuation coefficient to be uniform (0.08 cm−1). Correction for scattered photons was not performed.
Fractal Analysis
As described in our previous work (24–26) with natural objects, familiar matrices from classical geometry such as length, area, and volume depend on the scale at which we decide to look at the object. Fractal geometry characterizes where the relationship between a measure (M) and the scale (ε) is expressed as:
 Eq. 1
where k is a scaling constant and D is termed the fractal dimension (13).
Eq. 1
where k is a scaling constant and D is termed the fractal dimension (13).
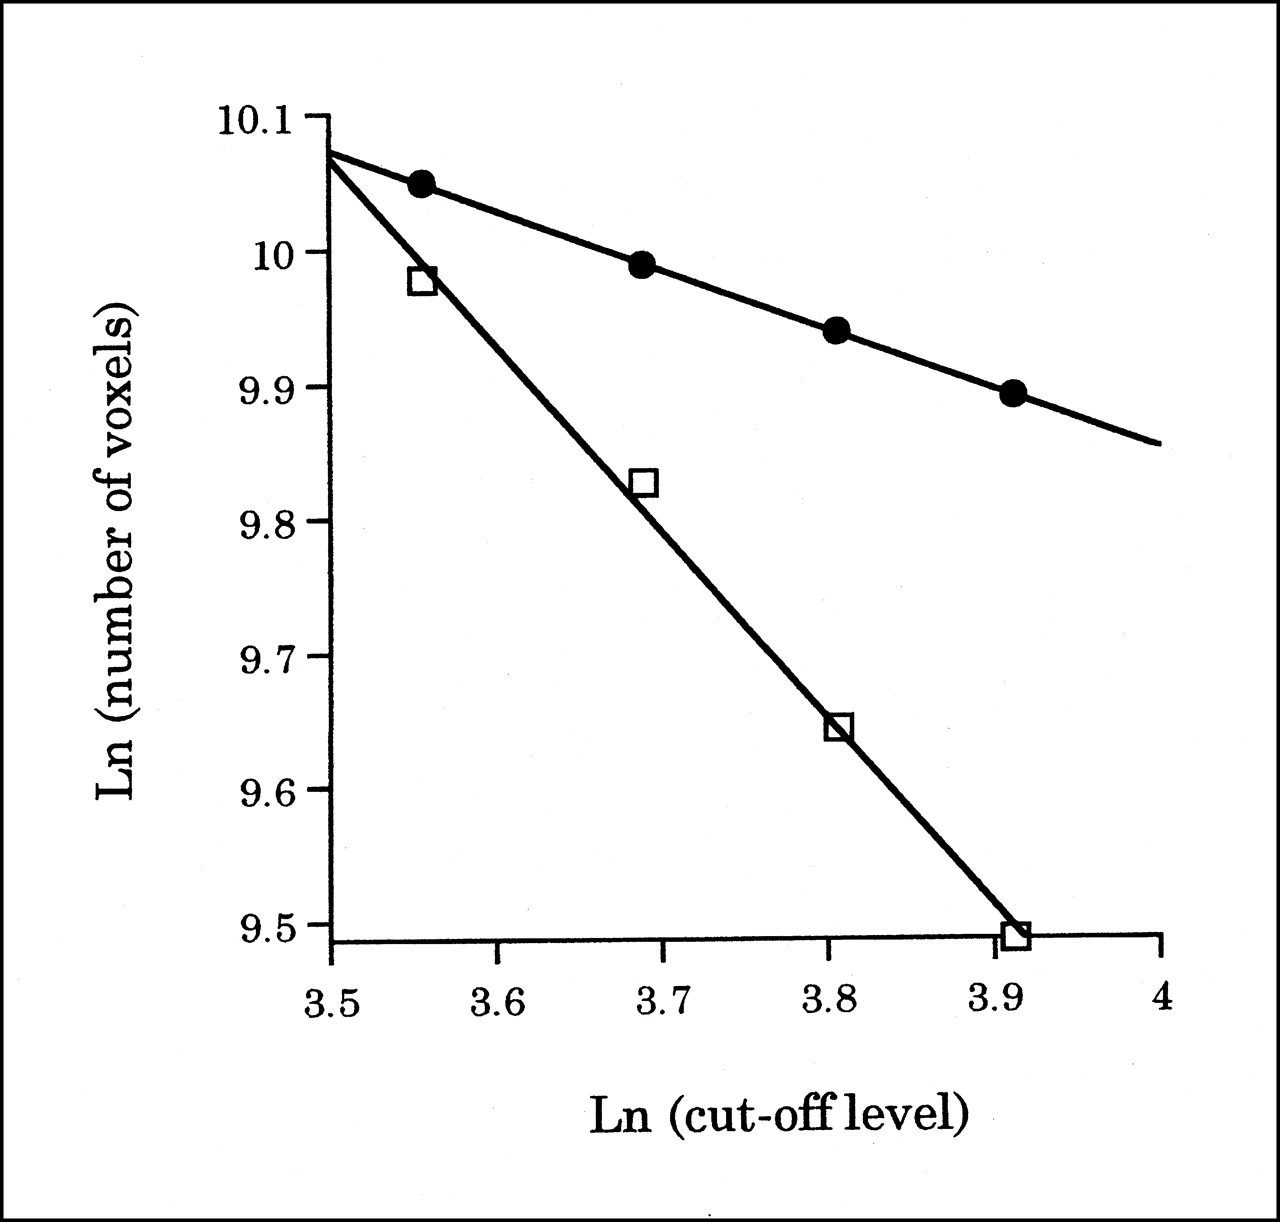
We delineated the brain at 35%, 40%, 45%, and 50% cutoff levels of the maximal voxel radioactivity in all slices of SPECT images and measured the total number of voxels in the areas surrounded by the contours obtained with each cutoff level (Fig. 1). In this study, the cutoff level of the maximal voxel radioactivity was used as ε and the total number of voxels measured was used as M(ε), as in Equation 1. In practice, we calculated a linear regression equation from the total number of voxels and cutoff levels transformed into natural logarithms and obtained the fractal dimension from the slope of the linear regression equation (Fig. 2).

Comparison of 3D surface rendering of SPECT data with changing cutoff levels. Cutoff levels from left side are 35%, 40%, 45%, and 50%. (Top) A 55-y-old healthy female volunteer, whose fractal dimension is 0.444. (Bottom) A 52-y-old woman with probable AD, whose fractal dimension is 1.388. In patients with probable AD, multiple and irregular perfusion defects, predominantly in temporal and parietal cortices, become larger with increasing cutoff levels. Amorphous change for this range of cutoff is fractal form in 3 dimensions.

Graph shows method of calculating fractal dimensions. Abscissa represents cutoff levels transformed into natural logarithms (Ln), and ordinate represents natural logarithm of number of voxels in areas surrounded by contours obtained with each cutoff level. Slope of linear regression equation corresponds to fractal dimension. A 55-y-old healthy female volunteer (•) (y = −0.44x + 11.63; r = 1.00) and 52-y-old woman with probable AD (□) (y = −1.39x + 14.92; r = 0.99) are same subjects as in Figure 1.
Statistical Analysis
Comparison of the fractal dimension between healthy control subjects and patients with probable AD was done using the Mann–Whitney U test. Correlations between the fractal dimension and the Mini-Mental State Examination (MMSE) score and between the fractal dimension and the AD assessment scale (ADAS) were determined using the Pearson correlation coefficient. Comparison of the clinical dementia rate (CDR) among groups was done by 1-way ANOVA with a multiple comparison test. P < 0.05 was considered significant.
RESULTS
The fractal dimensions (mean ± SD) for patients with probable AD and healthy subjects were 0.74 ± 0.33 and 0.52 ± 0.09, respectively (Fig. 3). A significant difference in the fractal dimension was found between the probable AD and control groups (P = 0.001). In all cases, the relationship between the cutoff level and the total number of voxels transformed into natural logarithms became linear, and the correlation coefficient (mean ± SD) between them was 0.99 ± 0.02, respectively.
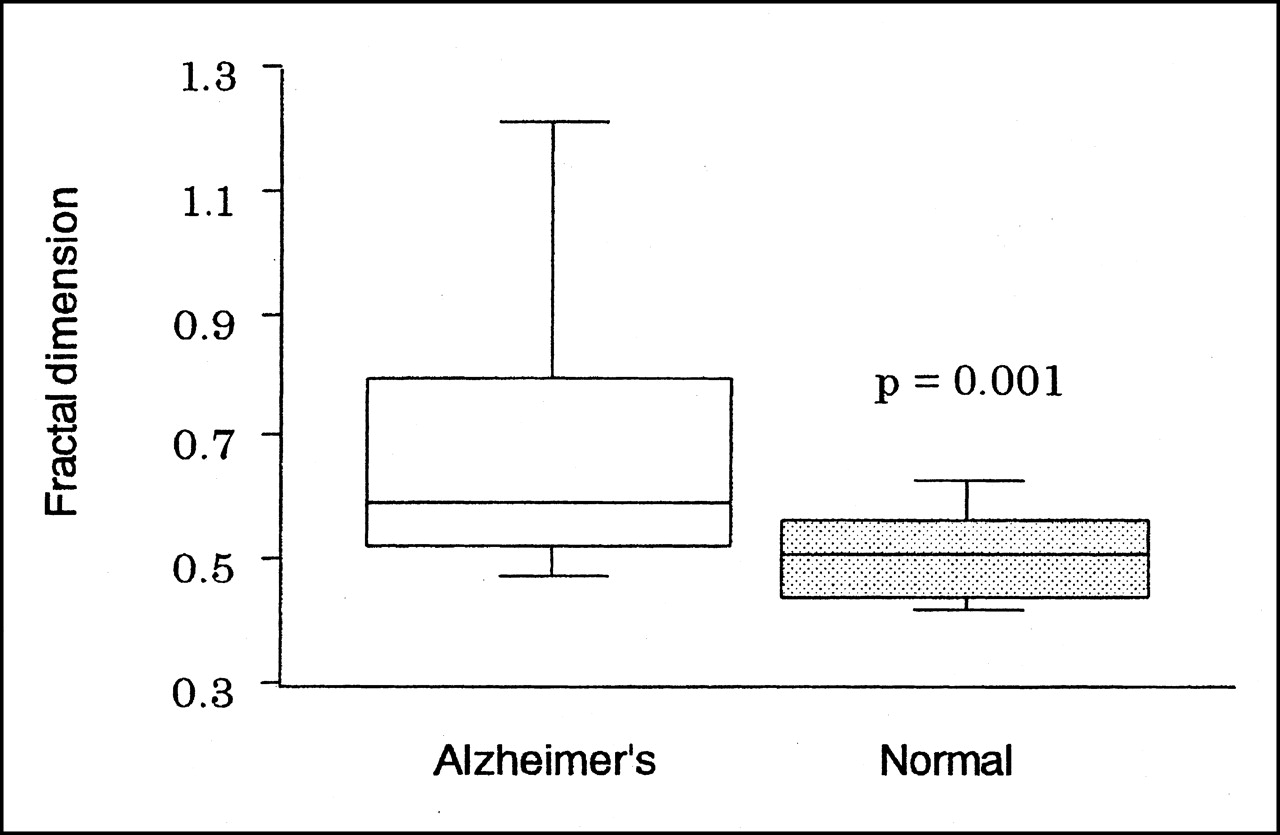
Box-and-whisker plot shows fractal dimensions for patients with probable AD and healthy (Normal) controls. Boxes represent 25%–75% range with bisecting lines showing median value and horizontal lines representing 10%–90% range. Significant difference (P = 0.001) in fractal dimensions was found between groups.
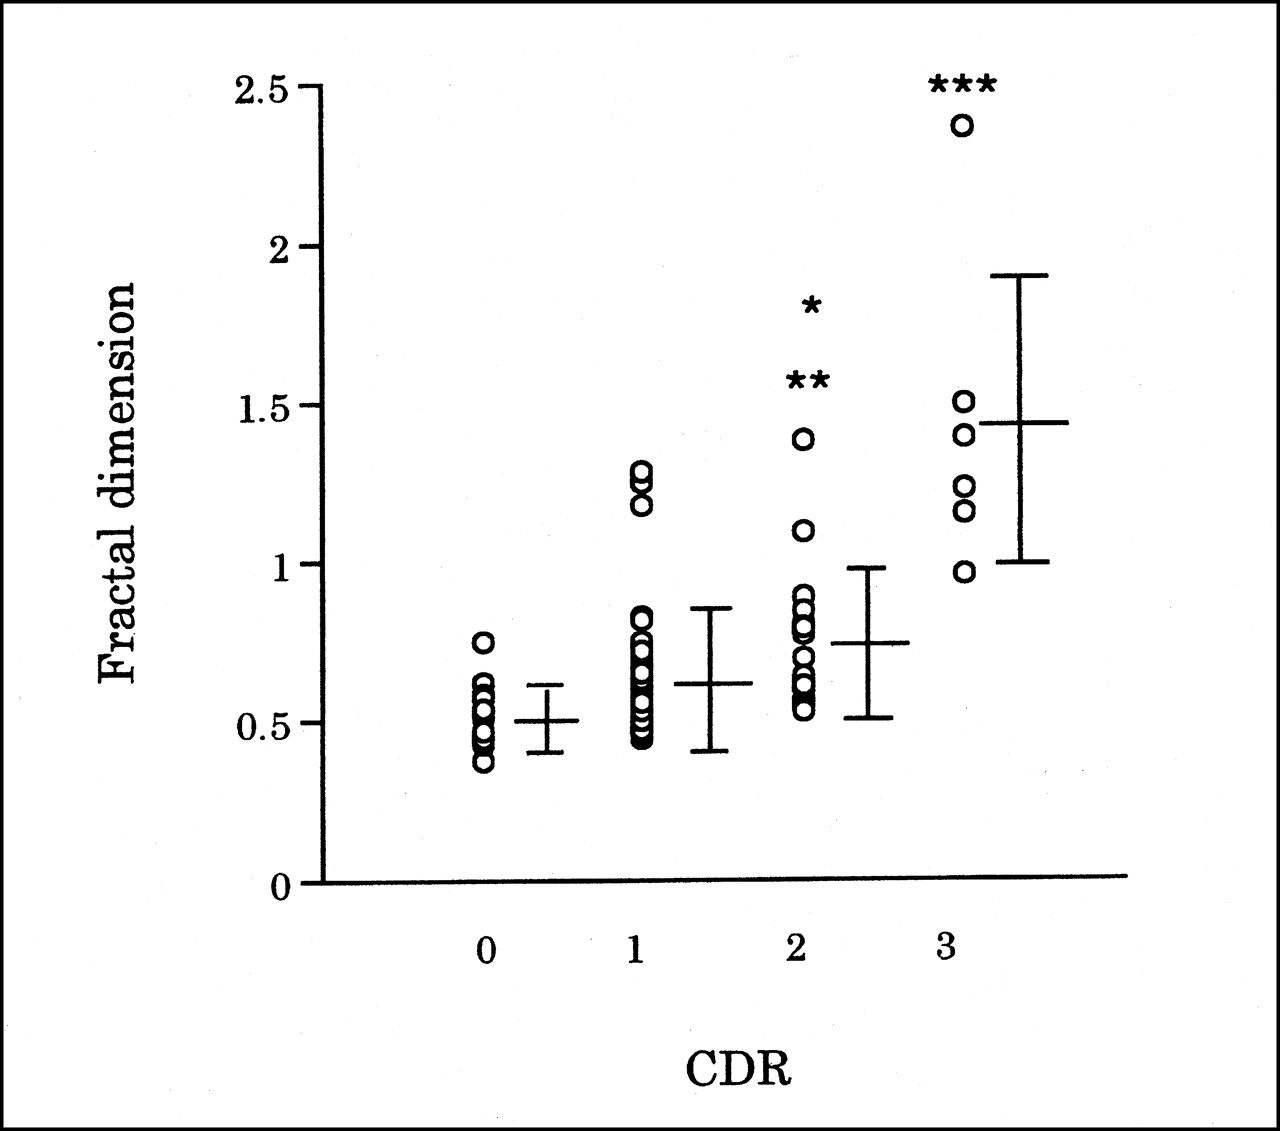
Correlations between the fractal dimension and the MMSE score and between the fractal dimension and the ADAS were investigated for 68 patients with probable AD and 14 healthy subjects. Statistically significant correlations were obtained between the fractal dimensions and MMSE scores (r = −0.598; P < 0.0001) (Fig. 4) and between the fractal dimensions and the ADAS (r = 0.670; P < 0.0001) (Fig. 5). The fractal dimensions for subjects with CDRs of 0, 1, 2, and 3 were 0.52 ± 0.09, 0.63 ± 0.21, 0.77 ± 0.23 (P < 0.05 vs. the group with a CDR of 1), and 1.43 ± 0.49 (P < 0.0001 vs. the group with a CDR of 2), respectively (Fig. 6). Subjects with a CDR of 0 were healthy controls.
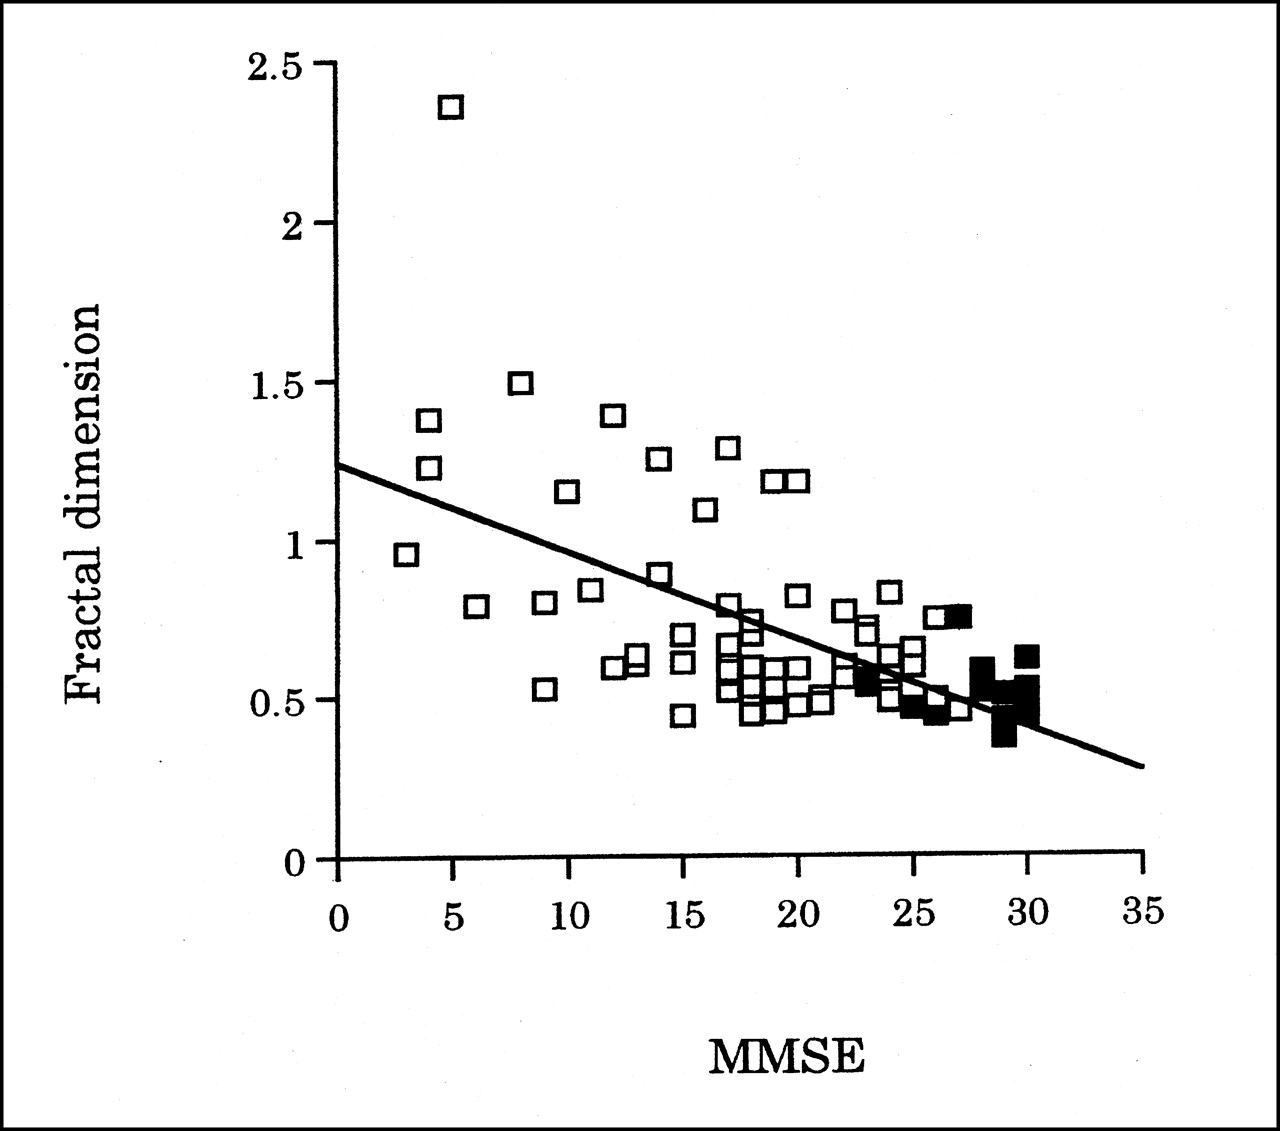
Scatter plot of fractal dimension and MMSE score for 68 patients with probable AD (□) and 14 healthy subjects (▪). Fractal dimension had significant correlation with MMSE score. Best-fit line is shown (y = −0.028x + 1.24; r = −0.598; P < 0.0001).

Scatter plot of fractal dimension and ADAS for 68 patients with probable AD (□) and 14 healthy subjects (▪). Fractal dimension had significant correlation with ADAS. Best-fit line is shown (y = 0.015x + 0.40; r = 0.670; P < 0.0001).

Scatter plot of fractal dimension and CDR for 68 patients with probable AD and 14 healthy subjects. Horizontal lines represent mean and SD. *P < 0.005 vs. group with CDR of 0. **P < 0.05 vs. group with CDR of 1. ***P < 0.0001 vs. group with CDR of 2.
DISCUSSION
In this study the fractal dimension was regarded as a quantitative measurement for the heterogeneity of CBF distribution in AD. The fractal dimension for patients with probable AD is significantly greater than that for healthy controls (Fig. 3). The fractal dimension was well correlated with the cognitive impairment, as assessed in neuropsychologic testing, especially among patients with moderate and severe cognitive impairment (Figs. 4–6). These results suggest that CBF distribution becomes more heterogeneous when AD progresses in the moderate and end stages. On the other hand, Figures 4–6 show overlap between healthy controls and patients with mild cognitive impairment. 3D-FA may have a limitation in that it cannot discriminate the heterogeneity of CBF between groups. A difference in the fractal dimension was found among healthy aged controls as well as in neuropsychologic testing. Occasionally, the fractal dimension does not represent a small CBF reduction. These reasons were considered to overlap between groups in Figures 4–6. For example, SPECT images of a 74-y-old woman with very early AD show reduction of the right hippocampus by visual assessment, whereas her fractal dimension (0.50) is smaller than that for the healthy control group (mean, 0.52). In this case, we divided mainly temporal lobes from the whole brain using hippocampal planes on SPECT images and attempted to calculate the fractal dimension for each region. The fractal dimension for each region (0.68) was greater than that for the whole brain (0.50). Modified 3D-FA showed a small CBF reduction. If we calculate the fractal dimension for a region that is segmented to various lobes, it might be possible to represent a region-specific association in very early AD.
An HMPAO SPECT study was performed twice during a 24-mo period on a 52-y-old woman with probable AD. The fractal dimension obtained in the first study was 0.72, which increased to 0.81 in the second study with the cognitive impairment progressing. The fractal dimension is independent of the observer and is an objective measurement, which is different from the neuropsychologic tests and the visual assessment of SPECT images. If we could investigate the change in the fractal dimensions over a long period of time, we could elucidate more clearly the clinical usefulness of our method in evaluating the progression of AD. In addition to the objectivity, the computer automatically calculates the fractal dimension without using special software. As a simple method, 3D-FA is applicable for routine clinical use.
The reduction of regional CBF in AD is associated with neuronal dysfunction and the lack of integrity of cortical neurons and neuropil (27–30). The neurons that are lost in AD or have the most neurofibrillary tangles are the large pyramidal cells whose long axons form corticocortical connections (31). The laminar distributions of neurofibrillary tangles and of senile plaques suggest selective impairment of corticocortical connection (32). Parts of the brain affected in AD are tightly connected with each other, and global neurodegeneration and remote effects from severely affected areas take part in the global CBF distribution (33,34). As morphologic characteristics of corticocortical connection in AD, we hypothesize that CBF distribution becomes more heterogeneous with progressing AD and the heterogeneity of CBF distribution may be related to the overall cognitive impairment in AD. On the basis of this hypothesis, 3D-FA would appear to be applicable to a quantitative method of brain SPECT to evaluate the cognitive impairment in AD.
The important factor for calculating the fractal dimension from SPECT images is the range of cutoff levels used. The slight reduction of cortical CBF is considered a main target for this analysis because the first affected brain structure with progressing AD is the cerebral cortex. Thus, we selected the range of cutoff levels, which is expressed as the change of cortical CBF and defined the minimum cutoff level as 35%, and used 4 cutoff levels (35%, 40%, 45%, and 50%) (35). In all cases, the relationship between the cutoff level and the total number of voxels transformed into natural logarithms became linear, and the correlation coefficient (mean ± SD) between them was 0.99 ± 0.02. Three-dimensional images of CBF obtained by HMPAO appeared to have a fractal form for this range of cutoff levels (Fig. 1) (13). These data support the cutoff levels used in this analysis as reasonable.
Compared with previous 2-dimensional fractal analysis of SPECT and PET (15–17), 3D-FA seems to be more advantageous for quantifying spatial variation in living organs because, in reality, all diseases in living organs progress in 3 dimensions. Original fractal geometry can serve as a design principle for fundamental patterns of biologic morphogenesis (13,14). In addition, 3D-FA might be useful to assess functional impairment based on spatial variation in living organs.
CONCLUSION
Quantification of CBF SPECT images in AD was possible using 3D-FA. The fractal dimension quantifying the heterogeneity of CBF distribution is well correlated with the cognitive impairment, as assessed in neuropsychologic testing. 3D-FA may be a useful method for objectively evaluating the progression of AD.
Acknowledgments
The authors are grateful to Prof. Hirotaka Tanabe in the Department of Neuropsychiatry, Ehime University School of Medicine, for supporting this study.
Footnotes
Received Aug. 22, 2000; revision accepted May 29, 2001.
For correspondence or reprints contact: Michinobu Nagao, MD, Department of Radiology, Ehime University School of Medicine, Shitsukawa, Shigenobu-cho, Onsen-gun, Ehime 791-0295, Japan.
REFERENCES
In this issue


Jump to section
Related Articles
Cited By...
- A Simple Interpretation of Fractal Analysis of Images
- Blood Flow Heterogeneity Versus Cerebral Hypoperfusion Revealed by Fractal Analysis on 99mTc-HMPAO SPECT
- Statistical Image Analysis of Cerebral Blood Flow in Vascular Dementia with Small-Vessel Disease
- Fractal Analysis of Nuclear Medicine Images Again: Validity and Interpretation of Results from New Analysis Methods
- Fractal Analysis of Cerebral Blood Flow Distribution in Alzheimer's Disease